Uber rider session state machine
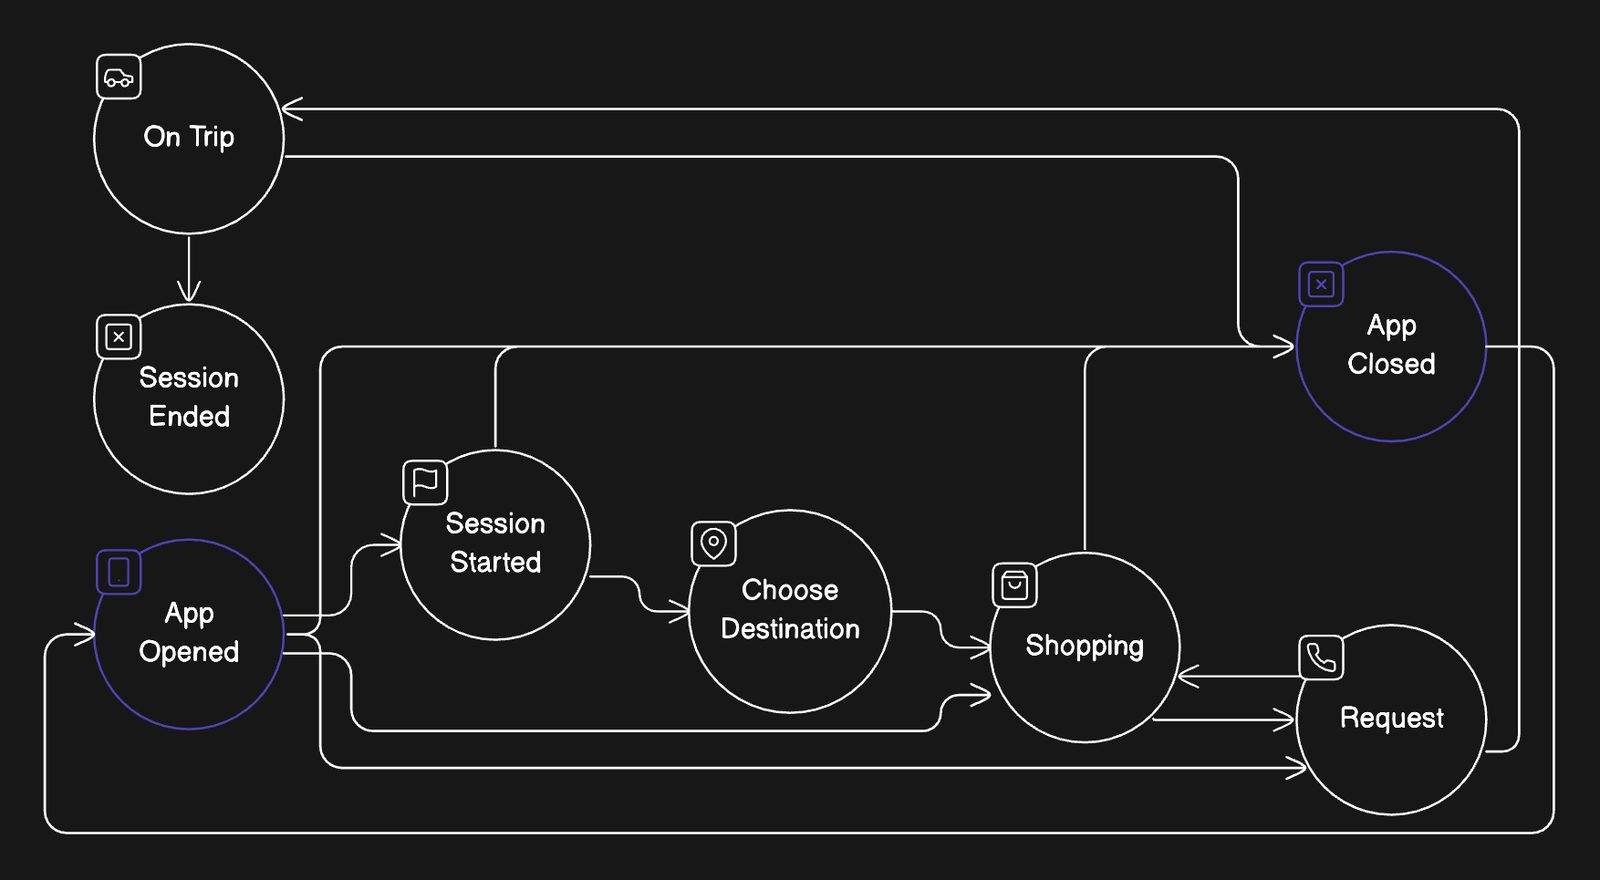
Visualize the user interaction flow within a ride-hailing application with this user journey example.
 State Diagrams
  Flow Chart
 About this example
User journey mapping is a powerful tool for understanding the experience of users within an application. This diagram depicts a typical user journey in a ride-hailing app:
- App Interaction: Starts from the user opening the app and progresses through session start, destination selection, and service options like shopping or requesting a ride.
- State Transitions: Details the transitions between different states such as app opened, choosing a destination, and making a request.
- Trip Completion: Shows the flow from being on a trip to session end, and also includes the scenario where the user might close the app.
- Order Fulfillment: Connects the successful completion of a request to the fulfillment of the service, which in this case is the user being on a trip.
When to use
- UX/UI Design: When designing or improving the user interface and experience of a mobile app.
- Feature Implementation: When deciding on the implementation of new features and understanding their impact on the current user flow.
- Process Optimization: When identifying bottlenecks in the app usage process and seeking to streamline the user’s journey.
How to use
- Start editing: Duplicate the example file and double-click on the diagram to tailor it to your application’s specific user journey.
- Customize diagram: Add or modify nodes, groups, and relationships to align with the unique flows and features of your app.
- Customize layout: Drag elements on the diagram directly on the canvas to reflect an intuitive and efficient user flow.
- Collect feedback: Share the diagram with your development team, UI/UX designers, and stakeholders to gather insights and iterate on the design.
Related Examples
View all examples →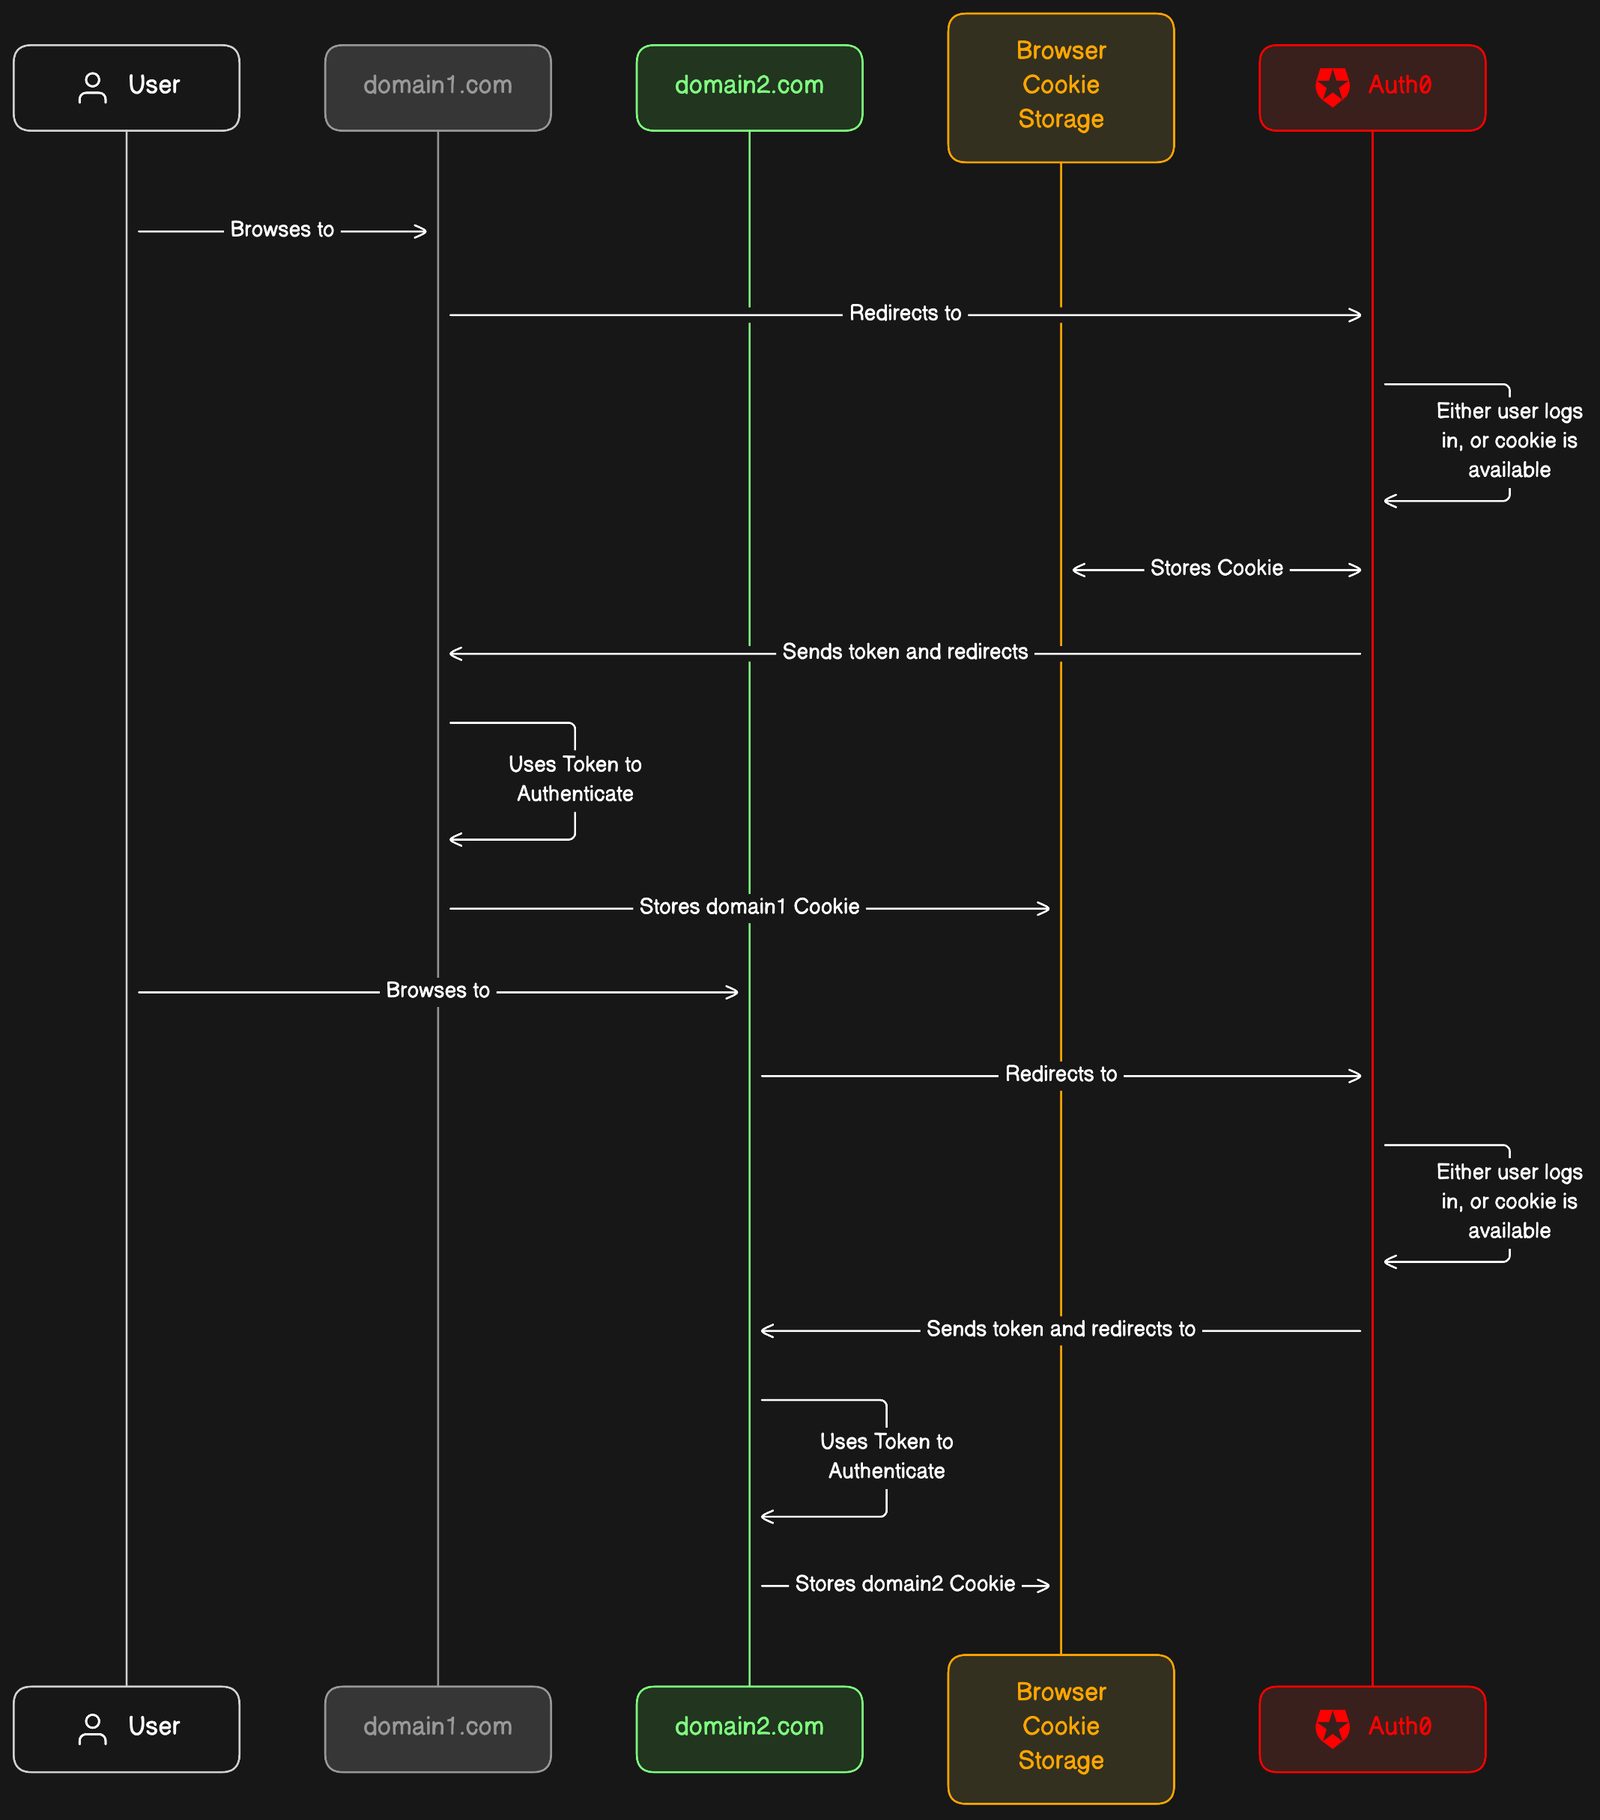
Auth0 SSO
Optimize your cross-domain user authentication experience with the Auth0 integration example.
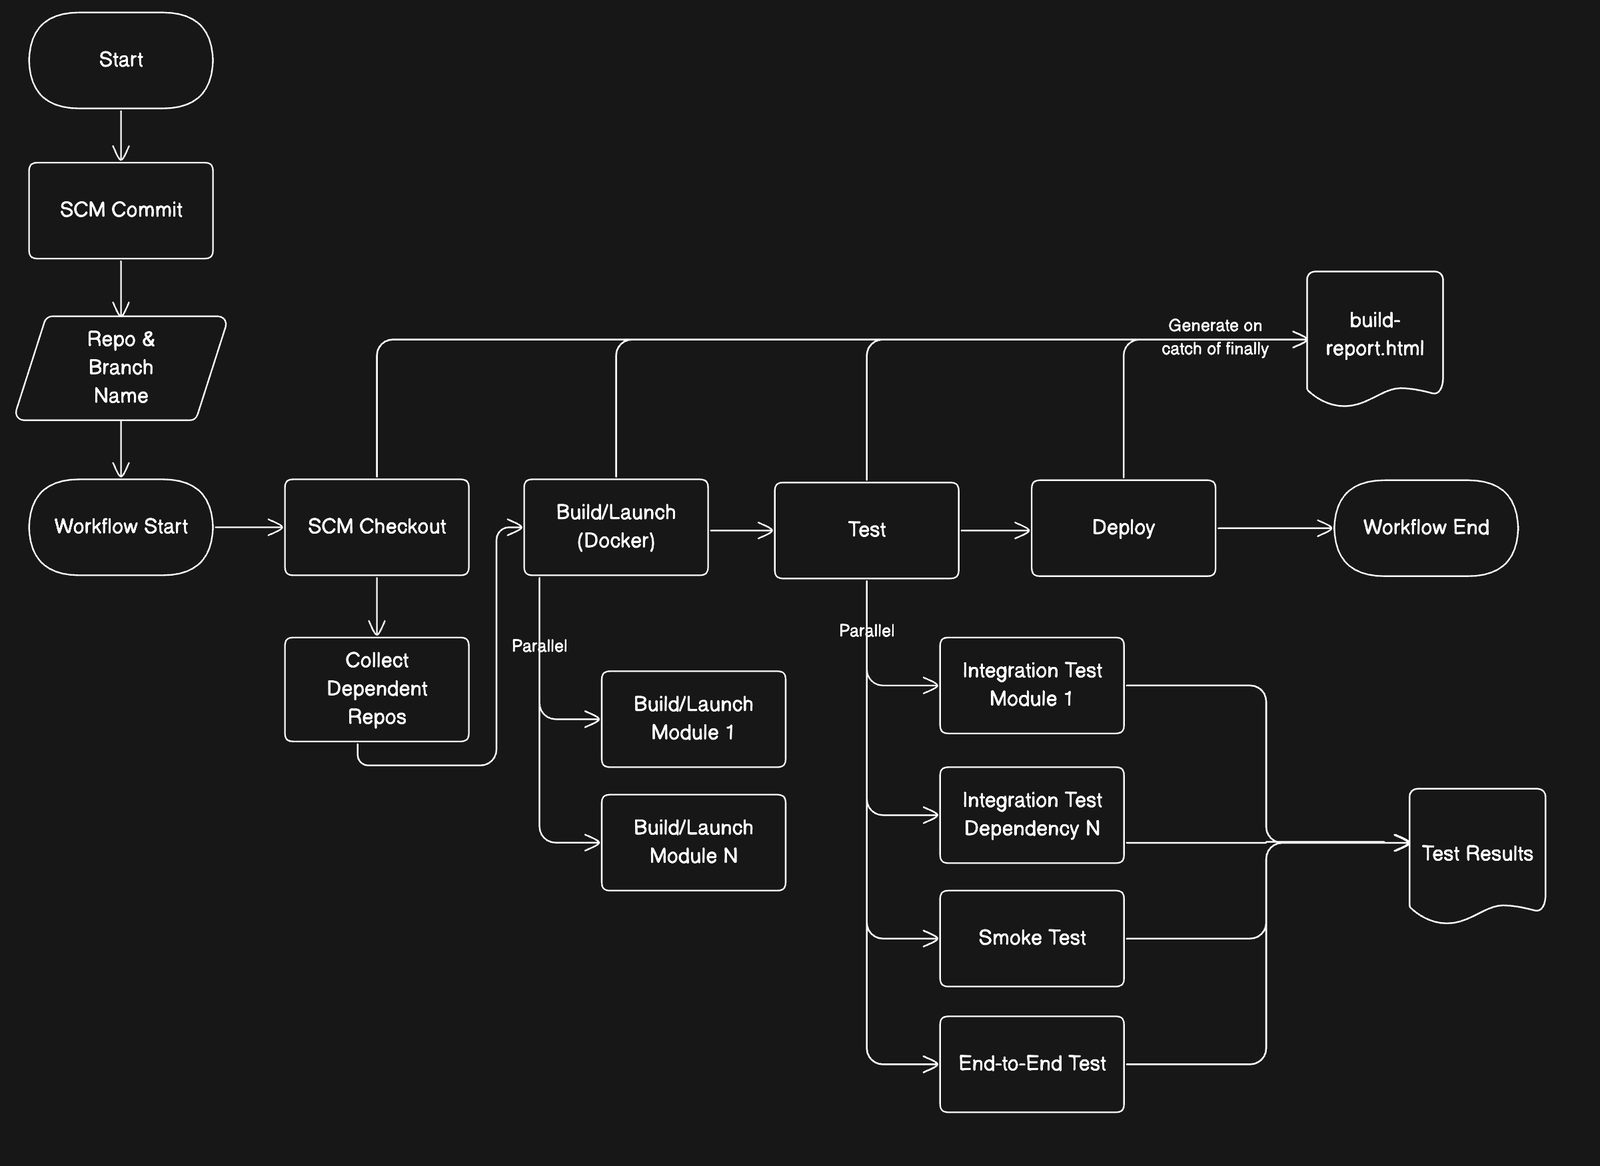
Jenkins CI/CD
Visualize and optimize your software delivery process with the Jenkins CI/CD Pipeline Workflow example.
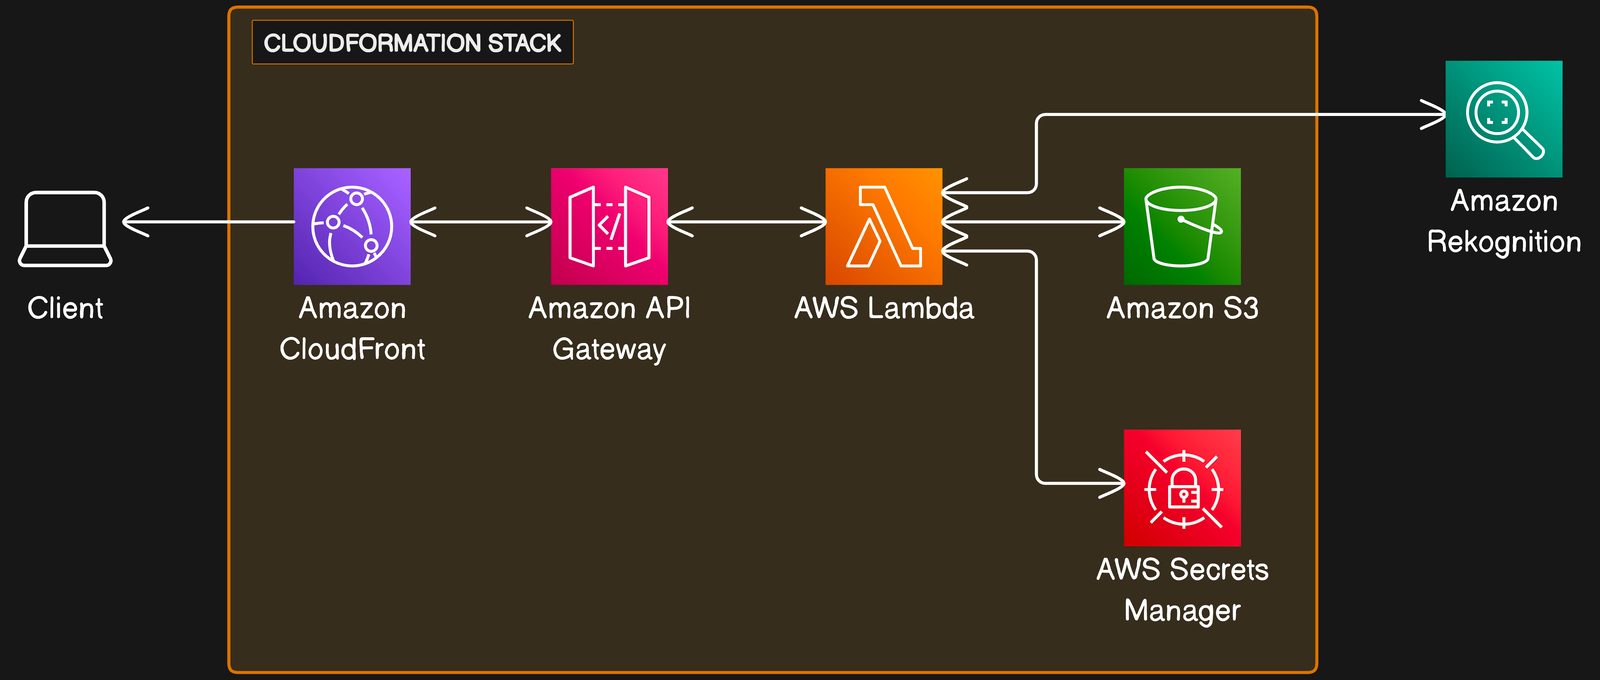
Serverless Image Handler on AWS
Visualize your image processing architecture with the Serverless Image Handler on AWS example.
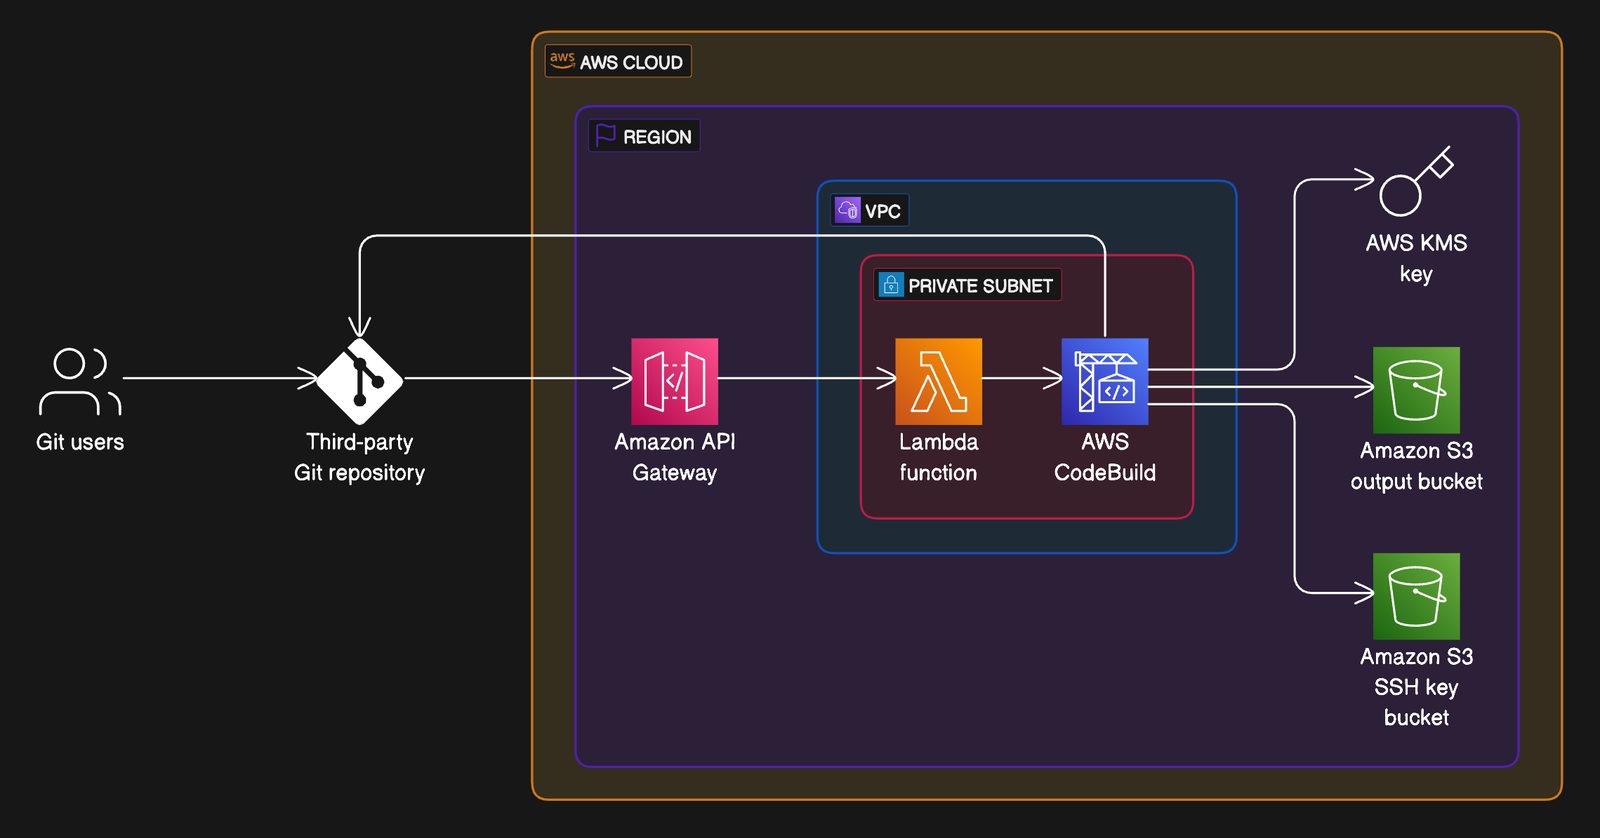
Git to S3 using Webhooks
Visualize your code deployment workflow from Git to S3 using Webhooks with this AWS infrastructure example.
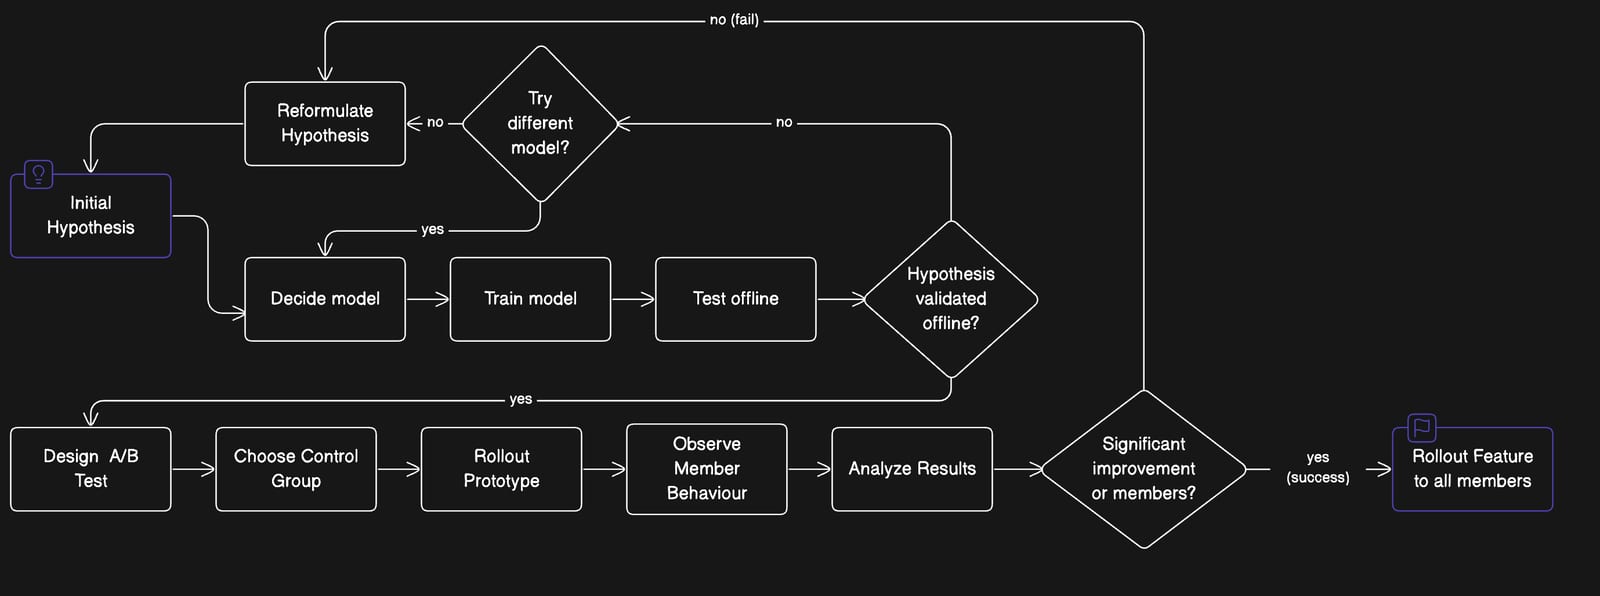
Netflix model testing process
Refine your feature development strategy with the Netflix Model Testing Process example.
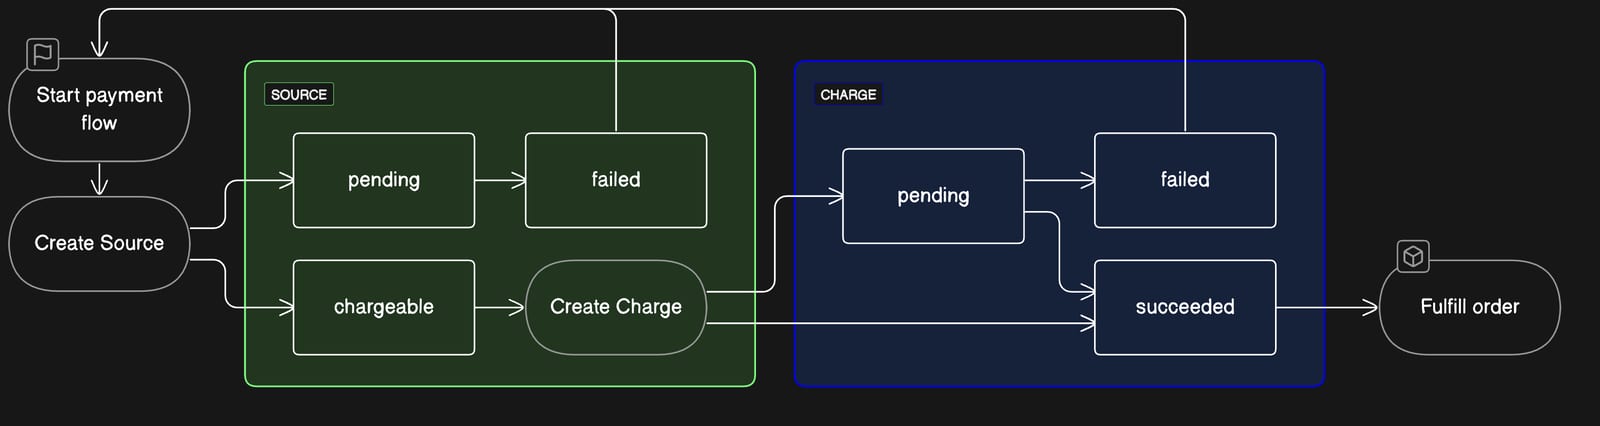
Stripe payment state machine
Streamline your e-commerce transactions with the Stripe Payment State Machine example.
See you in the canvas
Unlock your team’s collaborative super powers.