Introducing maps
AI-powered architecture maps
 Shin Kim · October 28, 2026
Today we’re launching maps. Eraser’s AI builds an interactive map of your architecture from your cloud, code, CMDB and spreadsheets. One map holds every level and every state of a system. Start at the overview, click into any system to go a level deeper, and play a flow to see how it works.
Understanding is the bottleneck
AI is making code cheaper to write and to rewrite. An agent can refactor a codebase or port it to another language, so code debt is getting cheap to repay. Architecture debt isn’t. Migrating data, replacing a vendor or moving a data center happens to live systems, across teams, and there’s no revert. Someone has to own those tradeoffs, and that someone is still an architect.
Cheaper execution doesn’t shrink that job. It means more projects, bigger ambitions and more complexity to keep track of. Each decision starts with the same work: understanding what exists, what’s proposed, and what the change would mean. Building and sharing that understanding still takes weeks.
Our capacity to produce systems is growing faster than our capacity to understand and govern them.
Diagrams hit four limits
Diagrams are the workhorse of architecture, and we like them more than anybody. But a diagram runs into four limits.
The complexity ceiling. A static picture can only carry so much before it stops helping. Add detail and it gets harder to read. Remove detail and it’s less useful for decisions. Split it into several diagrams and readers have to reconnect them in their heads.
No data behind it. A diagram is a drawing. Its boxes aren’t tied to the systems they stand for, so you can’t filter it, query it or trace a box back to its source.
Upkeep. Diagrams take a lot of work to keep current. As systems change, someone has to reconcile the picture with reality and keep related pictures consistent.
The voiceover. A diagram usually needs someone beside it to guide attention, walk through the sequence and tell the story. That explanation disappears when the meeting ends.
Maps overcome these limits. A map is made of linked views, each with a diagram, the data behind it, walkthroughs and other interactions.
The same architecture, as a diagram and as a map
Kestrel Outfitters, an outdoor retailer, is leaving its Denver data center for AWS in three waves. That means a current state, a state after each wave, and a target. Each has applications, infrastructure, network links and dependencies. Put all of it on one canvas and you get this:
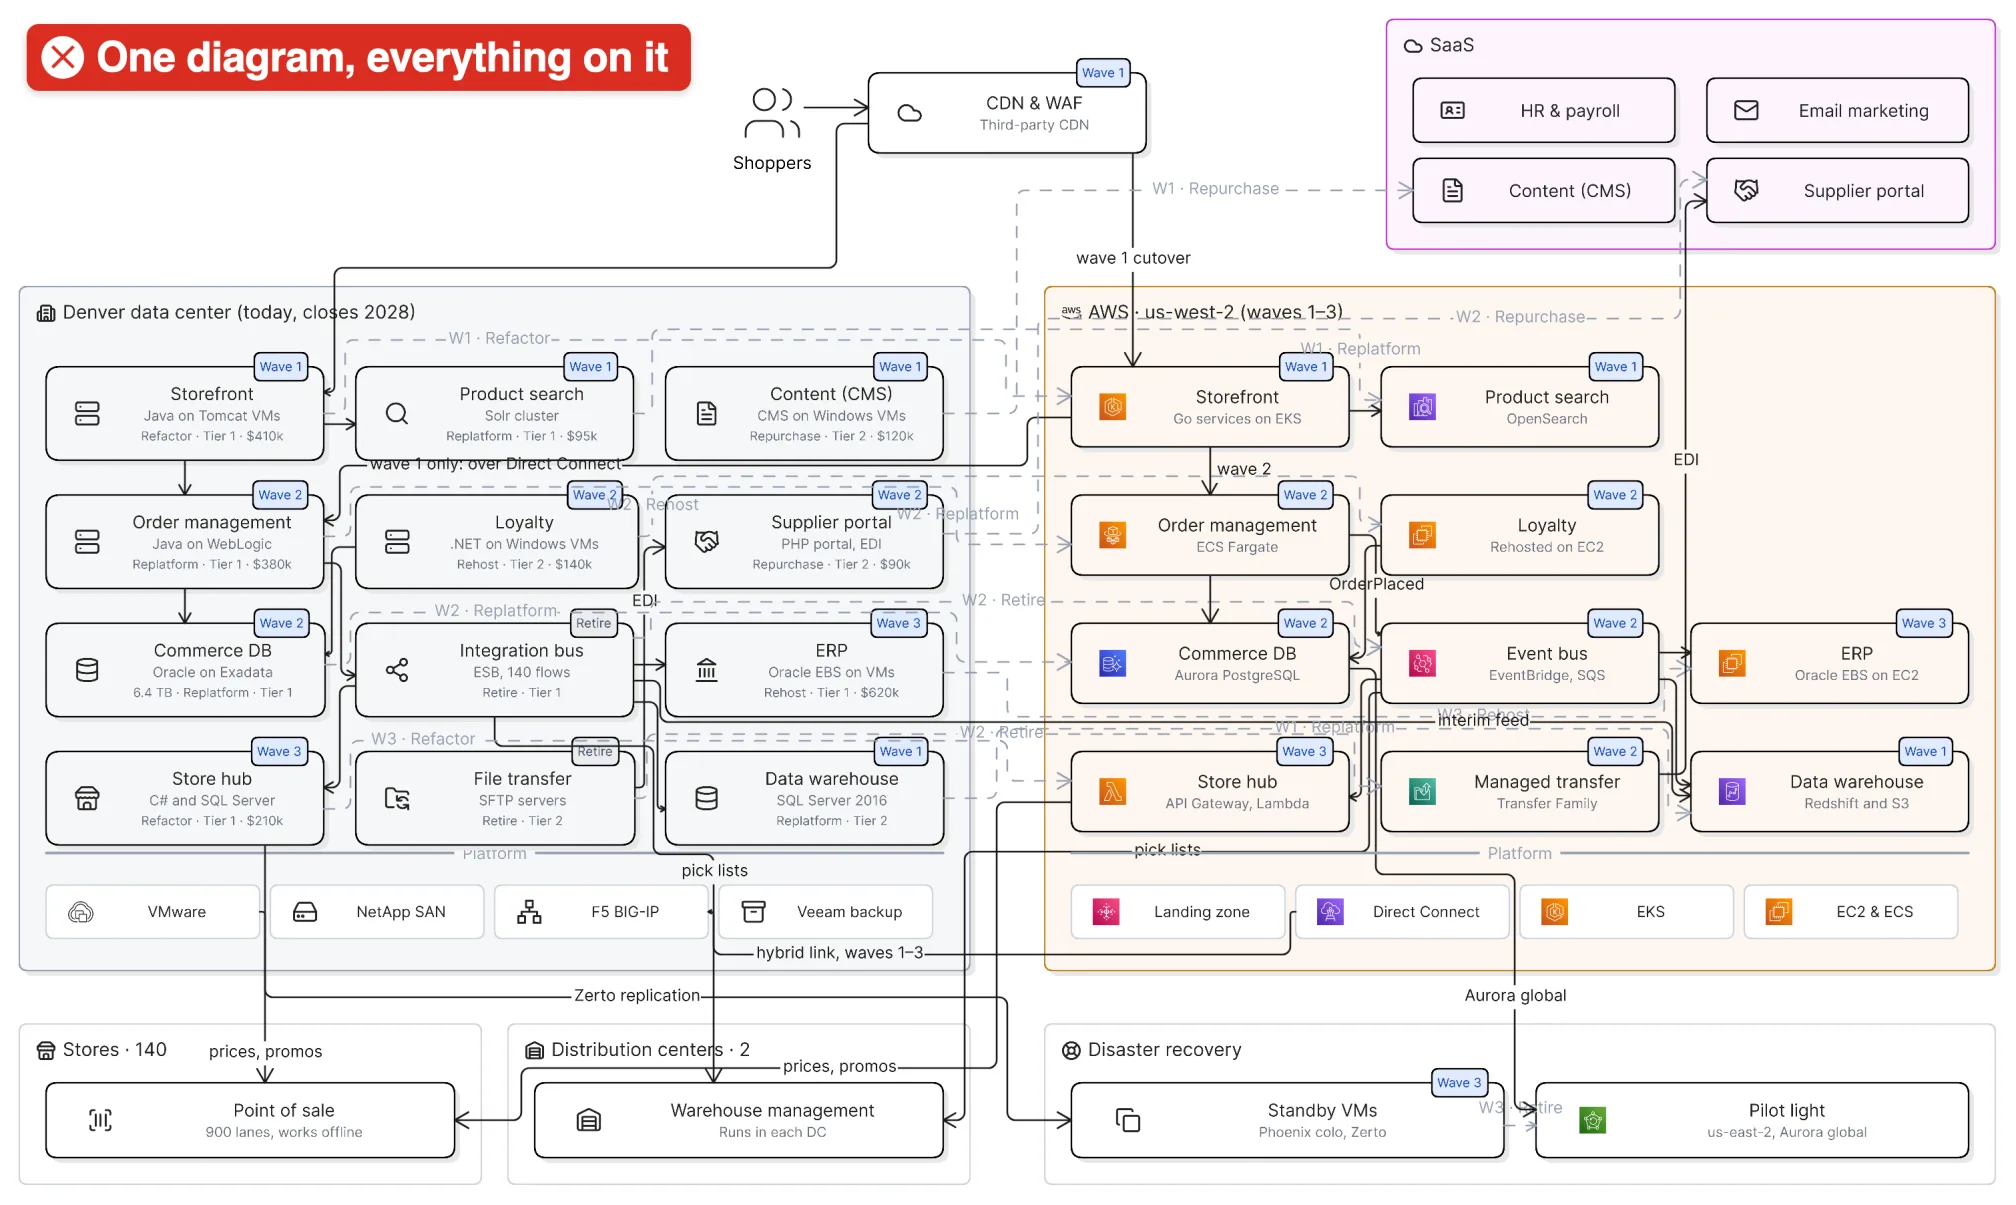
Everything on one canvas: accurate, and nearly impossible to follow.
Here’s the same move as a map.
What exists today, and what moves first? The map opens on the current state: every application in Denver and an empty AWS landing zone. Step to wave 1 and watch the storefront, product search and data warehouse slide into AWS while content moves to SaaS.
How does an order work mid-migration? Play the online order flow. Checkout now starts in AWS, then crosses Direct Connect back to order management in Denver. That’s the riskiest hop of wave 1.
Why is order management still in Denver? Click into it. It’s WebLogic services writing to a 6.4 TB Oracle database on Exadata, plus 140 integration-bus flows to the ERP, the warehouses and the stores. Those flows have to be rebuilt on EventBridge, so all of it moves together in wave 2.
Where’s the risk? Filter to Tier 1. Five Tier 1 systems are still in Denver after wave 1: order management, its database, the integration bus, the ERP and the store hub. Click the ERP to see its record: Oracle E-Business Suite, $620,000 a year to run, rehosted in wave 3.
Step through to the target state in the interactive map →
How maps answer each limit
Views lift the complexity ceiling. A map holds many views: perspectives, levels of depth, and states such as current and target. Readers start with the overview and go deeper only where they need to.
Models put data behind the picture. A map is built on a model of your systems: records with fields like owner, criticality and run cost. Readers can filter by any field and open the record behind a box, as with the Tier 1 filter above.
AI and your systems handle the upkeep. Eraser’s AI builds the map from AWS, Azure, GCP, ServiceNow, Terraform, Kubernetes and spreadsheets, and revises it when you ask. Connected data sources refresh its information as your systems change.
Flows carry the voiceover. Flows, animations and click-throughs put the explanation inside the map. Authors show how something works, and readers follow the story and open the details they care about. The explanation stays after the presenter leaves the room.
Get started
Maps are available today on every Eraser plan. On Free, maps count toward your three files, and each view the AI draws uses one AI credit. Building from connected data sources needs a paid plan.
Create your first map → or browse example maps.