Data lineage map of a hotel group
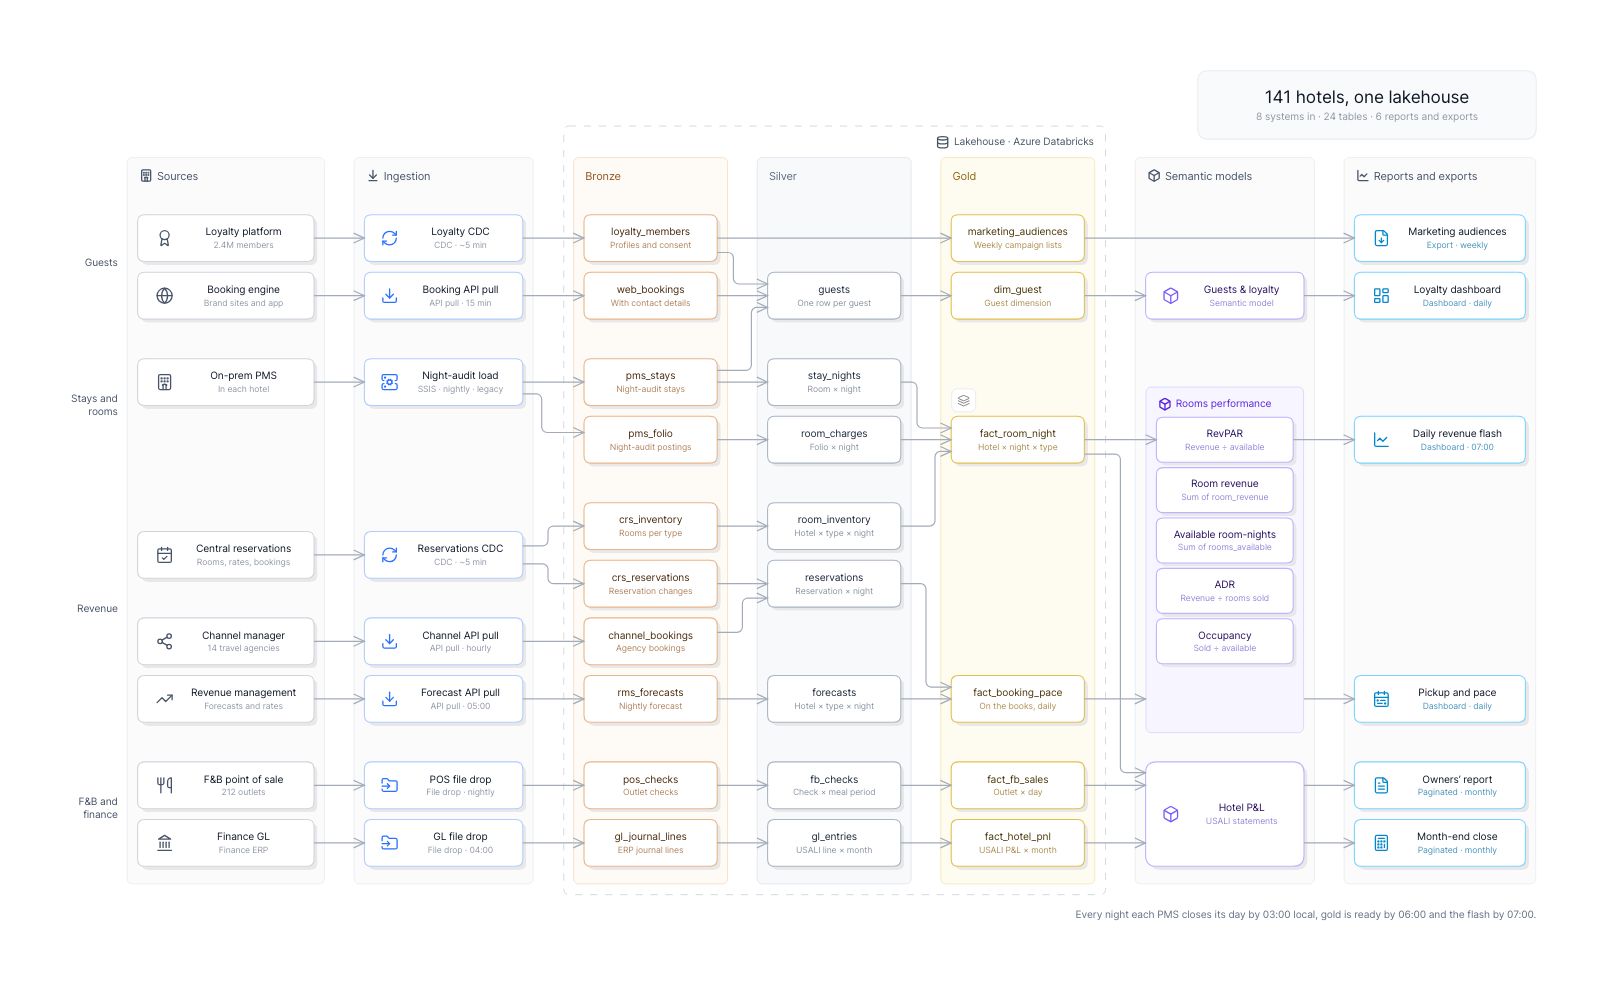
Lantern Bay Hotels’ lakehouse end to end: RevPAR traced back to two source columns, guest data by classification, and what retiring a legacy job breaks.
 Architecture
 Security
 Operations
 Data lineage map
 Medallion architecture
 Data classification
 Impact analysis
 Drill-down
 Hospitality
Views in this map
- 1 The platformEight hotel systems feed the lakehouse, bronze to gold, and six reports and exports.
- 2 Trace RevPARThe RevPAR tile, traced back hop by hop to two columns in two source systems.
- 3 Guest dataGuest data enters at three sources and is masked in silver. One gold table skips it.
- 4 Retire the night-audit jobWhat stops without the SSIS night-audit load, and the cloud PMS CDC that replaces it.
- 5 Inside fact_room_nightEight columns, owned by revenue analytics, fresh by 06:00 local. One test fails.
The platform ‹ › Trace RevPAR ‹ › Guest data ‹ › Retire the night-audit job ▸ Inside fact_room_night
Flows to play
- Where RevPAR comes fromFrom the RevPAR tile back to the two source columns it is built from, one hop at a time. In the Trace RevPAR view.
- A member’s emailOne Rewards member’s name and email, from sign-up to the reports, and the copy that skips the mask. In the Guest data view.
- If the load stopped tonightWhat goes stale, and in what order, if the SSIS night-audit load is switched off before the cloud PMS is live. In the Retire the night-audit job view.
The model behind it
68 records of 9 types. Every box on the map is one of them, so the filters and the record panel read the same data.
-
 Tables 24
-
 Source systems 9
-
 Ingestion jobs 9
-
 Columns 8
-
 Reports and exports 6
-
 Measures 5
-
 Semantic models 3
-
 2 more types 4
Filters
Layer and Classification and Domain: pick a value and everything else fades.
More map examples
View all map examples →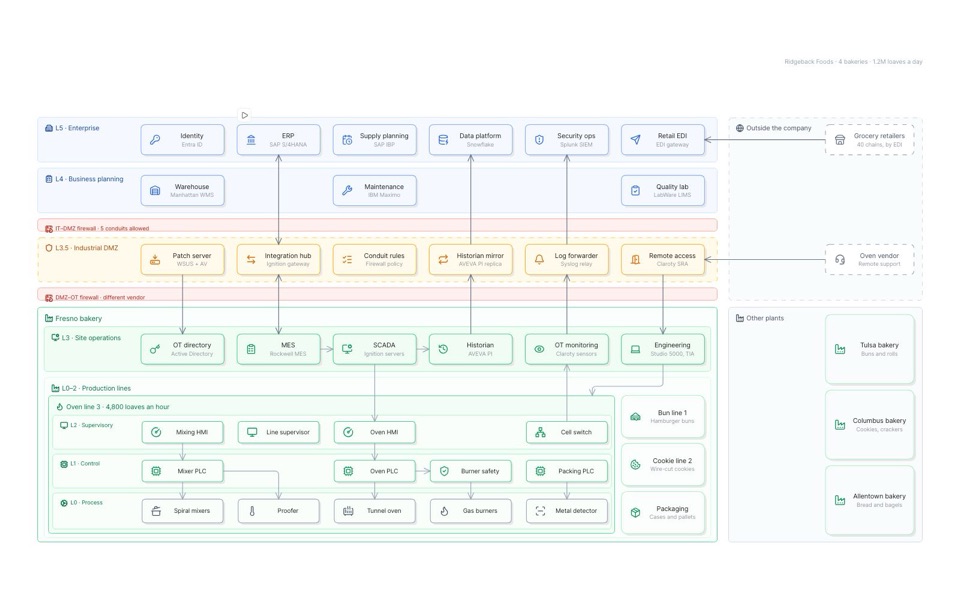
IT/OT architecture of a food plant
The Purdue model in one frame: corporate IT, a DMZ with five conduits, and a bakery down to its burners.
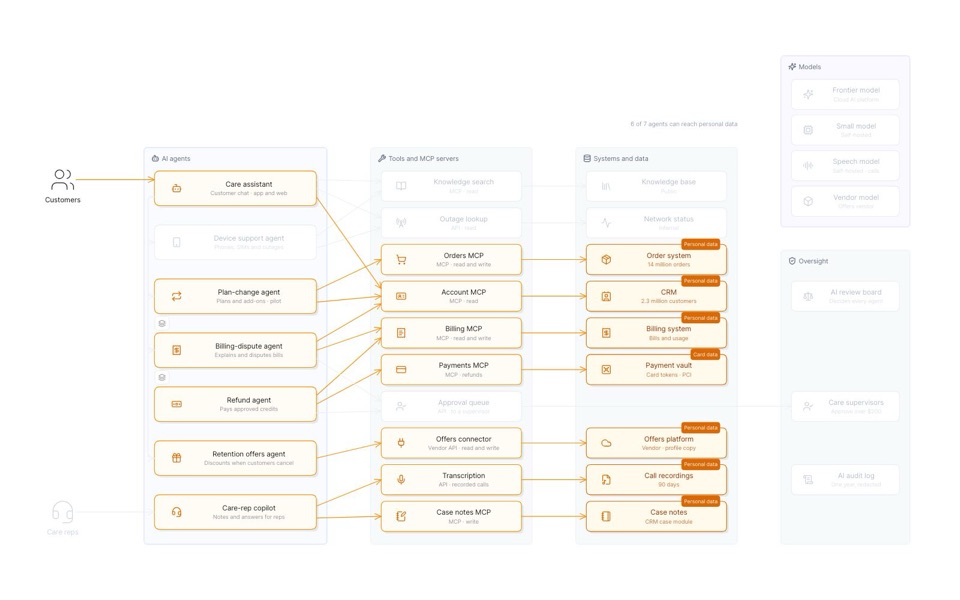
AI governance map of a mobile carrier
Seven care agents: the data each can reach, who approved them, and the guardrails on credits and refunds.
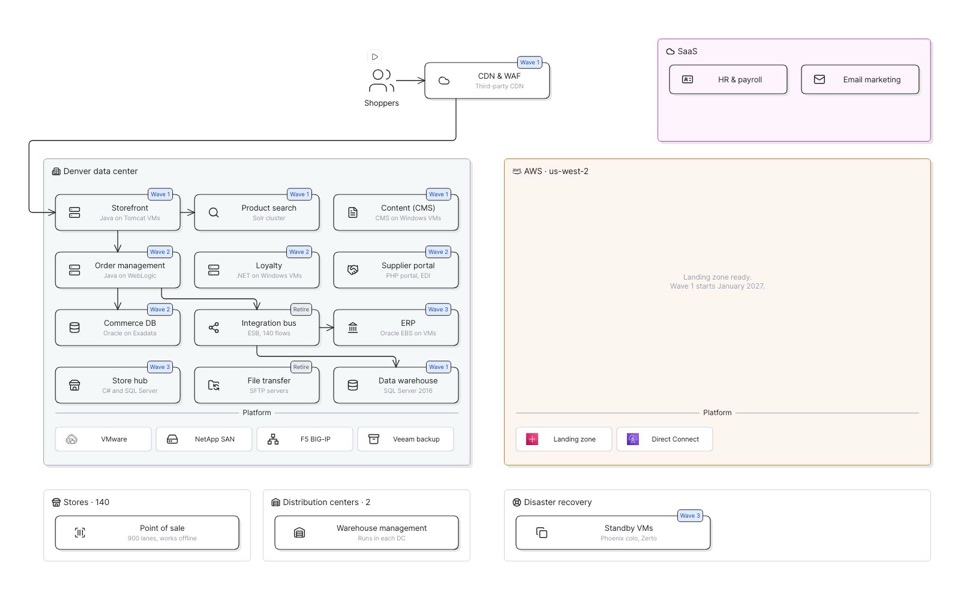
Data center to AWS migration
Three waves move an outdoor retailer’s apps from Denver into AWS. Step through and watch each one cross.
See you in the canvas
Unlock your team’s collaborative super powers.