Disaster recovery map of a regional airline
Petrel Air’s DR plan across two Azure regions: what replicates, a failover rehearsal minute by minute, the five gaps it found and how they were fixed.
 Operations
 Cloud
 Azure
 RTO and RPO
 Failover rehearsal
 Business continuity
 Aviation
Views in this map
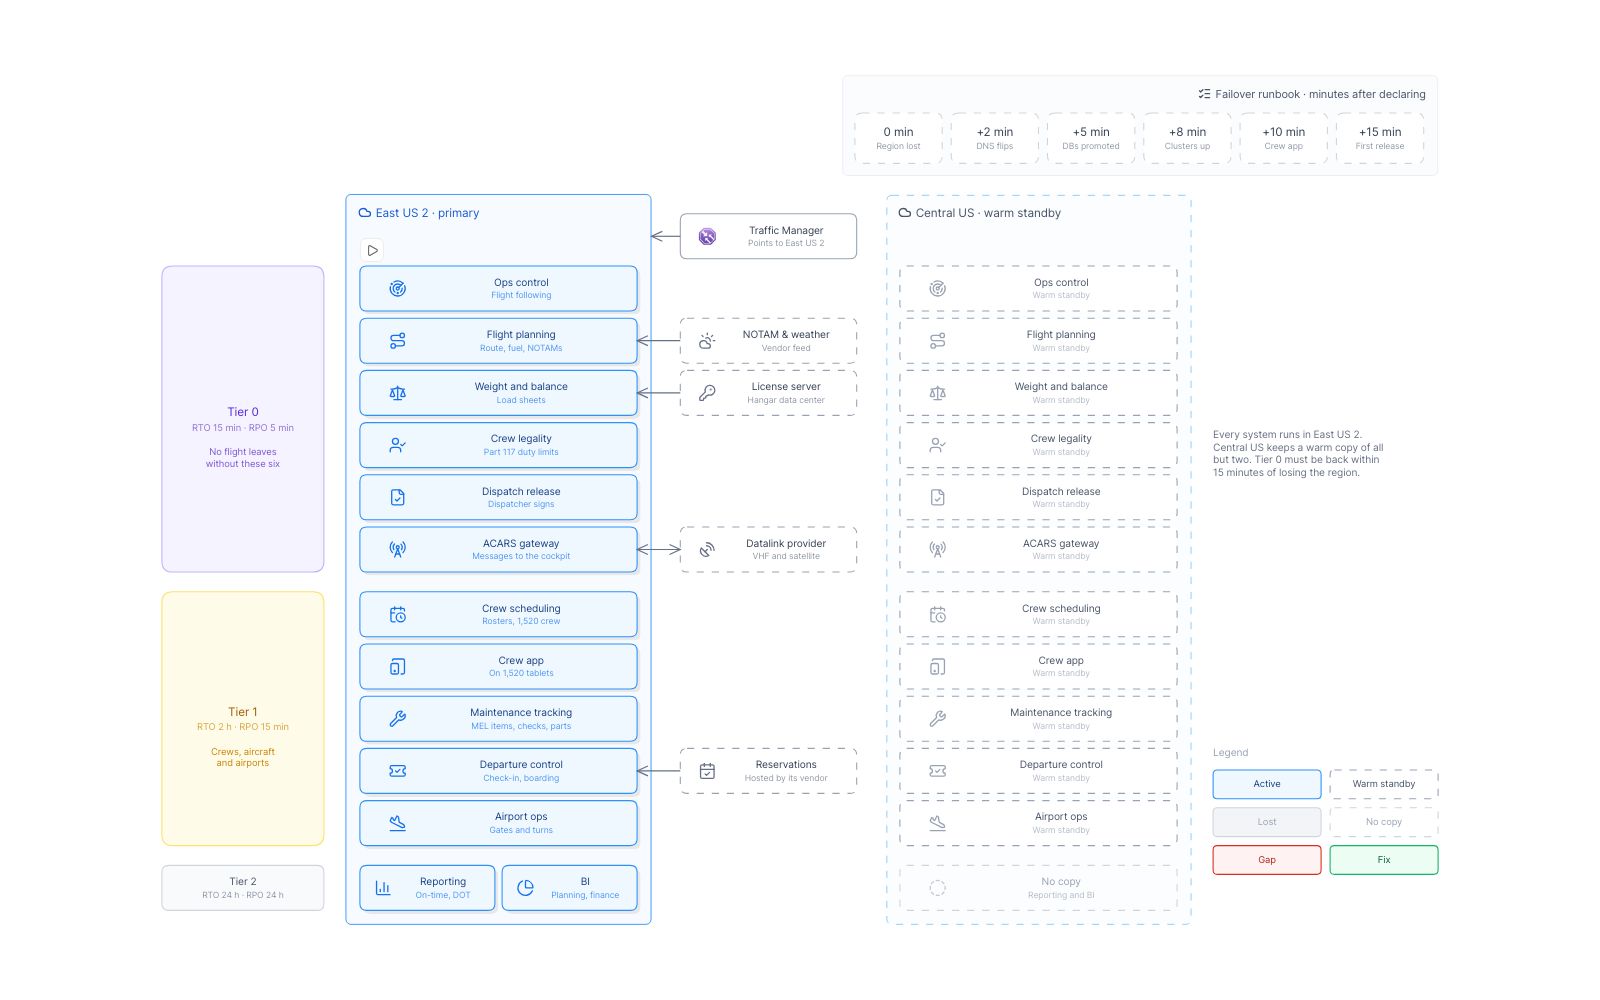
- 1 Normal runningEast US 2 runs every system, Central US a warm copy. Tier 0 must be back in 15 min.
- 2 What replicatesHow each copy gets its data: tier 0 risks 5 minutes. Reporting and BI have no copy.
- 3 Failover rehearsal13 September, 06:00: East US 2 is lost. The first release comes at 06:22, 7 min late.
- 4 What it foundFive gaps the rehearsal found, each pinned beside the copy it stopped.
- 5 After the fixesEvery gap closed. On 18 October the first flight is released in 11 minutes.
Normal running ‹ › What replicates ‹ › Failover rehearsal ‹ › What it found ‹ › After the fixes
Flows to play
- Releasing a flightFlight 1102, Raleigh–Durham to Boston at 06:50: every tier 0 system has a part in its release. In the Normal running view.
- Losing the primary regionThe rehearsal of 13 September, from declaring East US 2 lost to the first flight released from Central US. In the Failover rehearsal view.
- The second rehearsalThe same rehearsal on 18 October, with the five fixes in place. In the After the fixes view.
The model behind it
63 records of 8 types. Every box on the map is one of them, so the filters and the record panel read the same data.
-
 Systems 26
-
 Replications 12
-
 Runbook steps 6
-
 Gaps 5
-
 Fixes 5
-
 Regions and sites 4
-
 Vendor services 3
-
 Rehearsals 2
Filters
Tier and Region or site and Owner: pick a value and everything else fades.
More map examples
View all map examples →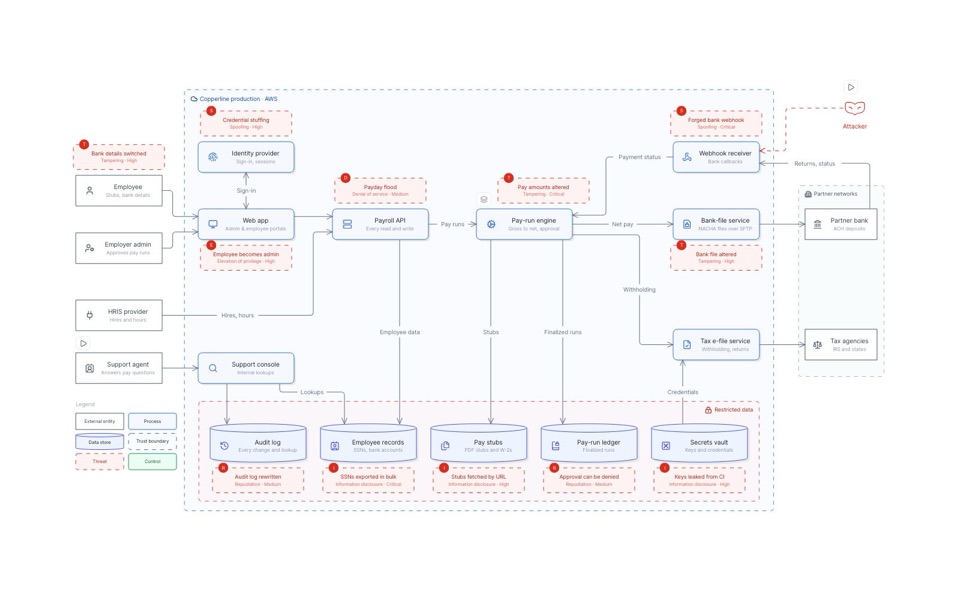
Threat model of a payroll SaaS
A payroll SaaS’s data flows, twelve STRIDE threats pinned where they strike, and the control that closes each.
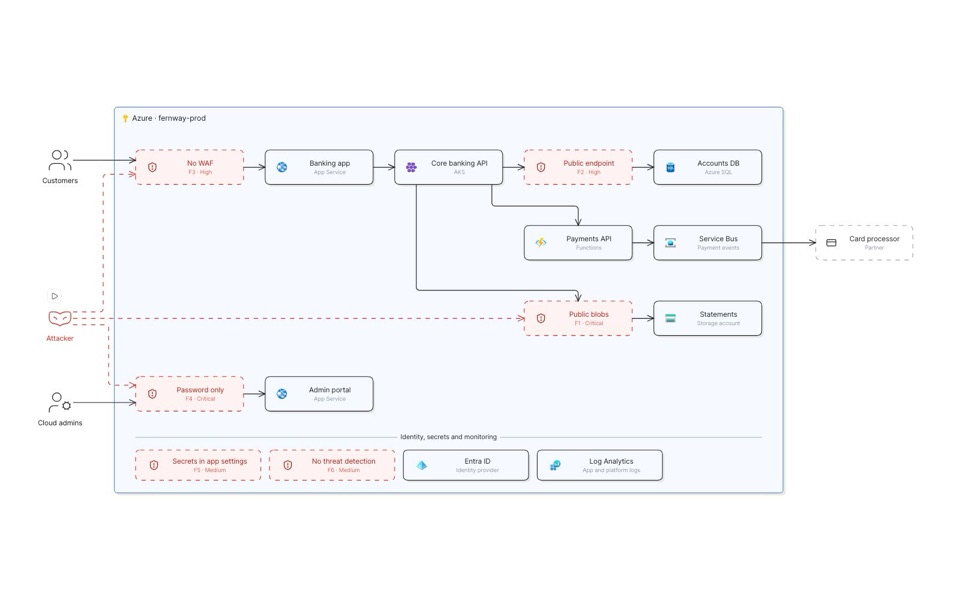
Azure security review and remediation
Six findings on a digital bank’s Azure estate, and the controls that close them in place.
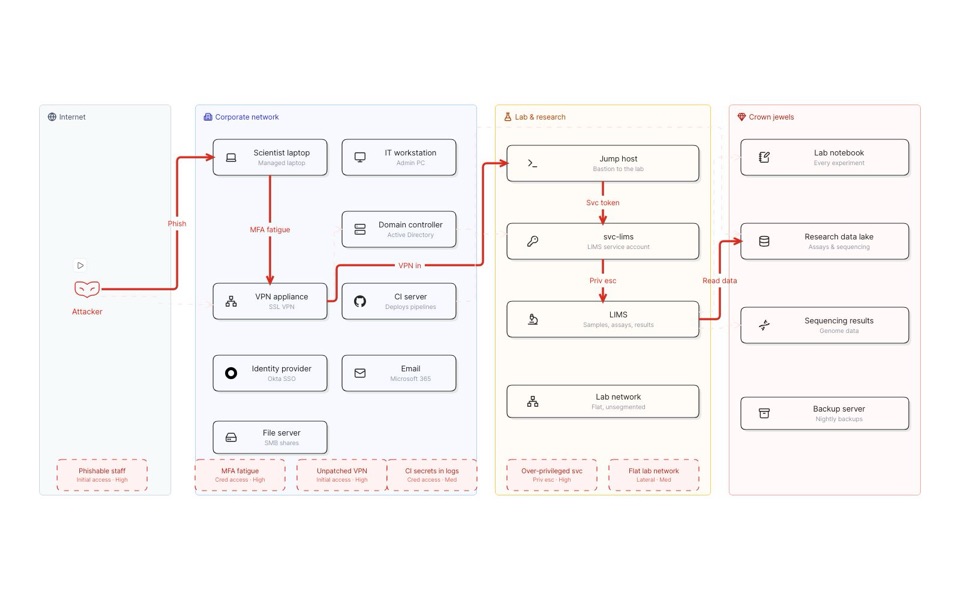
Attack paths into a research biotech
The paths into a research biotech’s crown jewels, the five-hop chain to cut first, and the fixes that close it.
See you in the canvas
Unlock your team’s collaborative super powers.