Survival odds on the Titanic
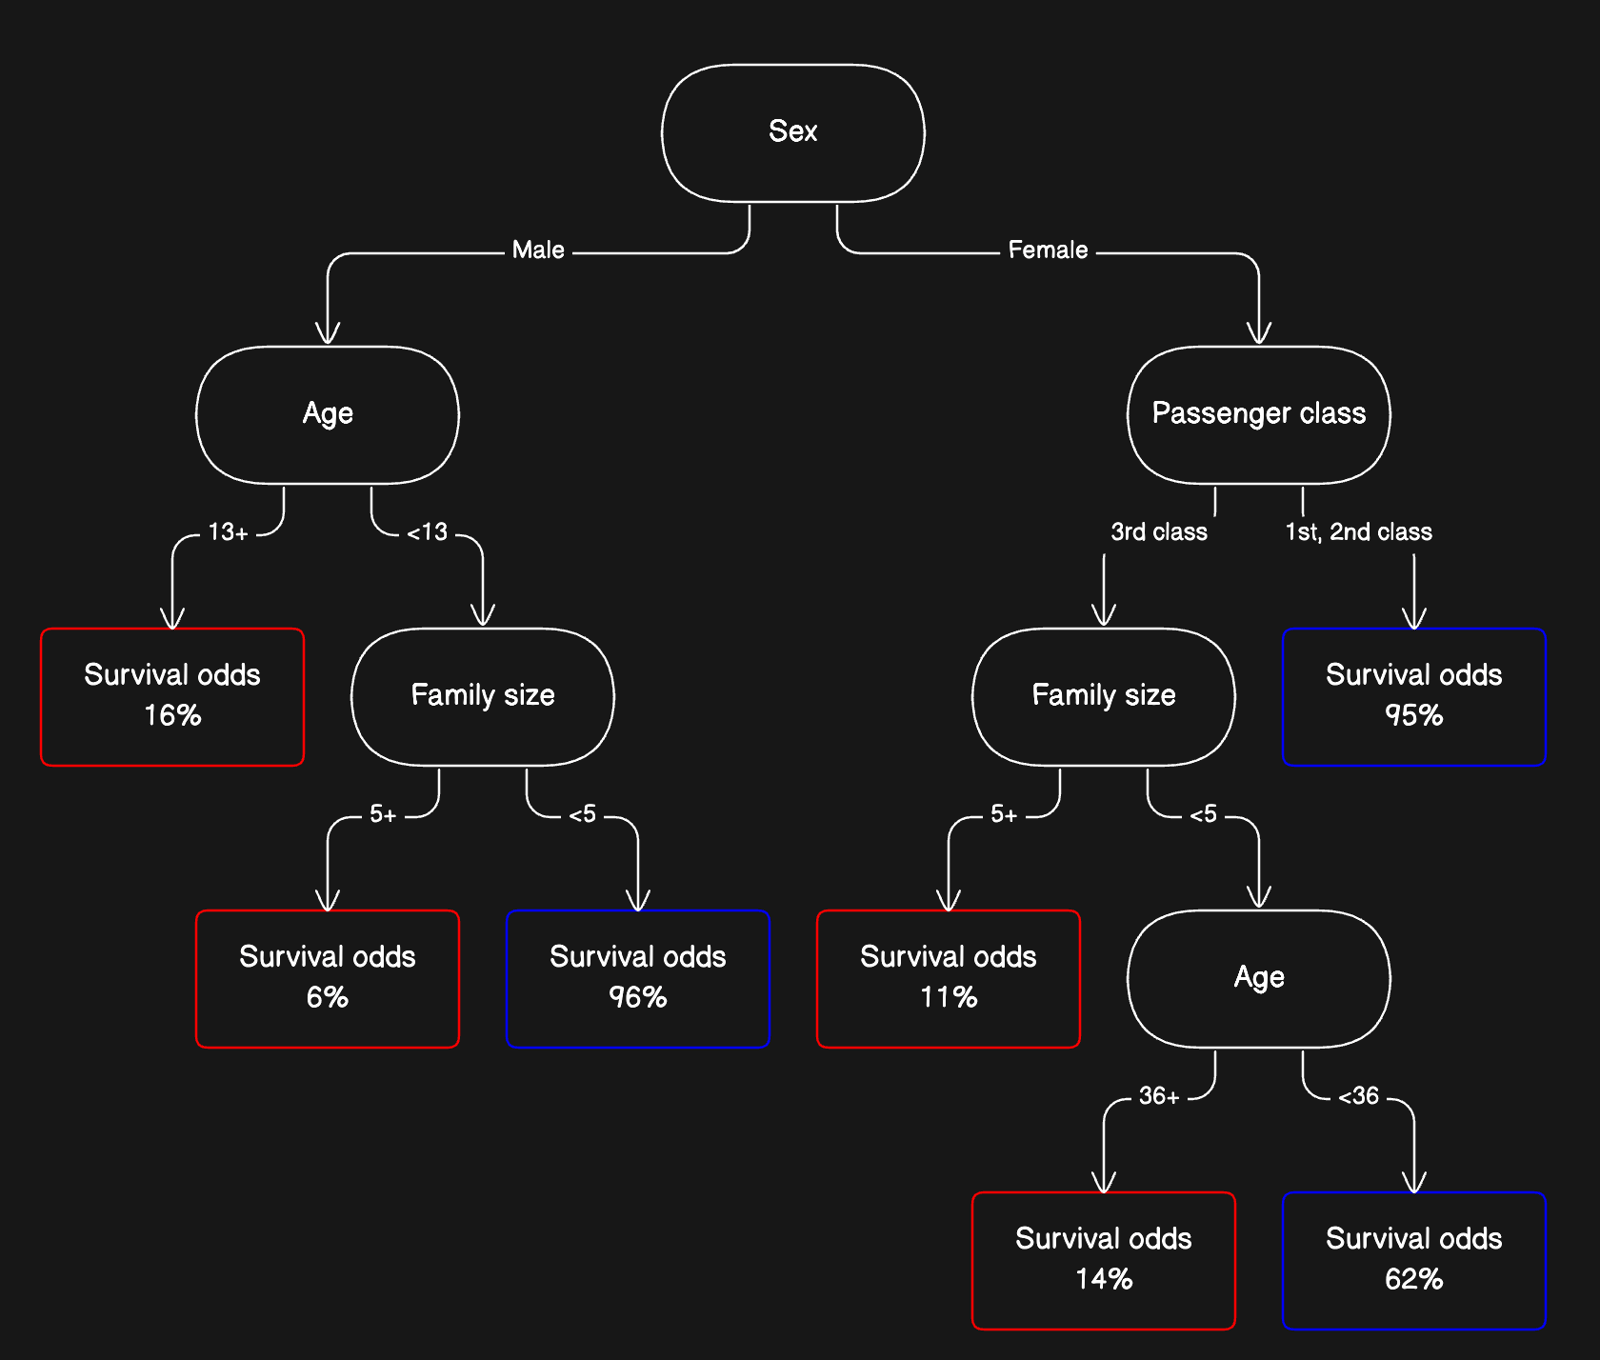
Visualize complex decision-making factors with this survival odds analysis diagram example.
 Decision Trees
  Flow Chart
 About this example
Historical data analysis of the Titanic offers insights into survival patterns. Here’s a detailed breakdown:
- Demographic Influence: Demonstrates how age and sex affect survival odds.
- Socioeconomic Impact: Reflects on how passenger class influenced chances of survival.
- Family Dynamics: Examines the role of family size in survival rates.
- Outcome Visualization: Presents survival odds at different decision tree nodes, providing clear outcomes.
When to use
- Historical Data Analysis: For software engineers analyzing patterns in historical data sets.
- Machine Learning Classification: When developing classification models that predict categorical outcomes based on several inputs.
- Educational Tools: To illustrate the concept of decision trees in educational materials for data science and machine learning courses.
How to use
- Start editing: Duplicate the example file and double-click on the diagram.
- Customize diagram: Add/modify nodes, groups, and relationships using a diagram-as-code syntax, adapting it to fit the specific scenario being modeled.
- Customize layout: Drag elements on the diagram directly on the canvas to manipulate the layout.
- Collect feedback: Share the file with collaborators and encourage them to use the comments feature for feedback.
Related Examples
View all examples →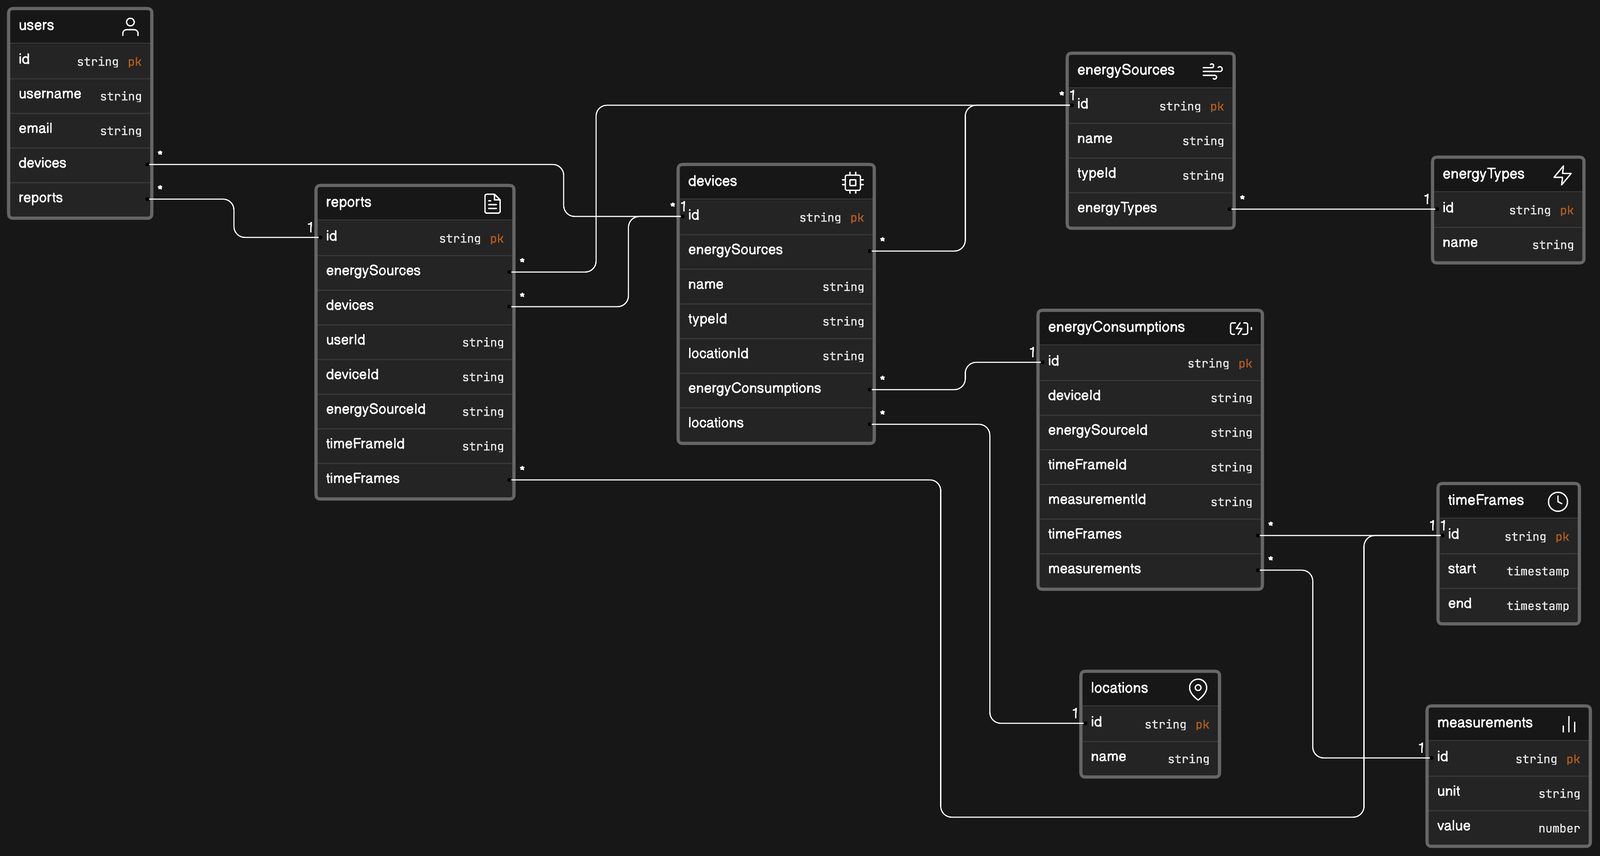
Energy tracking application data model
Optimize sustainability efforts with the energy tracking application data model example.
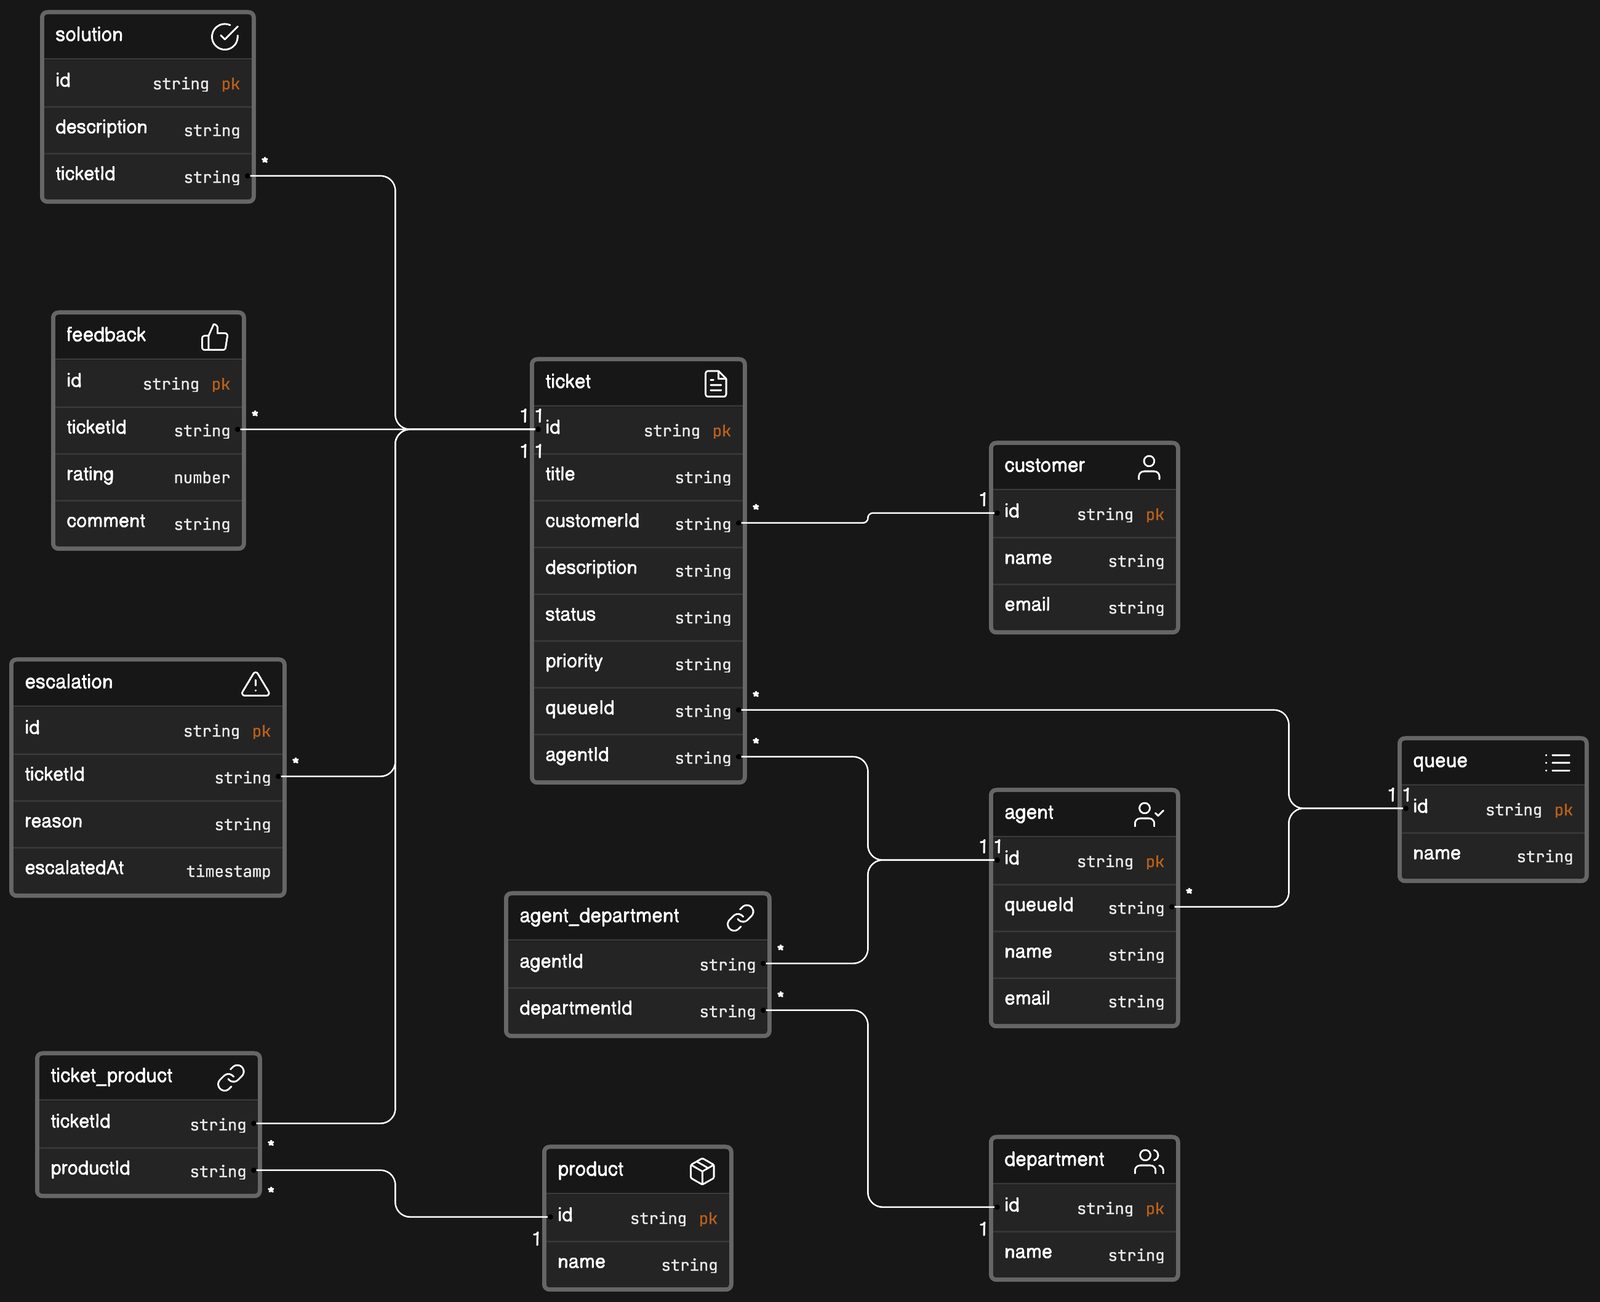
IT help desk software data model
Enhance your IT support framework with the IT help desk software data model example.
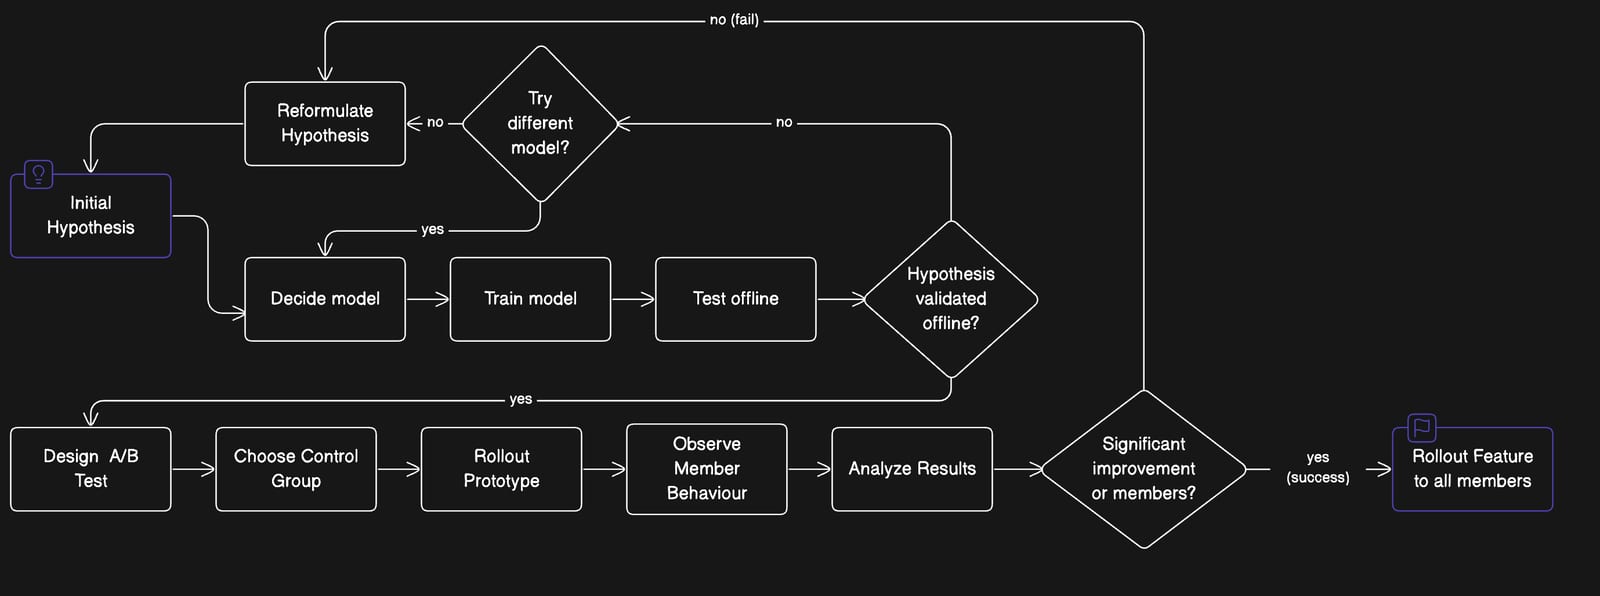
Netflix model testing process
Refine your feature development strategy with the Netflix Model Testing Process example.
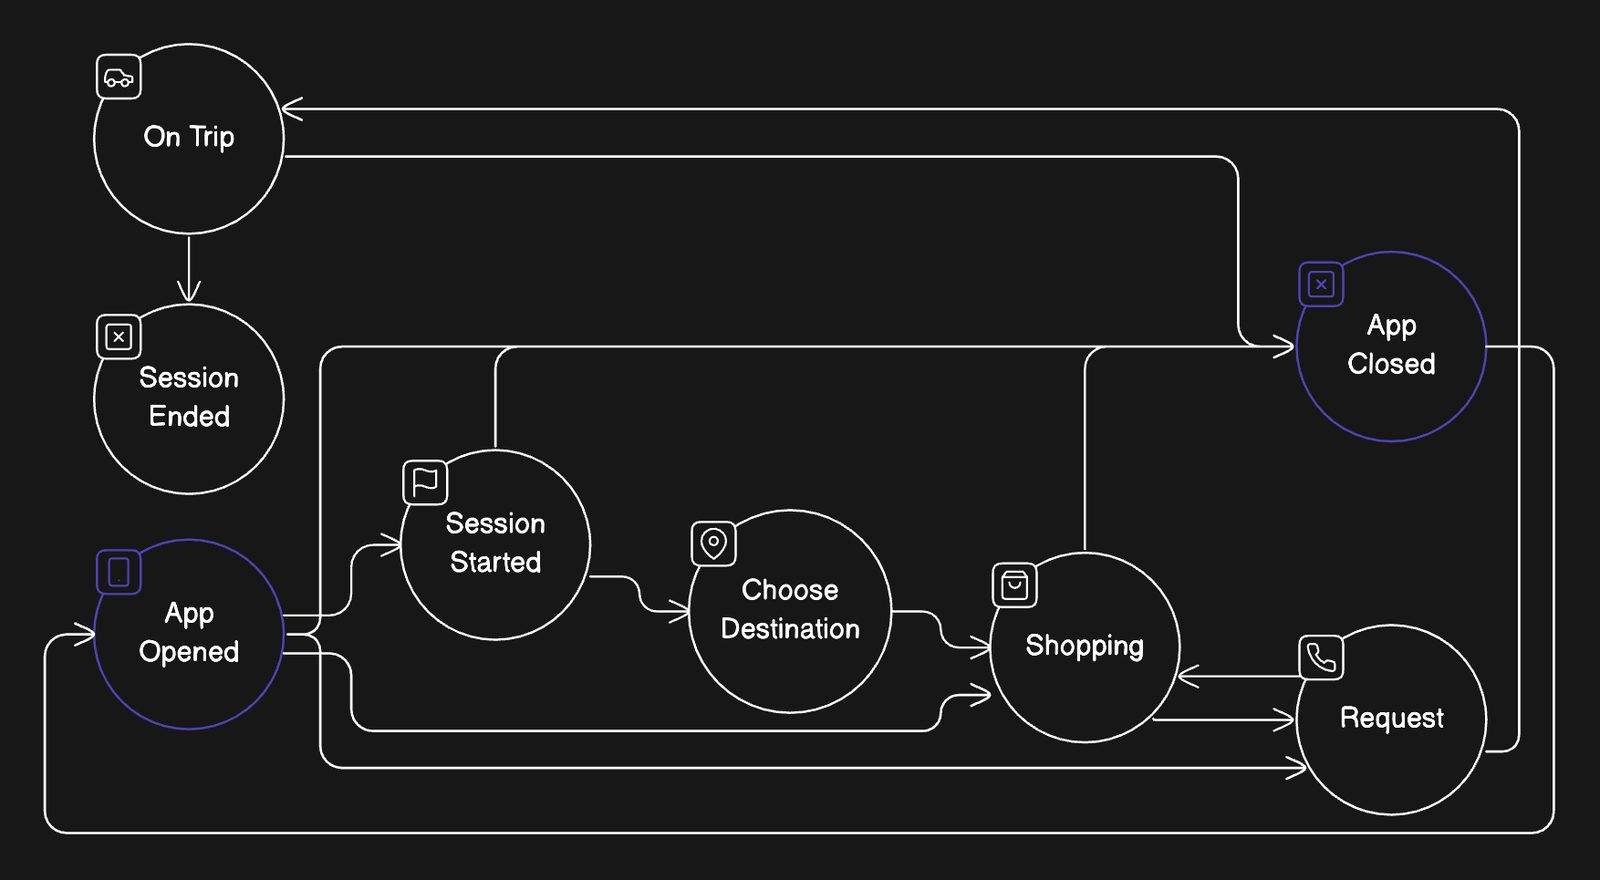
Uber rider session state machine
Visualize the user interaction flow within a ride-hailing application with this user journey example.
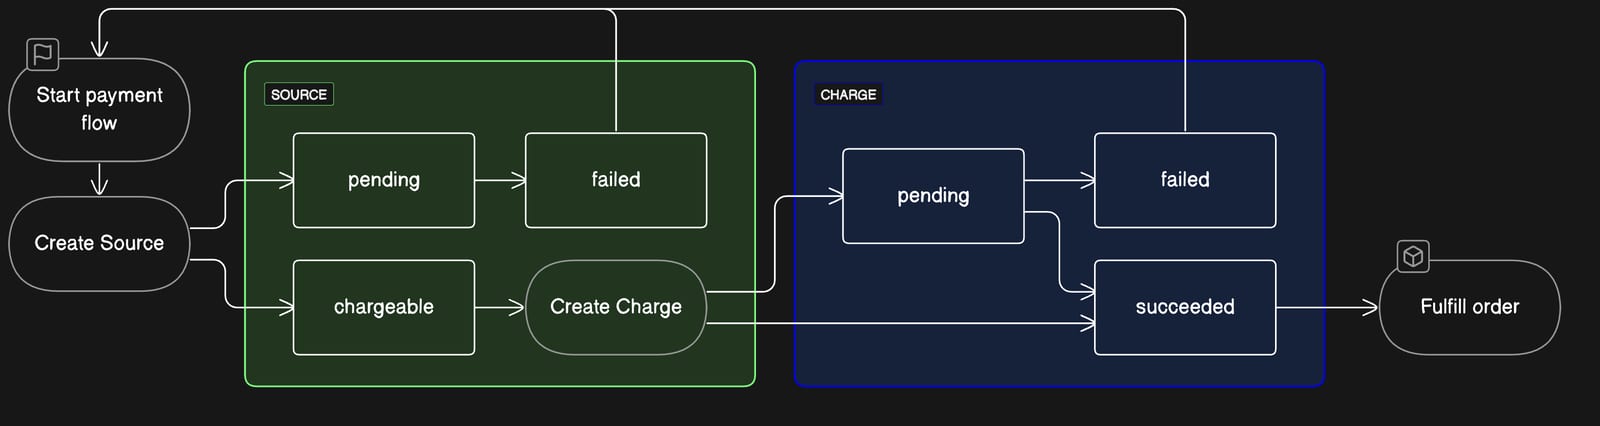
Stripe payment state machine
Streamline your e-commerce transactions with the Stripe Payment State Machine example.
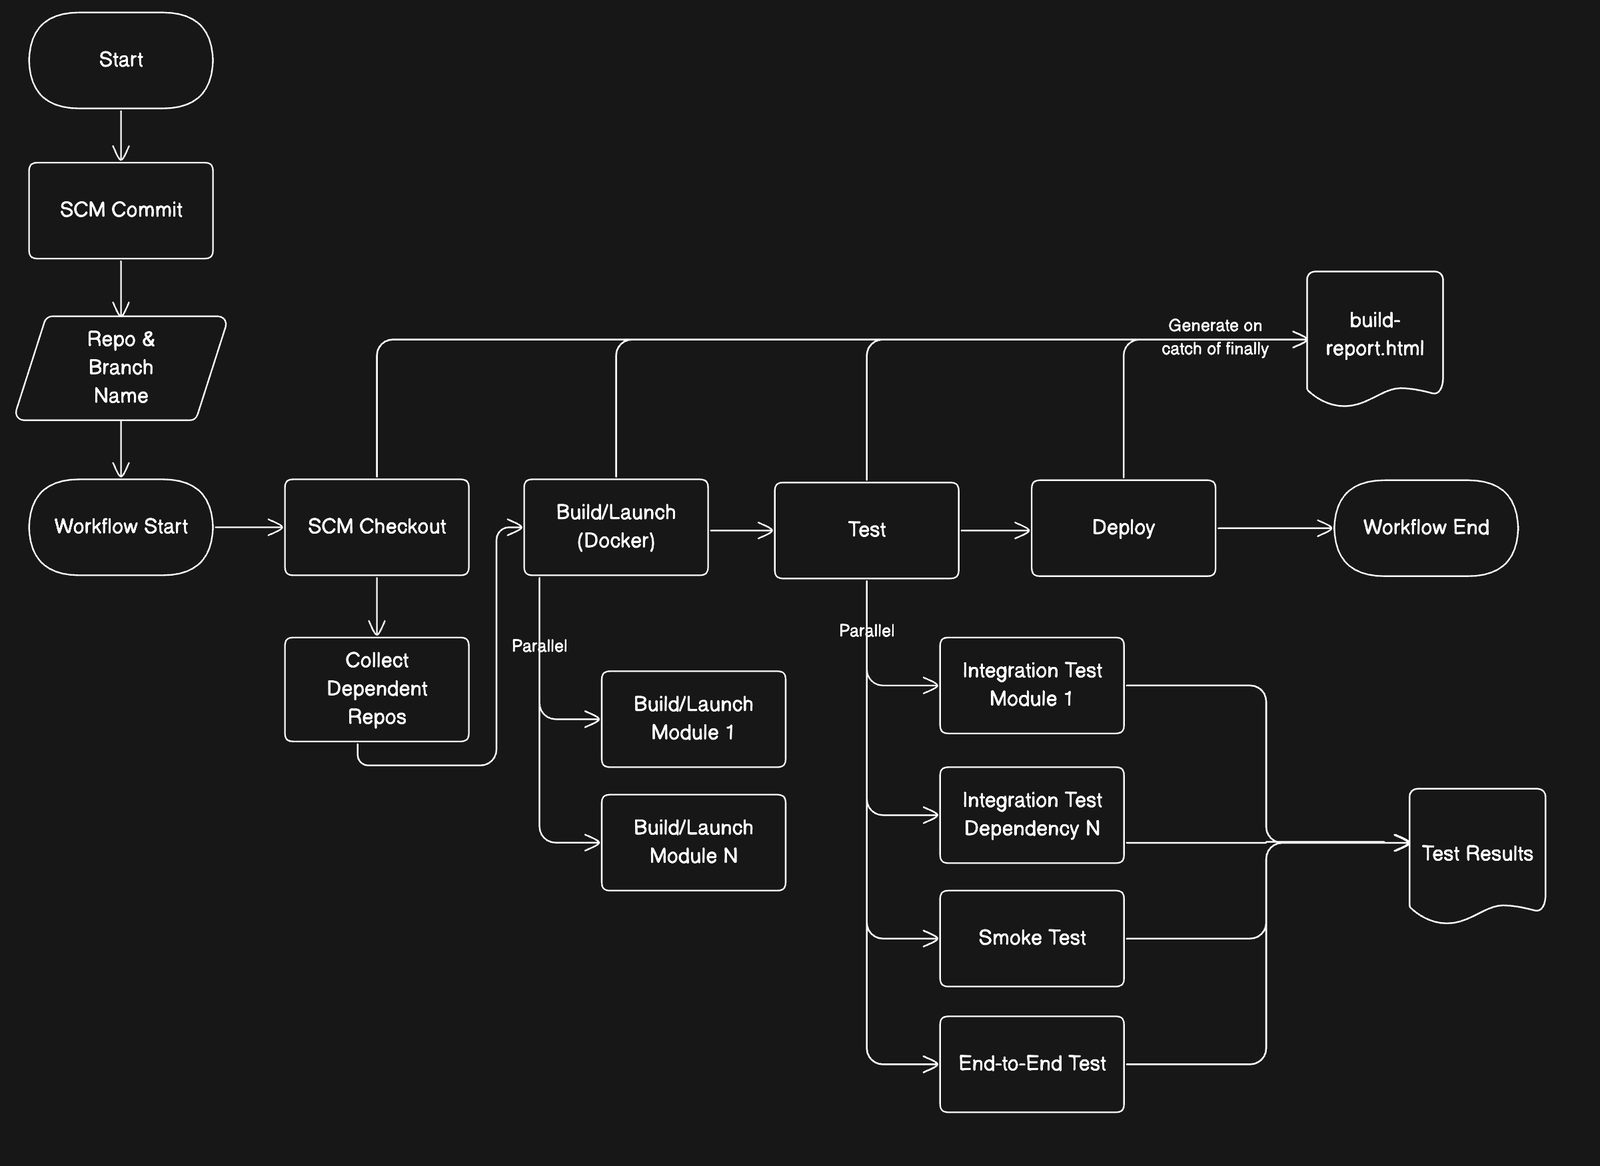
Jenkins CI/CD
Visualize and optimize your software delivery process with the Jenkins CI/CD Pipeline Workflow example.
See you in the canvas
Unlock your team’s collaborative super powers.