Network weathermap of a fiber ISP
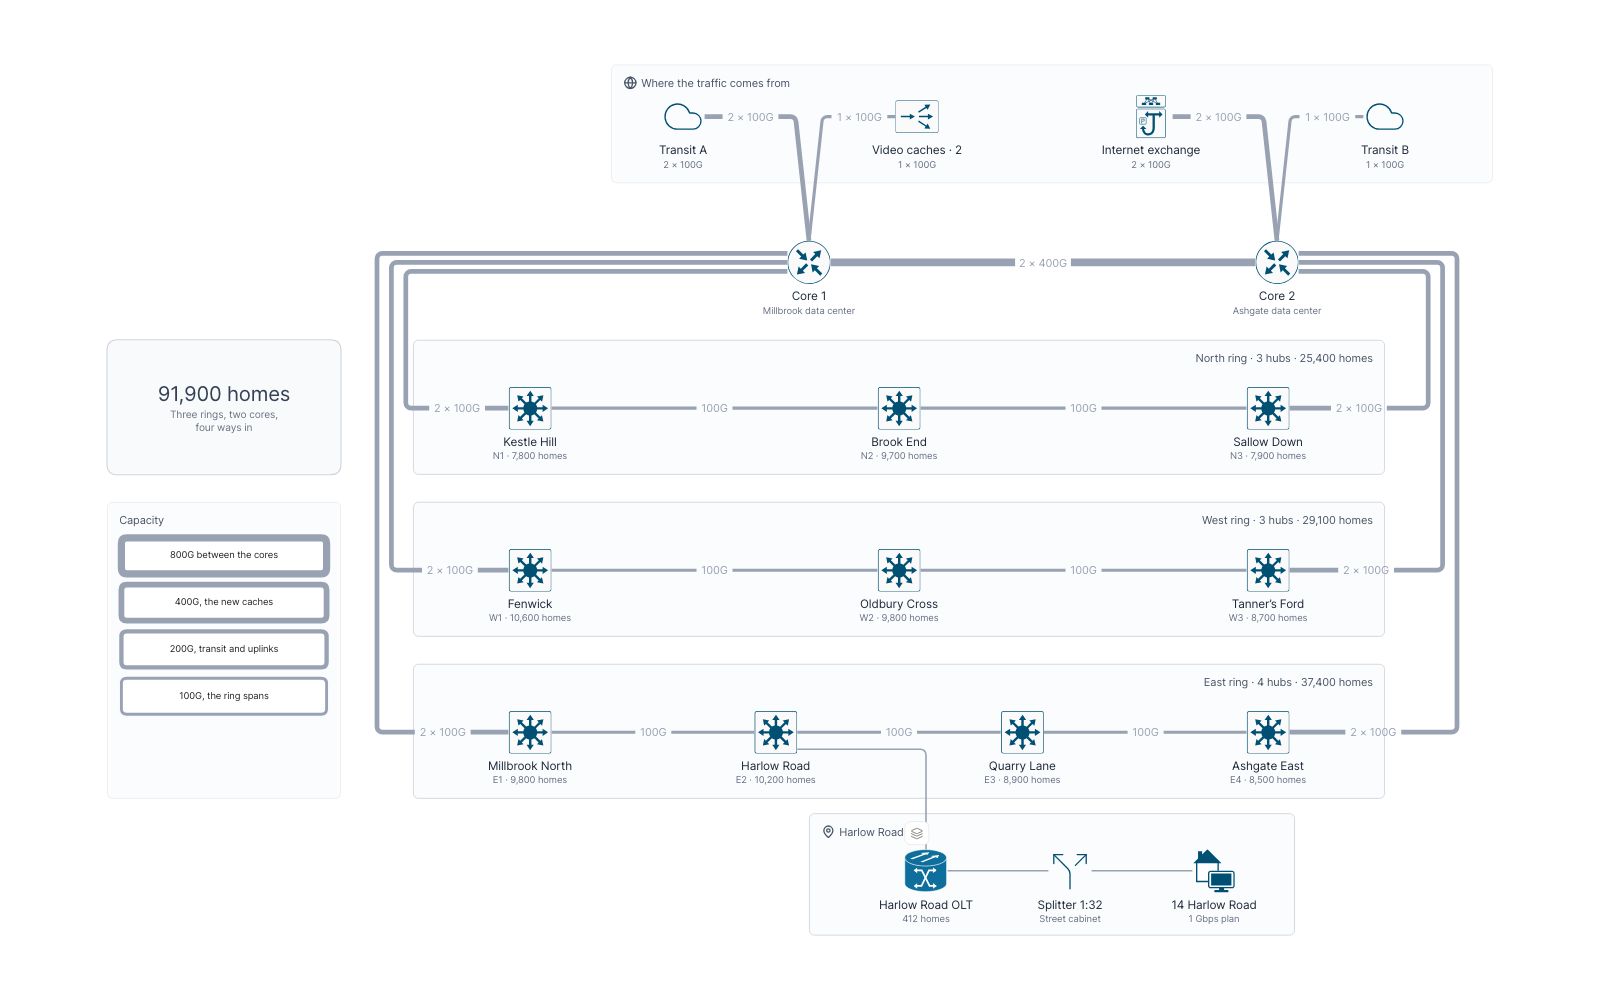
Brindlewood Fiber’s backbone as a weathermap: transit, peering and video caches, two cores, three rings of hubs, and every link’s load at the 9 p.m. peak.
 Network
 Operations
 Cisco
 Capacity planning
 Drill-down
 Telecom
Views in this map
- 1 The networkFour ways in, two cores and three rings of hubs serving 91,900 homes, by capacity.
- 2 9 p.m. peak470 Gbps at the evening peak. Transit A runs at 92% and the old video cache at 90%.
- 3 With more cachesEight cache servers send films from inside the network. Transit A falls to 26%.
- 4 East ring cutA digger cuts E1–E2 at 9:14 p.m.: Harlow Road is fed the long way, at 97%.
- 5 Harlow RoadOne fiber, one splitter, 32 homes: a film’s last mile from the hub to a TV.
The network ‹ › 9 p.m. peak ‹ › With more caches ‹ › East ring cut ▸ Harlow Road
Flows to play
- A film on Friday nightA 4K film for 14 Harlow Road at the peak, over Transit A while the caches are full. In the 9 p.m. peak view.
- A film on Friday nightThe same film once eight cache servers are in: it never touches transit. In the With more caches view.
- The long way roundHow Harlow Road stays online when its span to E1 is cut. In the East ring cut view.
- The last mileA film from the Harlow Road hub to the living-room TV. In the Harlow Road view.
The model behind it
51 records of 10 types. Every box on the map is one of them, so the filters and the record panel read the same data.
-
 Links 21
-
 Hubs 10
-
 Ways in 4
-
 Services 3
-
 Home devices 3
-
 Core routers 2
- Last mile 2
-
 3 more types 6
Filters
Ring and Role: pick a value and everything else fades.
More map examples
View all map examples →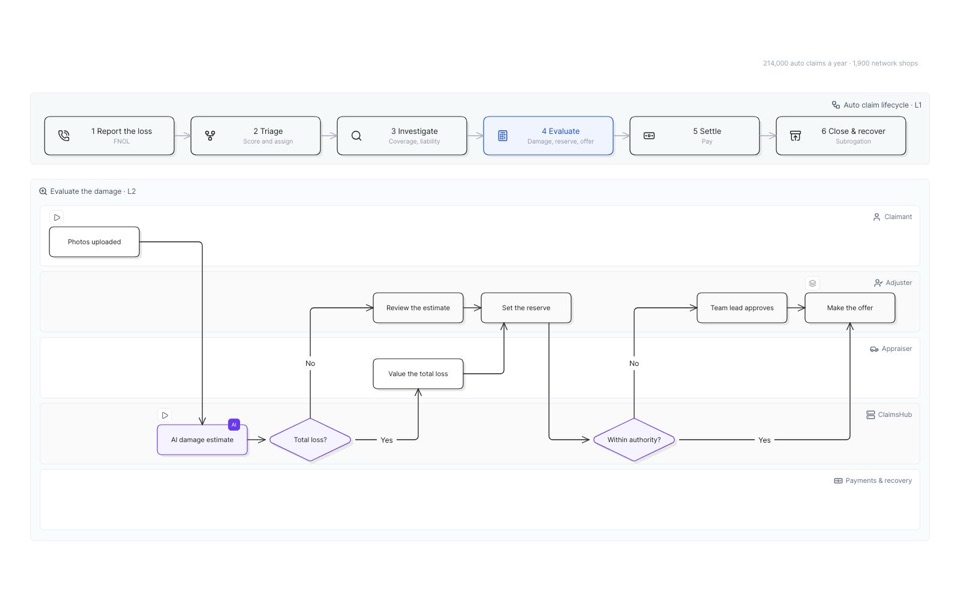
Auto insurance claim process
Six stages from first report to recovery, then down into evaluation and the offer, lane by lane.
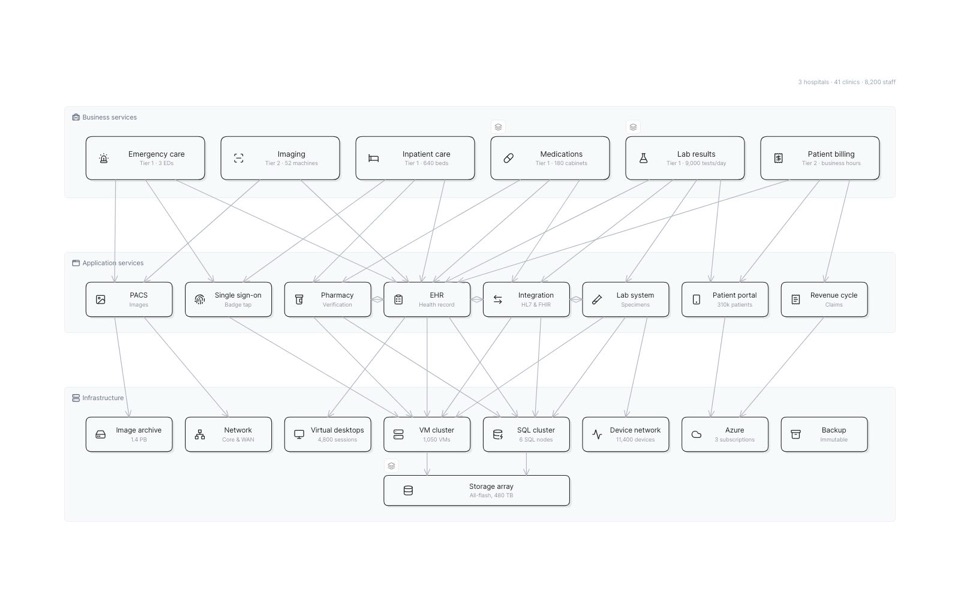
Hospital IT service map
Clinical services down to the apps and infrastructure under them, and what fails when the storage array does.
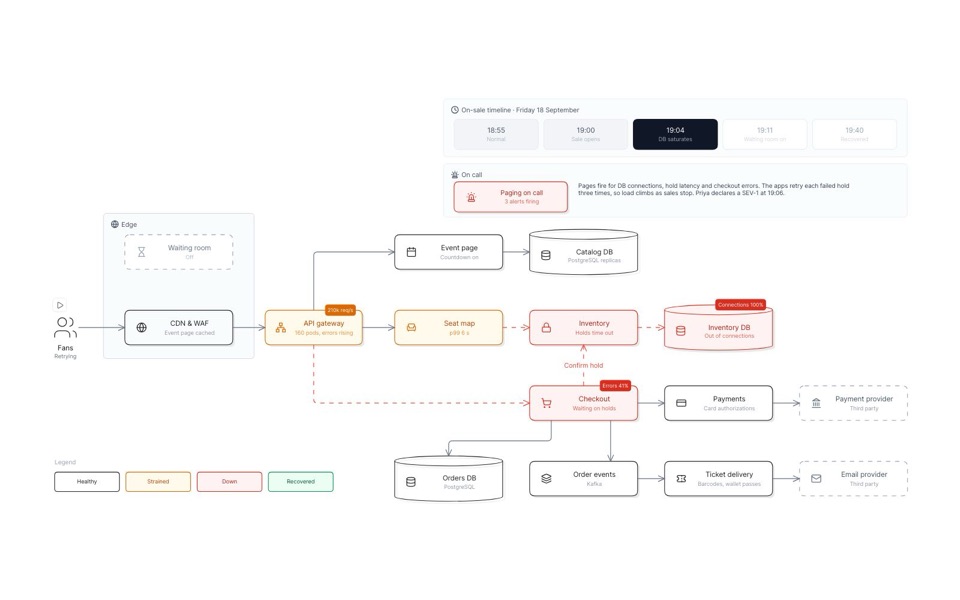
Outage replay of a stadium-tour on-sale
A big on-sale minute by minute: the seat database saturates, a waiting room goes on, and sales recover.
See you in the canvas
Unlock your team’s collaborative super powers.