Web app monitoring on Azure
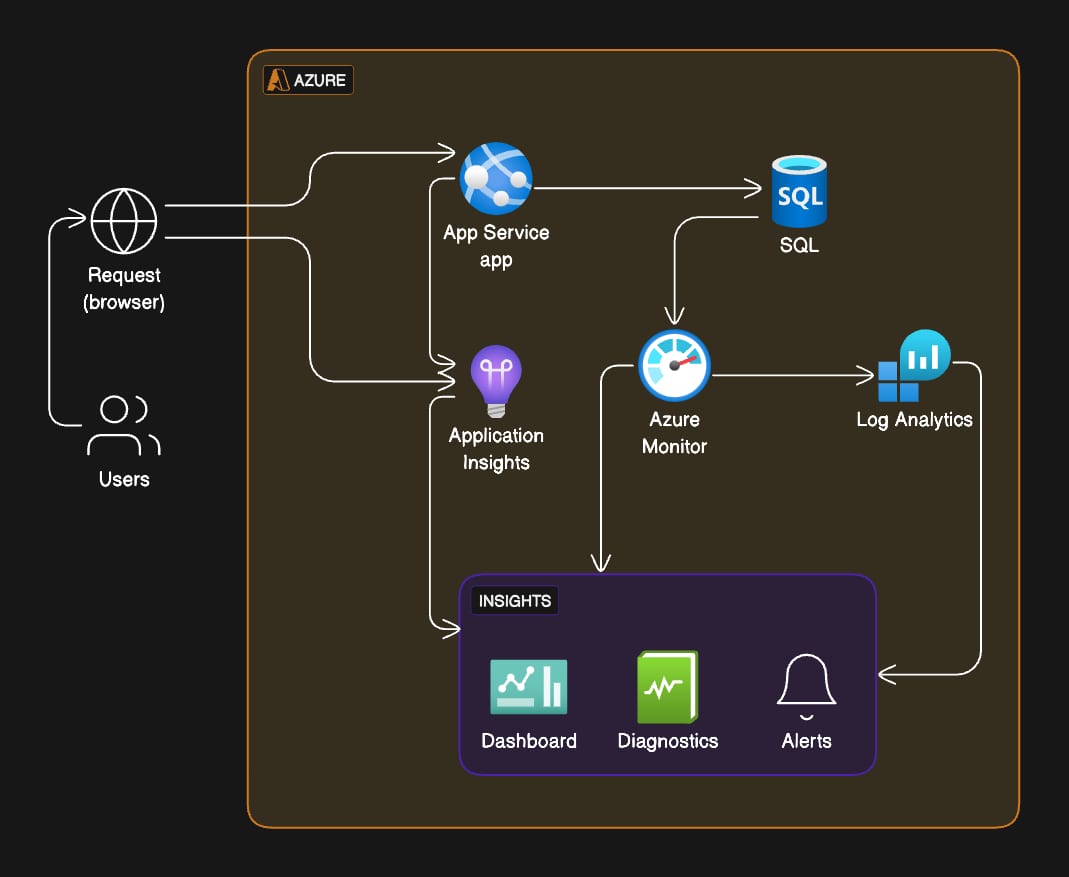
Elevate your web app’s performance and reliability by visualizing it with the Web App Monitoring on Azure example.
 Architecture Diagrams
  Cloud Architecture Diagram
  Azure
Azure About this example
Monitoring is a critical aspect of web app management. This example demonstrates Azure’s monitoring capabilities:
- Integrated Monitoring: Showcases the integration between Azure App Services, SQL databases, and monitoring tools.
- Application Insights: Depicts how Application Insights offers deep performance insights and diagnostics.
- Azure Monitor and Log Analytics: Illustrates the use of Azure Monitor alongside Log Analytics for comprehensive data analysis.
- Alerts and Dashboards: Highlights the setup of custom alerts and visualization dashboards for real-time monitoring.
When to use
- Performance Optimization: When needing to monitor and optimize the performance of a web application hosted on Azure.
- Troubleshooting: To swiftly identify and diagnose issues in a web application using Azure’s diagnostic tools.
- Proactive Monitoring: To set up dashboards and alerts for proactive monitoring of web app health and usage patterns.
How to use
- Start editing: Duplicate the example file and open the diagram to begin customizing.
- Customize diagram: Update the nodes, services, and connections to reflect the specifics of your web app’s architecture.
- Customize layout: Arrange the elements to match your monitoring flow and create a visual that aids in understanding your system.
- Collect feedback: Share the edited diagram with your team to review and suggest further enhancements for your monitoring setup.
Related Examples
View all examples →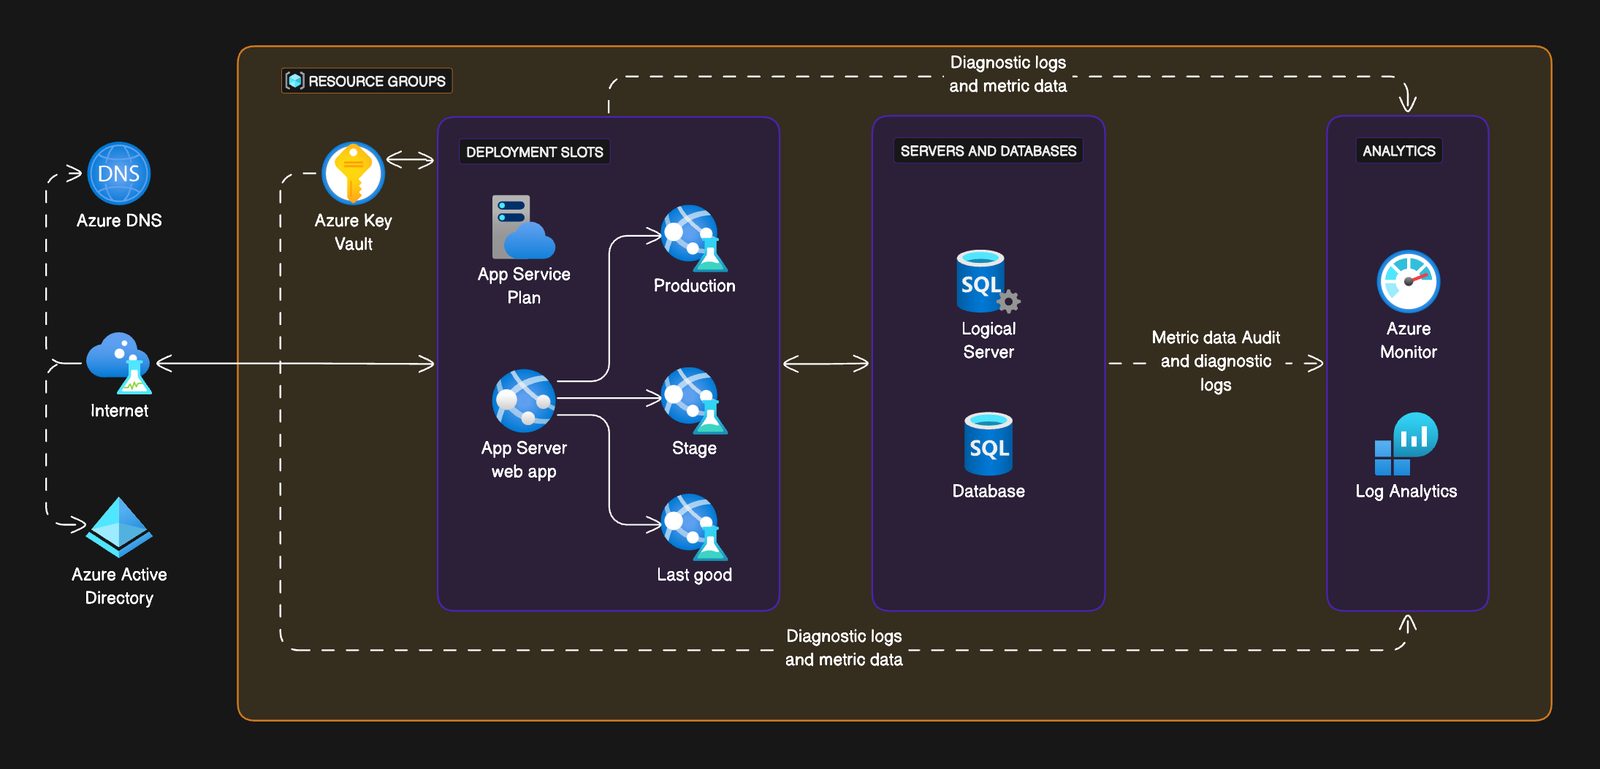
Basic web app on Azure
Optimize and secure your web application deployment with the Basic Web App on Azure example.
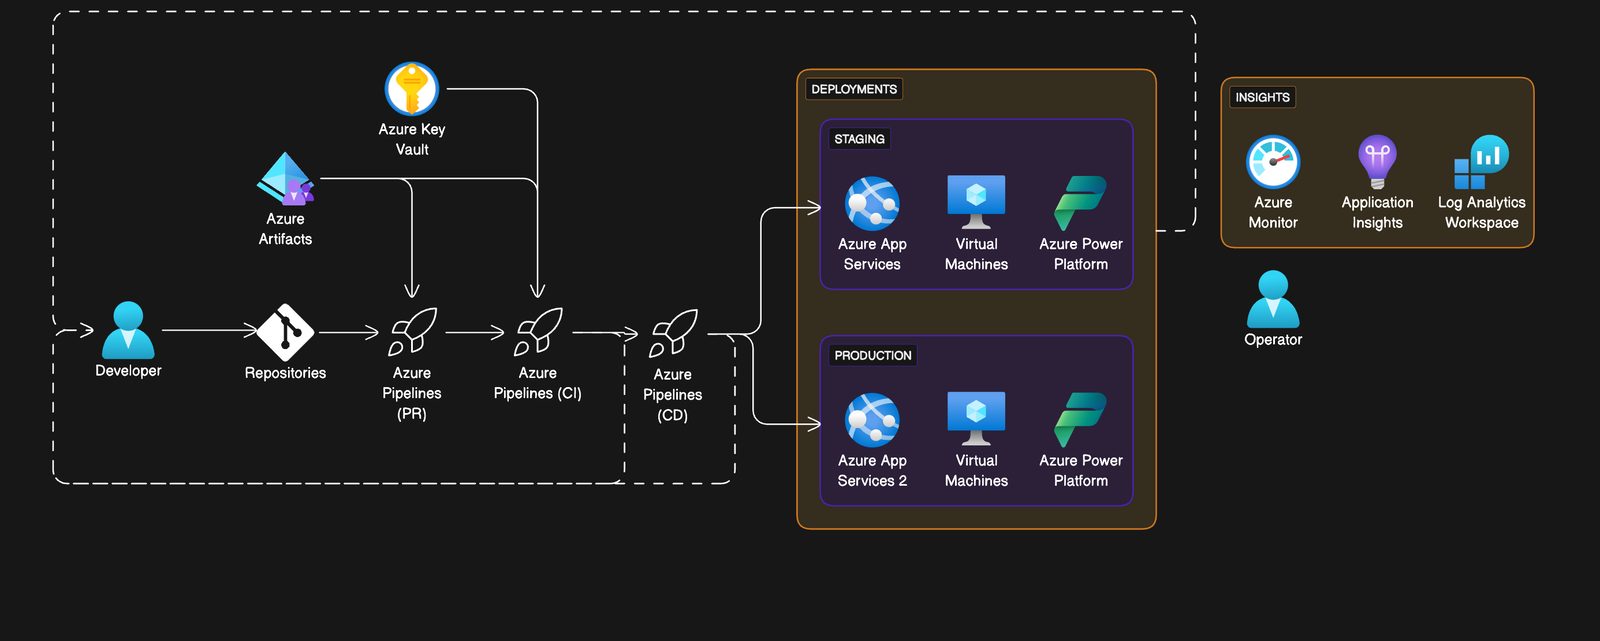
CI/CD using Azure Pipelines
Visualize an end-to-end DevOps workflow with the Azure Pipelines example.
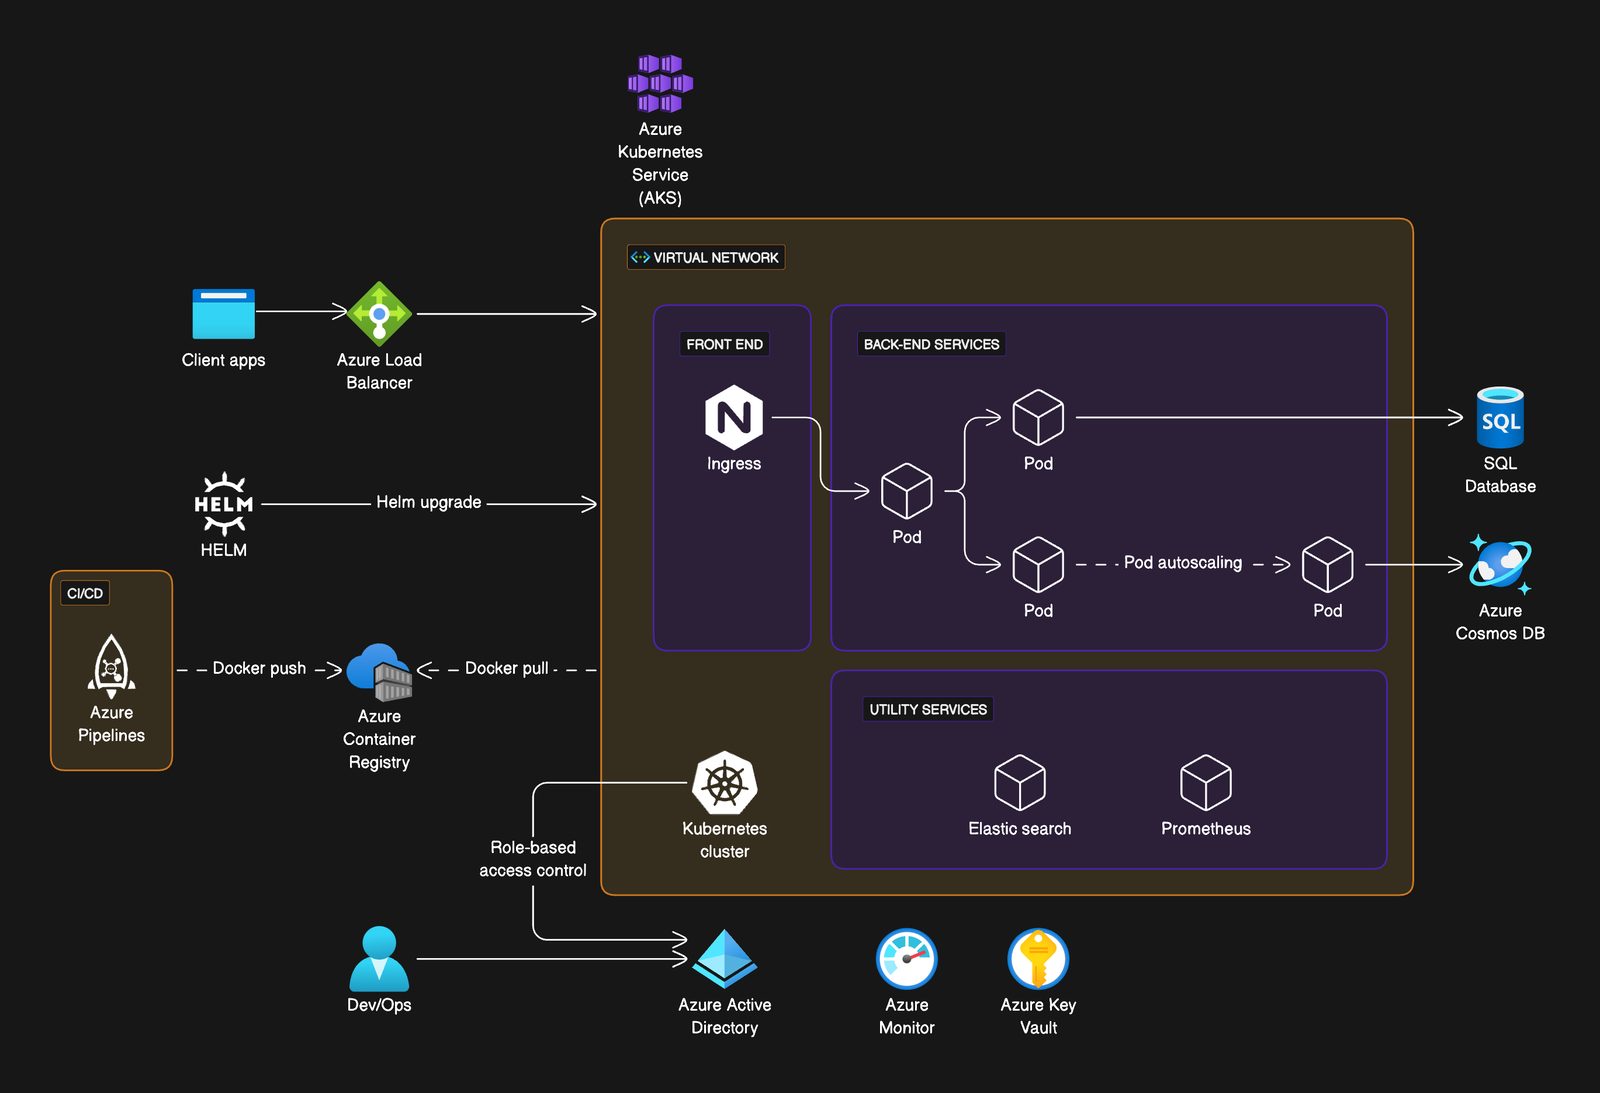
Microservice on Azure Kubernetes Service (AKS)
Visualize a robust and scalable microservices architecture using the Azure Kubernetes Service example.
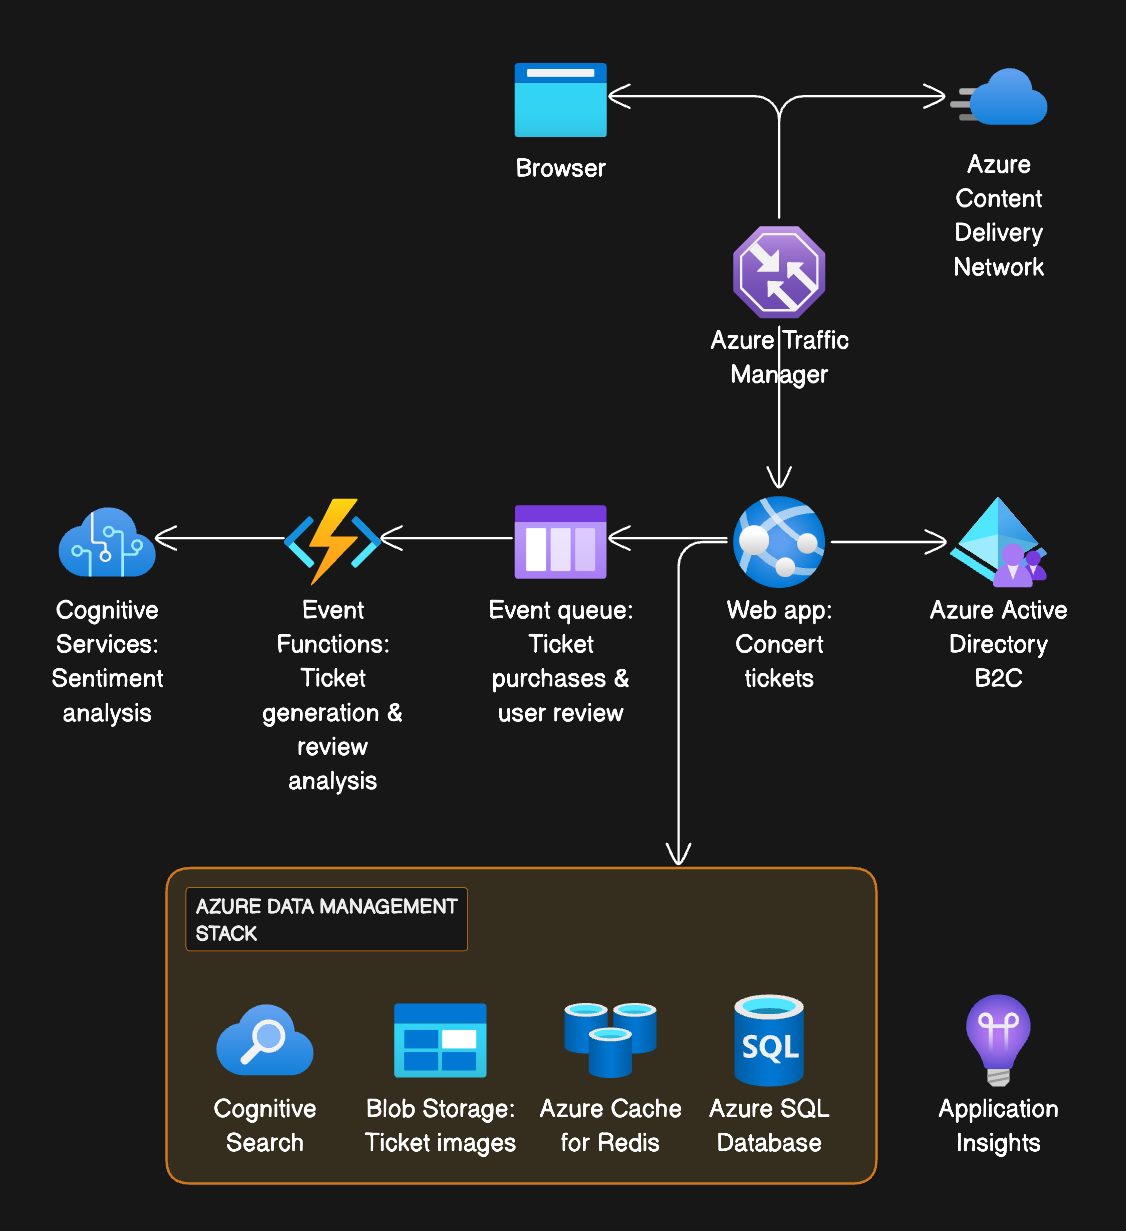
eCommerce app on Azure
Maximize the efficiency and scalability of your online marketplace with the eCommerce app on Azure example.
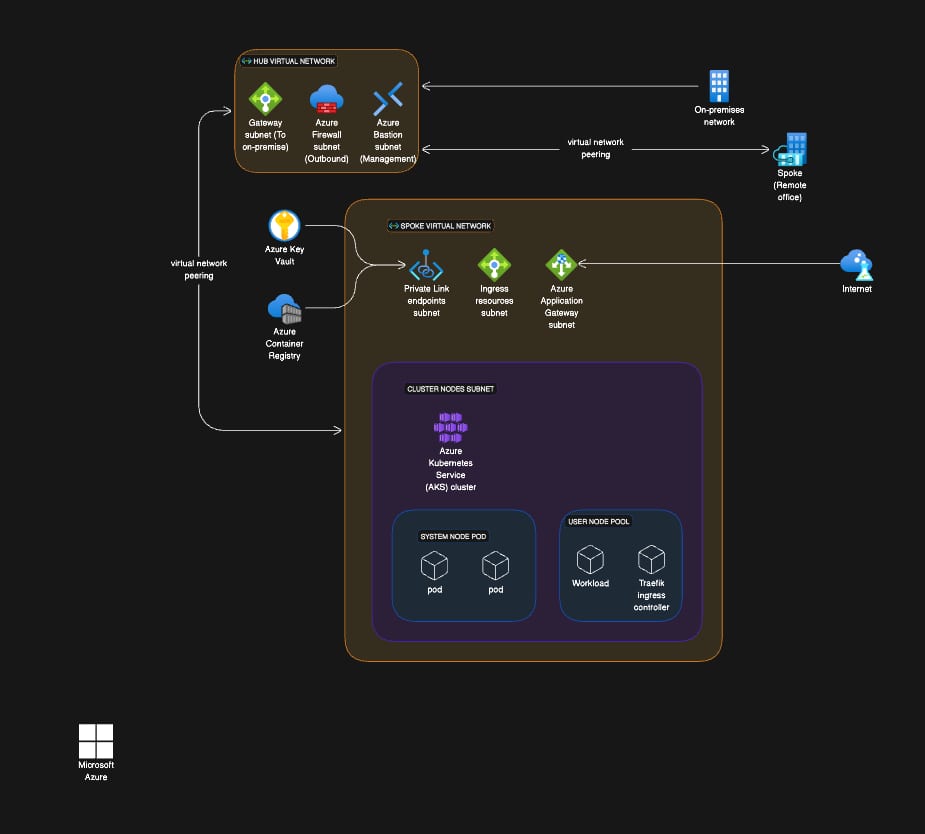
Baseline architecture for Azure Kubernetes Service (AKS)
Visualize the foundation of a secure, scalable Kubernetes environment with the AKS baseline architecture example.
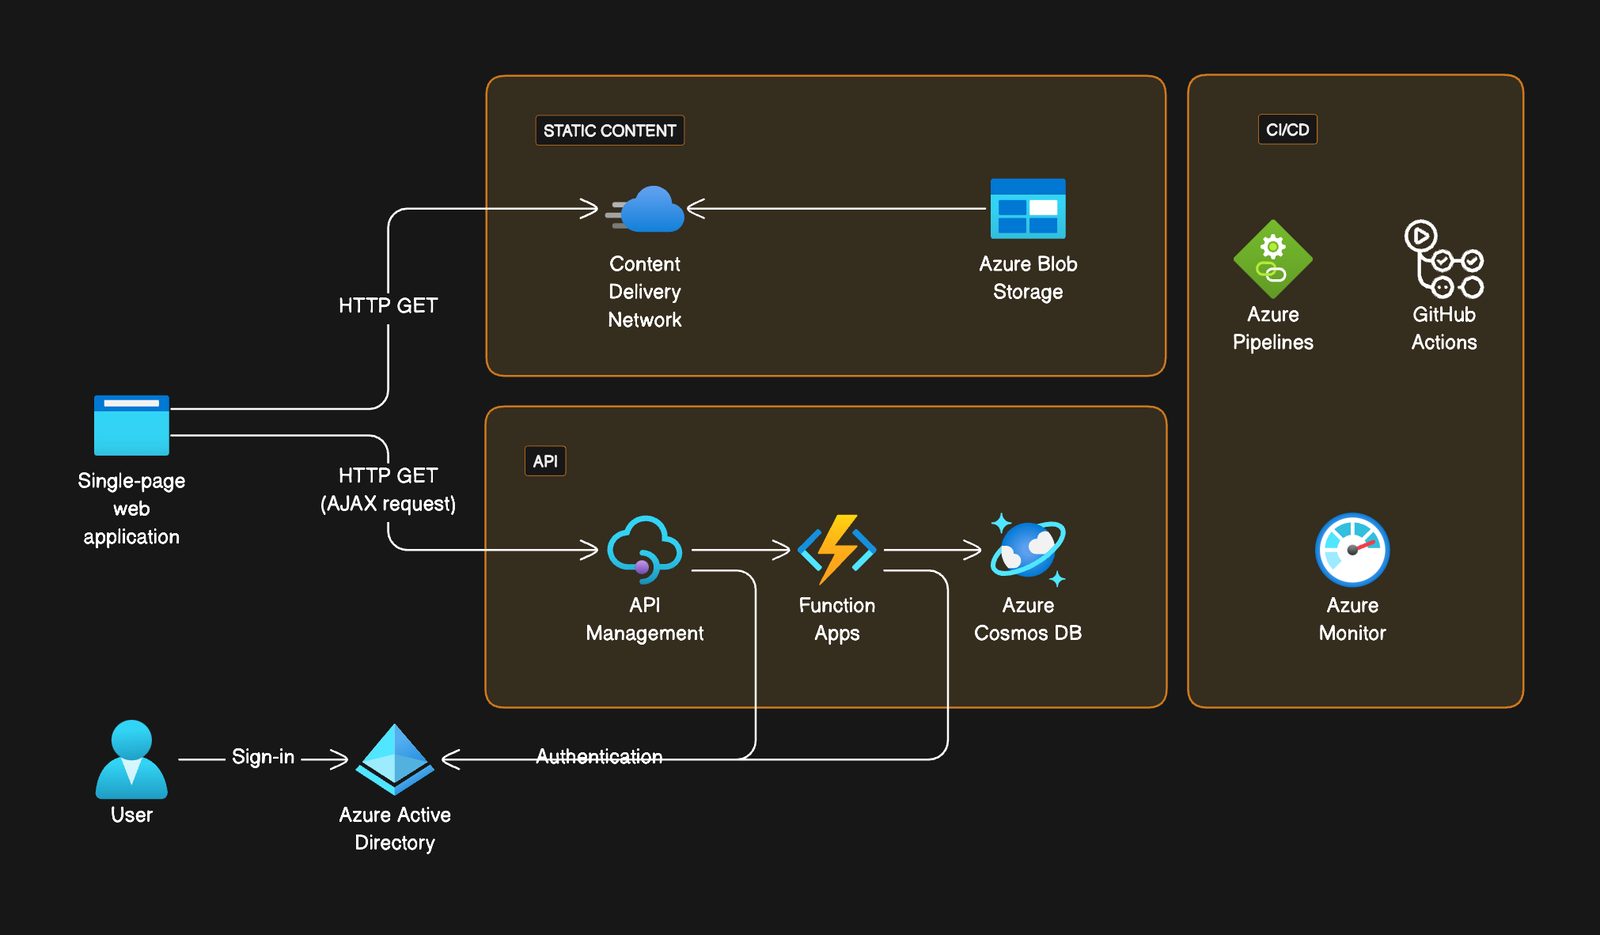
Serverless web app on Azure
Visualize seamless, scalable serverless architecture with the Azure example for a highly responsive web app.
See you in the canvas
Unlock your team’s collaborative super powers.