Data
Data lineage
Data lineage is a record of where a piece of data came from, every transformation it passed through and everywhere it is used, from source system to dashboard.
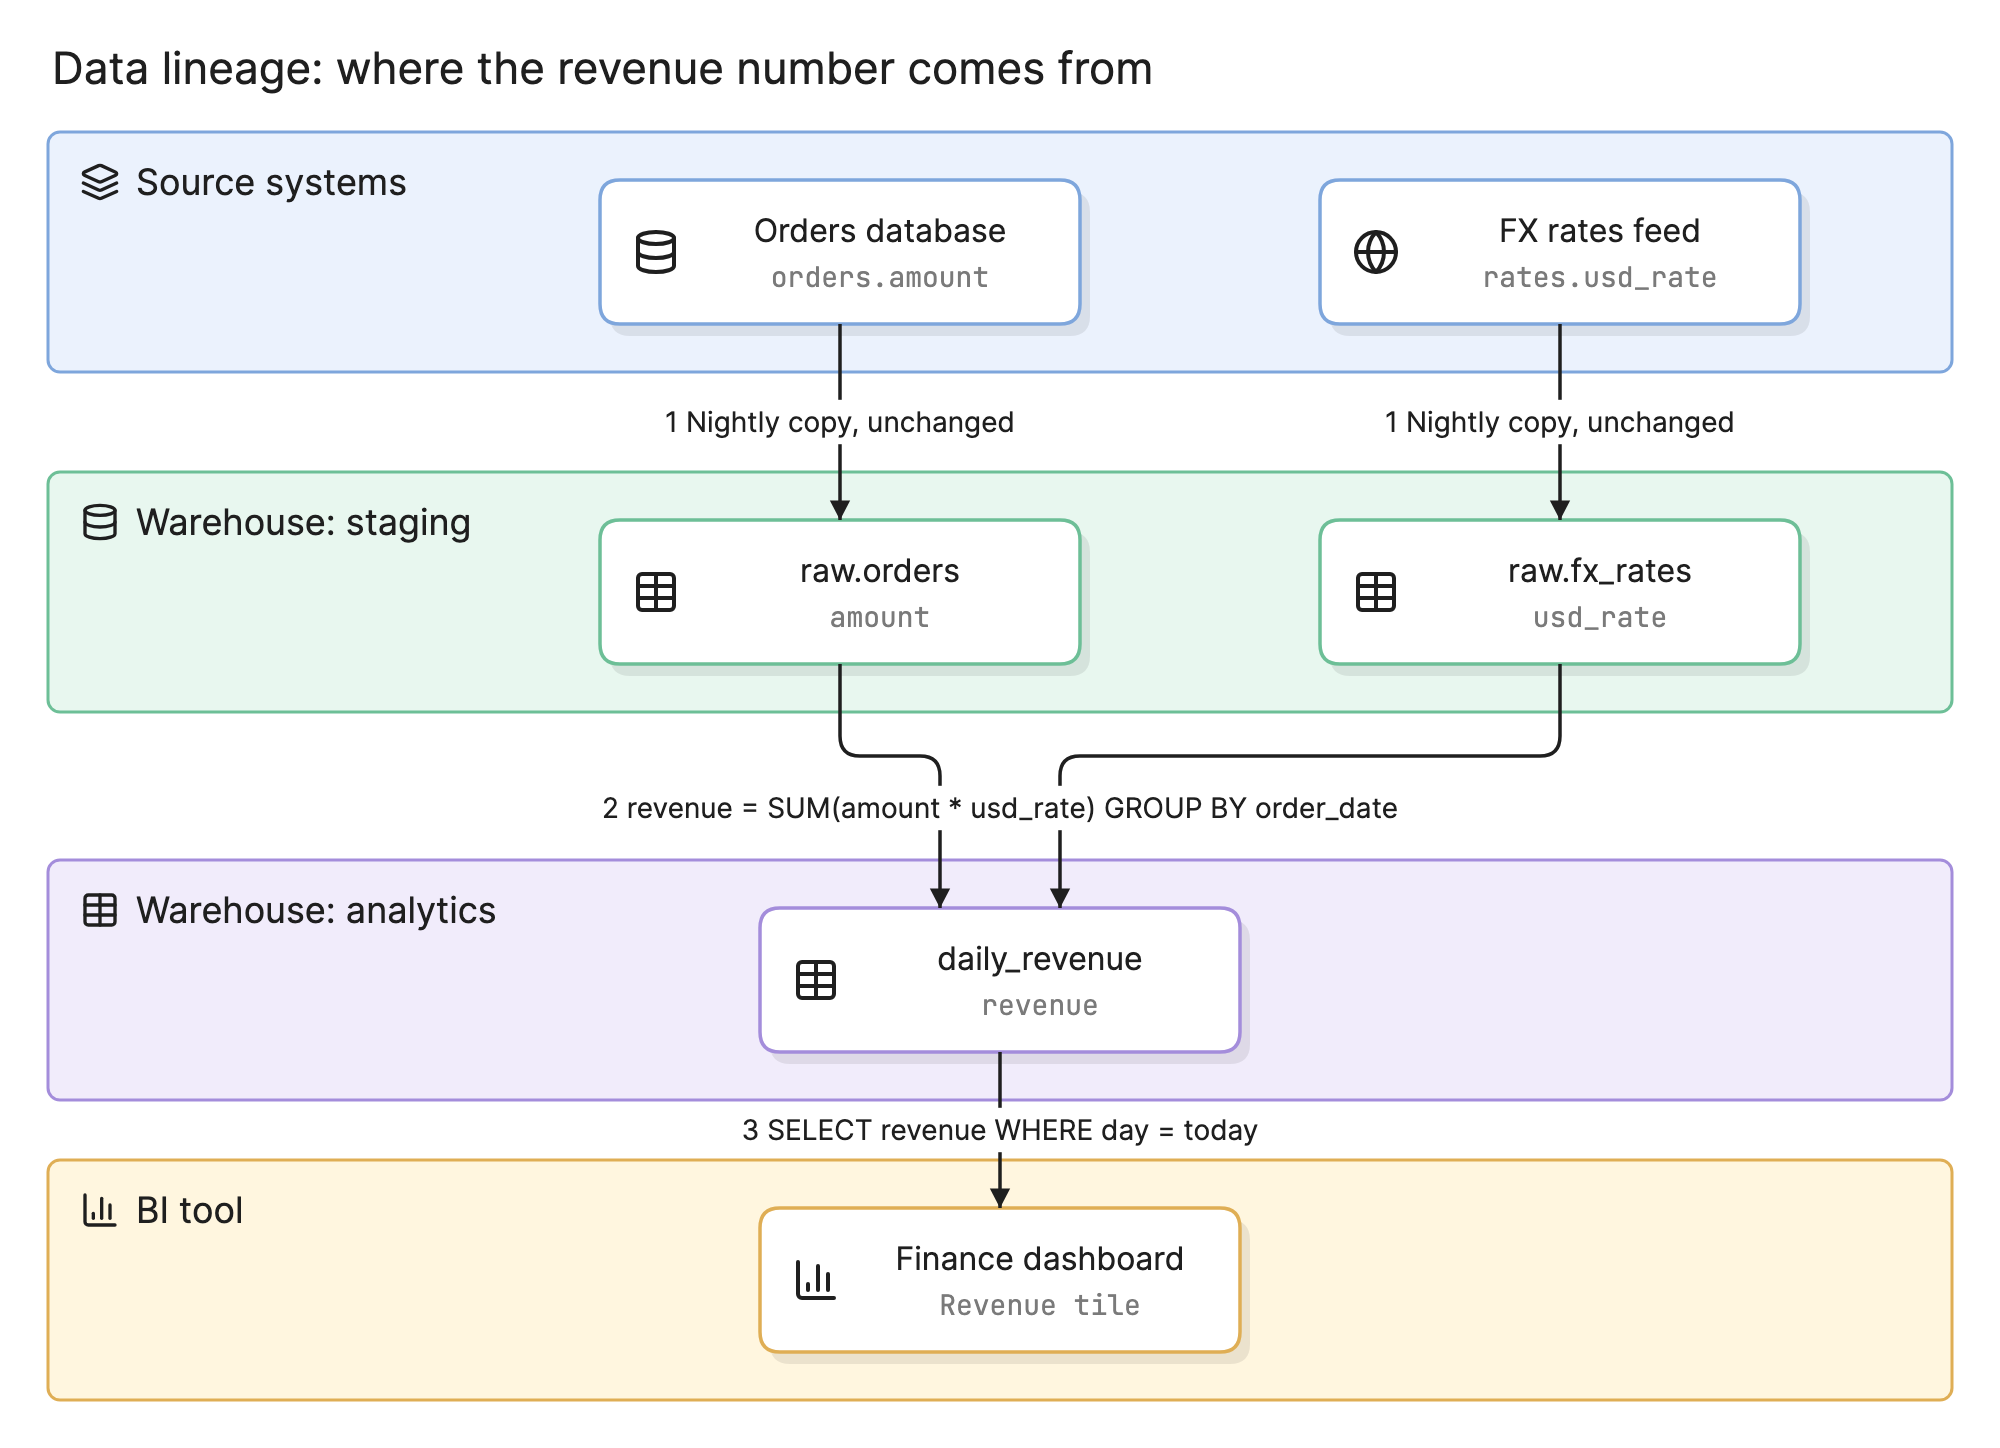
Teams care about data lineage the first time a number on a dashboard is wrong and nobody can say which of the twelve jobs upstream changed. Lineage turns that search from an afternoon of reading SQL into following a graph.
Why does data lineage matter?
- Debugging. When revenue drops 30 percent overnight, lineage shows every table and job between the dashboard and the source, so you check the hops instead of guessing.
- Impact analysis. Before renaming a column or dropping a table, lineage lists every model, report and export that would break.
- Compliance. Audits ask how a figure was calculated and where personal data flows. Lineage is the evidence.
- Trust. Analysts use a dataset more when they can see it comes from a system of record rather than a spreadsheet someone uploaded.
- Cost. Lineage reveals tables that nothing reads, which can be dropped along with the pipelines that build them.
What does data lineage include?
A lineage graph has three kinds of node and one kind of edge.
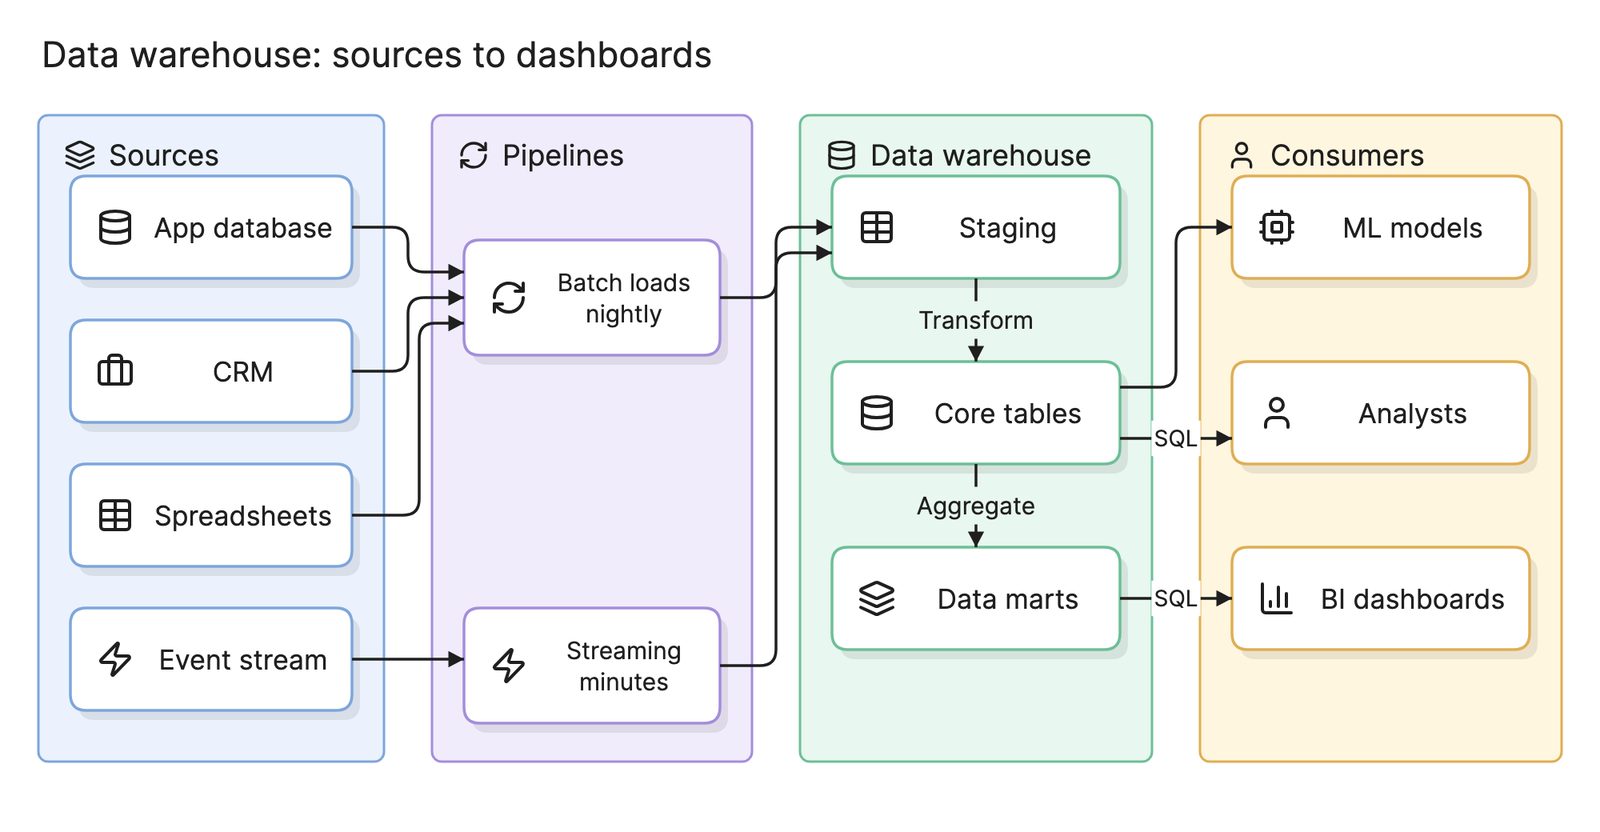
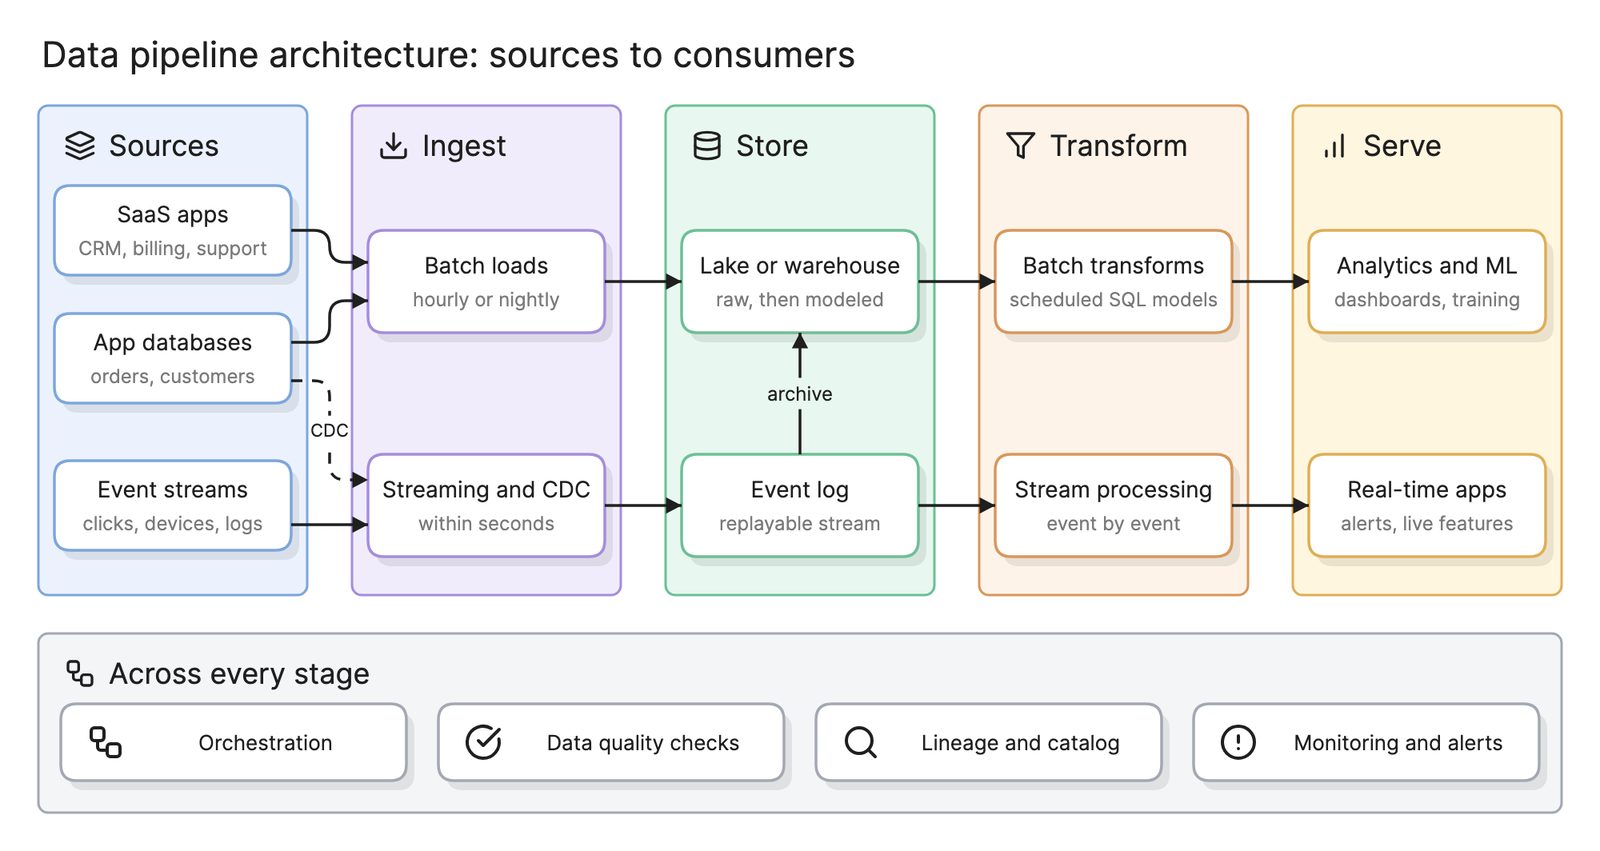
- Sources. The systems where data originates: application databases, event streams, files and third-party feeds.
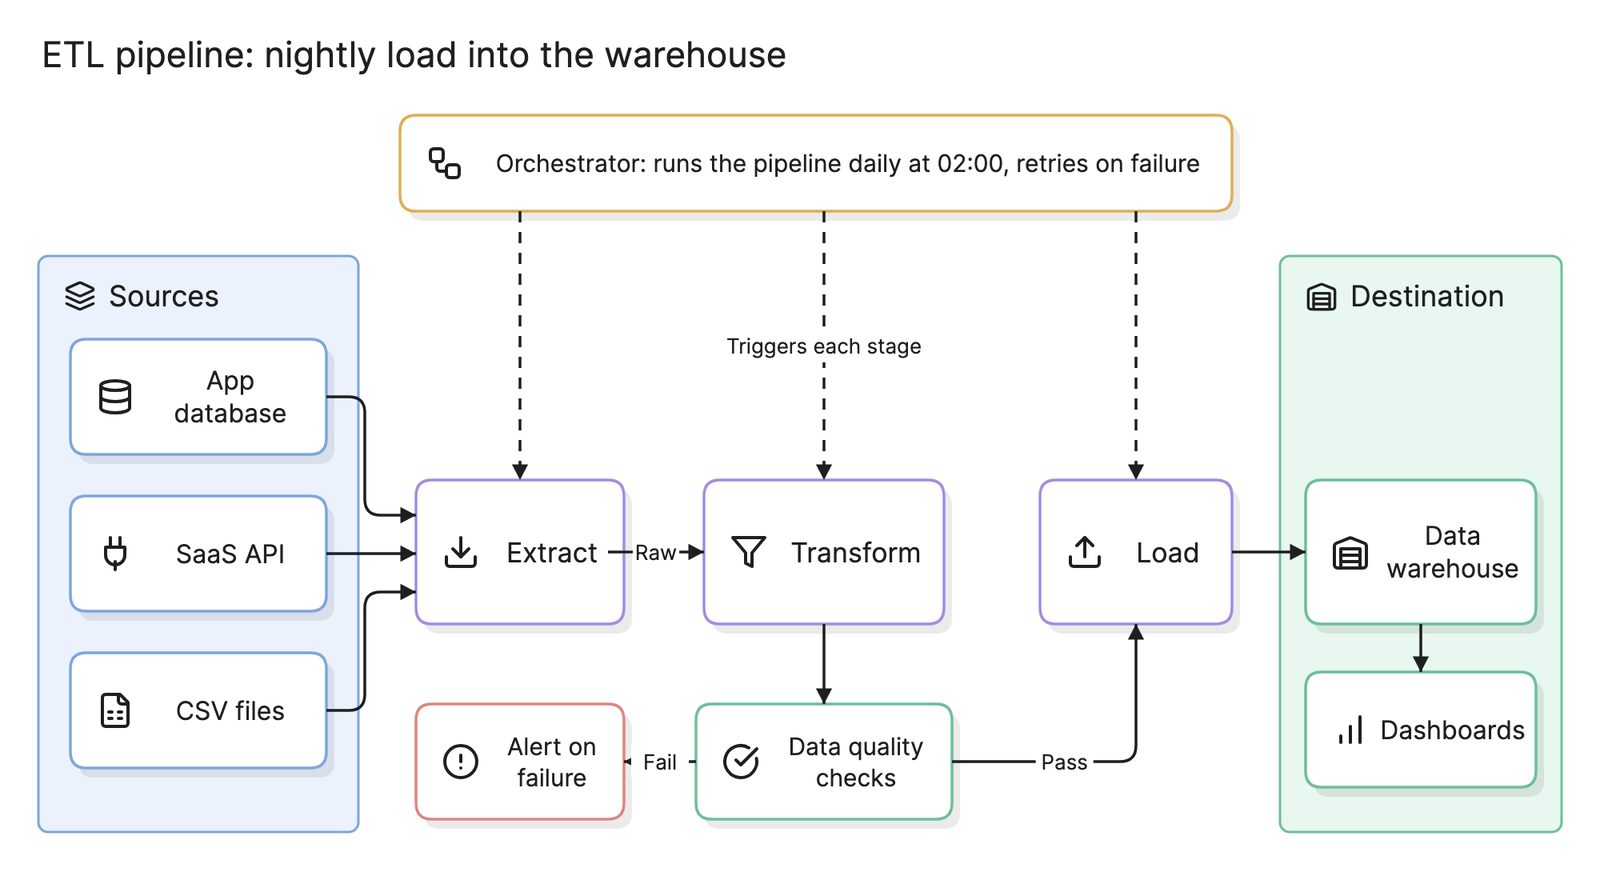
- Transformations. The jobs that read data and write it somewhere else. ETL pipelines, SQL models, notebooks and scheduled scripts all count.
- Consumers. Dashboards, reports, ML models, exports and the downstream tables that other teams own.
- Edges. Each edge says that one node reads from another, and in good lineage it says what changed: a copy, a filter, a join, an aggregation.
Add owners and freshness to the nodes and the same graph answers who to call and whether the data is current.
What are the types of data lineage?
| Type | Records | Good for | Hard part |
|---|---|---|---|
| Table-level | Which tables feed which | A first map of the warehouse | Too coarse for most debugging |
| Column-level | Which columns feed each output column | Debugging one metric, impact analysis | Parsing every SQL dialect and function |
| Business lineage | How a metric is defined in business terms | Audits, executives, data catalogs | Keeping it in sync with the technical graph |
Most teams start with table-level lineage because their transformation framework provides it for free, then add column-level lineage for the tables under their most important dashboards.
How do you read a data lineage diagram?
The diagram at the top of this page follows one field. The finance dashboard shows a revenue tile, and the question is where that number comes from.
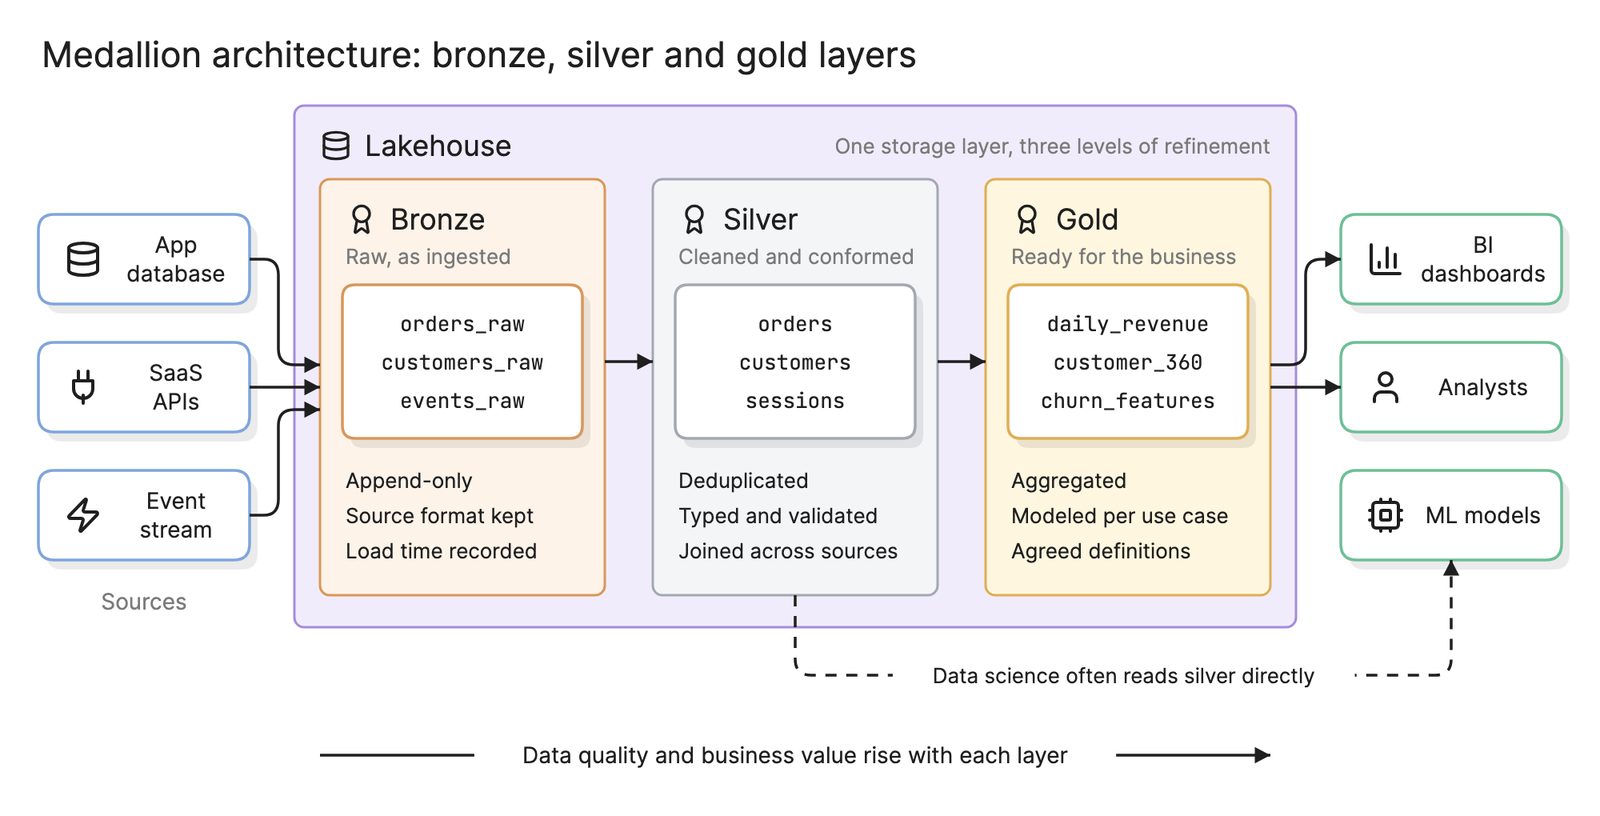
Reading upward, the tile selects the revenue column from a daily_revenue table in the analytics layer of the data warehouse. That column is computed at hop 2 by summing amount times usd_rate, grouped by order date, which means it depends on two staging tables. Each of those is a nightly, unchanged copy of a source: the orders database and an FX rates feed. In a medallion architecture the same trace runs from gold through silver back to bronze.
Now the debugging path is short. If revenue dropped, either orders fell, the FX feed delivered a bad rate, one of the nightly copies did not run, or the SUM changed. Four places to look instead of the whole warehouse. Run the same reading downward from orders.amount and you get impact analysis: changing that column’s type touches one staging table, one model and one dashboard.
How do you capture data lineage?
- Pick the scope. Start with the tables under the dashboards executives look at, not the whole warehouse.
- Pull dependencies from the transformation layer. SQL model frameworks already know which models read which, and emit it as a graph.
- Parse query logs for the rest. Warehouse query history shows which tables each job read and wrote, which catches scripts outside the framework.
- Connect the BI tool. Export which fields each dashboard uses, so lineage reaches the consumer rather than stopping at the last table.
- Record the sources by hand. Pipelines that copy from a SaaS API rarely emit lineage, so document the mapping once.
- Draw the critical paths. For the handful of metrics that matter most, draw a data flow diagram like the one above and keep it with the pipeline code.
What are common data lineage mistakes?
- Documenting by hand only. Hand-drawn lineage is wrong within a month. Generate the technical graph and reserve manual work for the sources and the business definitions.
- Table-level forever. A wide table with 200 columns feeds every dashboard, so table-level lineage says everything depends on everything.
- Ignoring the last mile. Lineage that stops at the warehouse cannot tell you which dashboards break.
- No owners on nodes. A graph that shows the broken hop but not who runs it still leaves you searching.
- Treating it as a one-time project. Lineage is only useful if it updates whenever the pipelines do.
How does data lineage compare with related diagrams?
| Diagram | Shows | Built from |
|---|---|---|
| Data lineage graph | Where specific data came from and went, hop by hop | Parsed SQL, query logs, BI metadata |
| Data flow diagram | How data moves through a system’s processes and stores | A design, drawn by hand |
| Data model | The entities and relationships in the data | Business analysis |
| Database schema | The tables, columns and keys in one database | The database itself |
A lineage graph is a data flow diagram that is generated rather than designed, and that follows real tables and columns rather than conceptual processes.
What tools help with data lineage?
- Transformation frameworks. SQL model tools produce a dependency graph of every model as a by-product of running them, which is table-level lineage for free.
- Data catalogs and lineage platforms. These parse warehouse query logs and BI metadata to build column-level lineage across tools, and add owners, tags and search. A data fabric builds on the same metadata.
- AI diagramming tools. Tools like Eraser turn a written description of a pipeline into a data flow diagram you can keep editing, which suits the critical paths you want to explain to people rather than query.
For more on this kind of diagram, see data flow diagrams.
Frequently asked questions
-
What is the difference between data lineage and data provenance?
Provenance is the origin story of a dataset: who created it, from what, under what license. Lineage is the full path, including every transformation and every downstream use. In practice the words overlap, and most tools that claim either show a graph of sources, transformations and consumers, which is what this page describes.
-
What is the difference between table-level and column-level lineage?
Table-level lineage records that one table was built from another. Column-level lineage records which input columns produced each output column. The second is far more useful for debugging and impact analysis, because a dashboard usually depends on three columns of a wide table, not all of them, but it is harder to capture.
-
How is data lineage captured?
Mostly by parsing SQL and pipeline code. Transformation frameworks know the dependencies between their models, warehouses expose query logs that show which tables each query read and wrote, and BI tools know which fields each chart uses. A lineage tool stitches those together into one graph. Manual documentation fills the gaps.
-
Is data lineage required for compliance?
Several regulations assume you can show where personal or financial data came from and where it went. Lineage is how teams answer a deletion request that has to reach every copy of a customer's data, or an audit question about how a reported figure was calculated, without reading every pipeline by hand.