Diagram types
Data flow diagram
A data flow diagram (DFD) is a visual map of how data moves through a system, including where it comes from, how it changes, where it is stored and where it goes.
DFDs help teams understand a system before changing it, and they show where sensitive data travels during security and compliance reviews. The technique grew out of structured analysis in the 1970s, through the work of Larry Constantine, Ed Yourdon and Tom DeMarco.
When should you use a data flow diagram?
- Understanding an unfamiliar system. Follow the data to learn what a system actually does.
- Designing a new system. Agree on what data each part needs before deciding how to build it.
- Security reviews. See where sensitive data travels and where it crosses a boundary.
- Privacy and compliance. Show where personal data is collected, stored and shared.
- Planning a migration. Find everything that reads from or writes to a system before you move it.
What are the parts of a data flow diagram?
External entities
People or systems outside the one you are modeling that send or receive data, such as a customer or a payment provider. They are usually drawn as rectangles.
Processes
Anything that changes data, such as “Validate order”. Name each one with a verb and a noun. Depending on the notation, a process is a circle or a rounded rectangle.
Data stores
Places where data rests, such as a database table or a file. They are drawn as open-ended rectangles or parallel lines.
Data flows
Arrows that show data moving between the other three, each labeled with what is moving. The label is a noun, like “Order total”, because a flow carries data rather than doing work.
What are the levels of a data flow diagram?
DFDs are layered, so that each level adds detail to the one above.
- Level 0, or the context diagram, shows the whole system as one process and its connections to the outside world.
- Level 1 breaks that process into its main sub-processes and adds data stores.
- Level 2 and below break a single level 1 process down further. Most teams rarely need to go deeper than this.
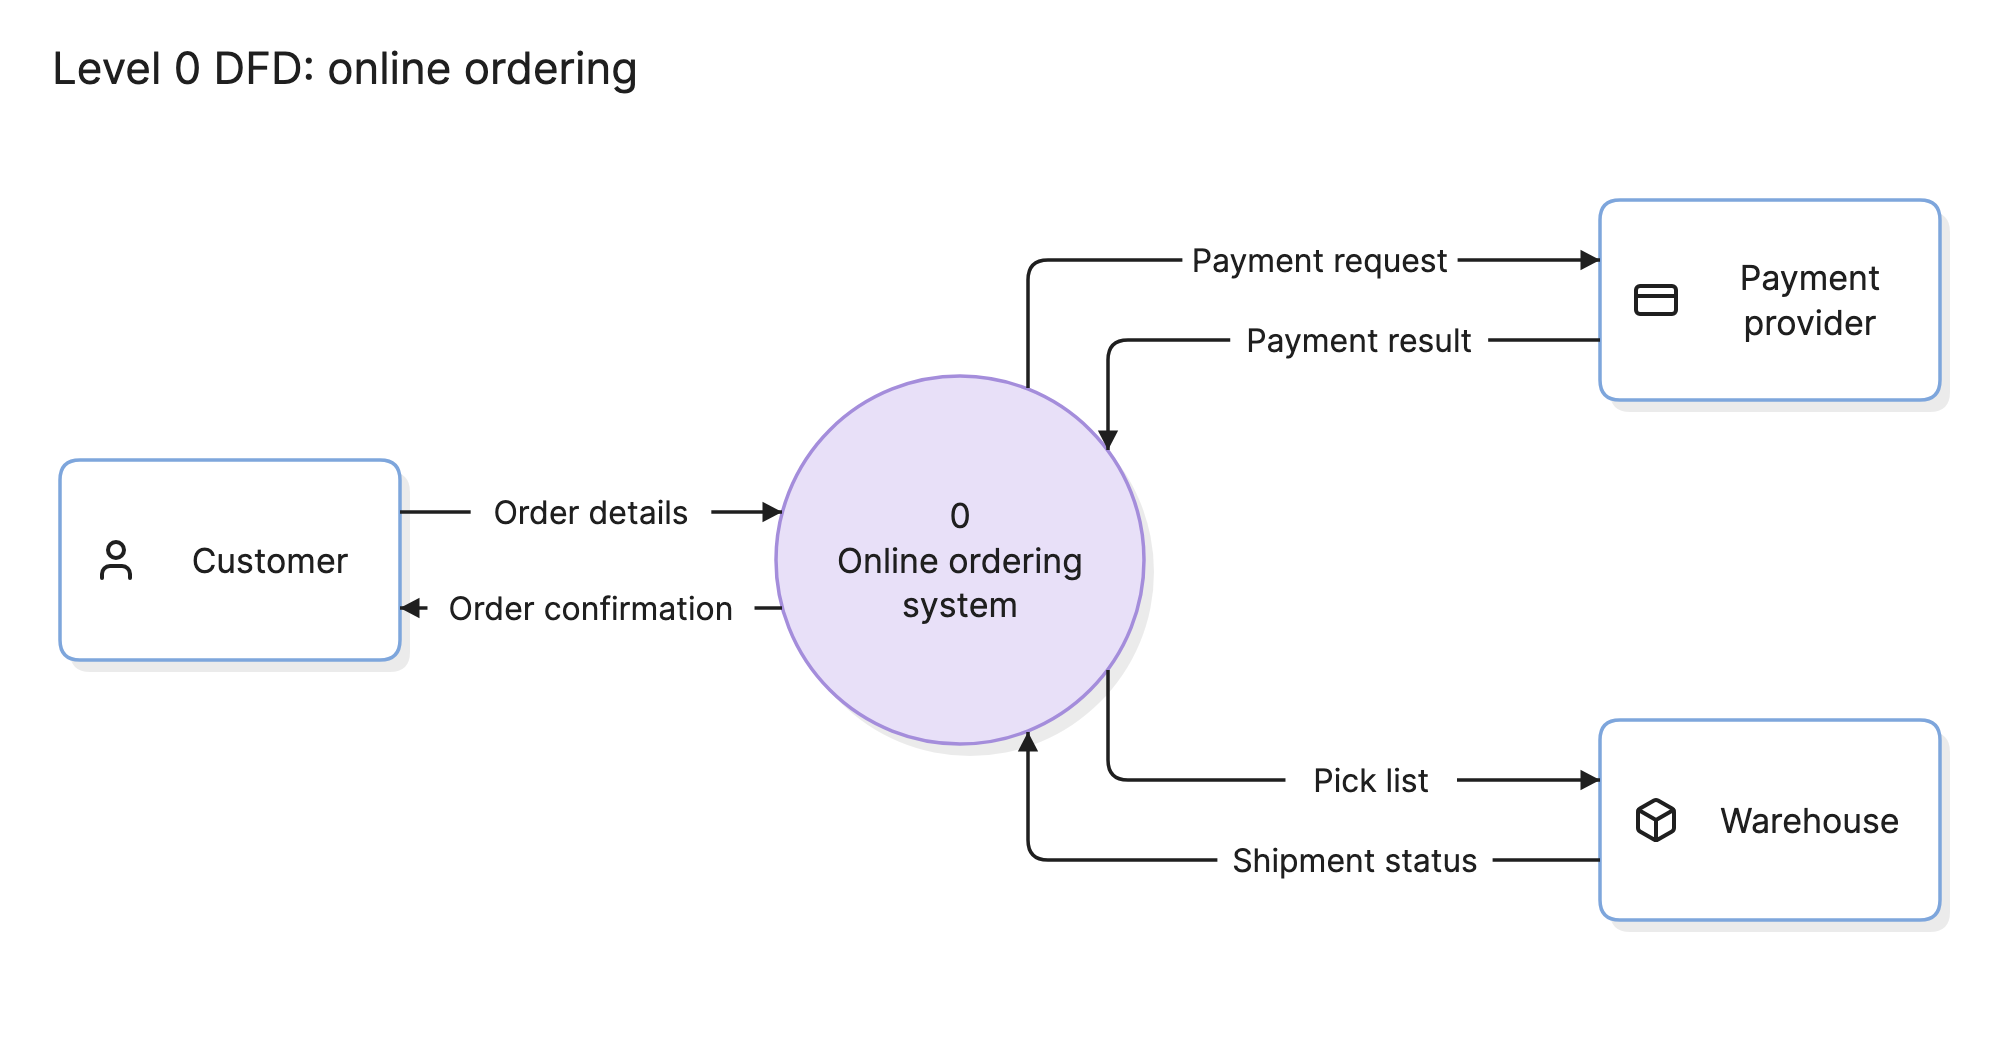
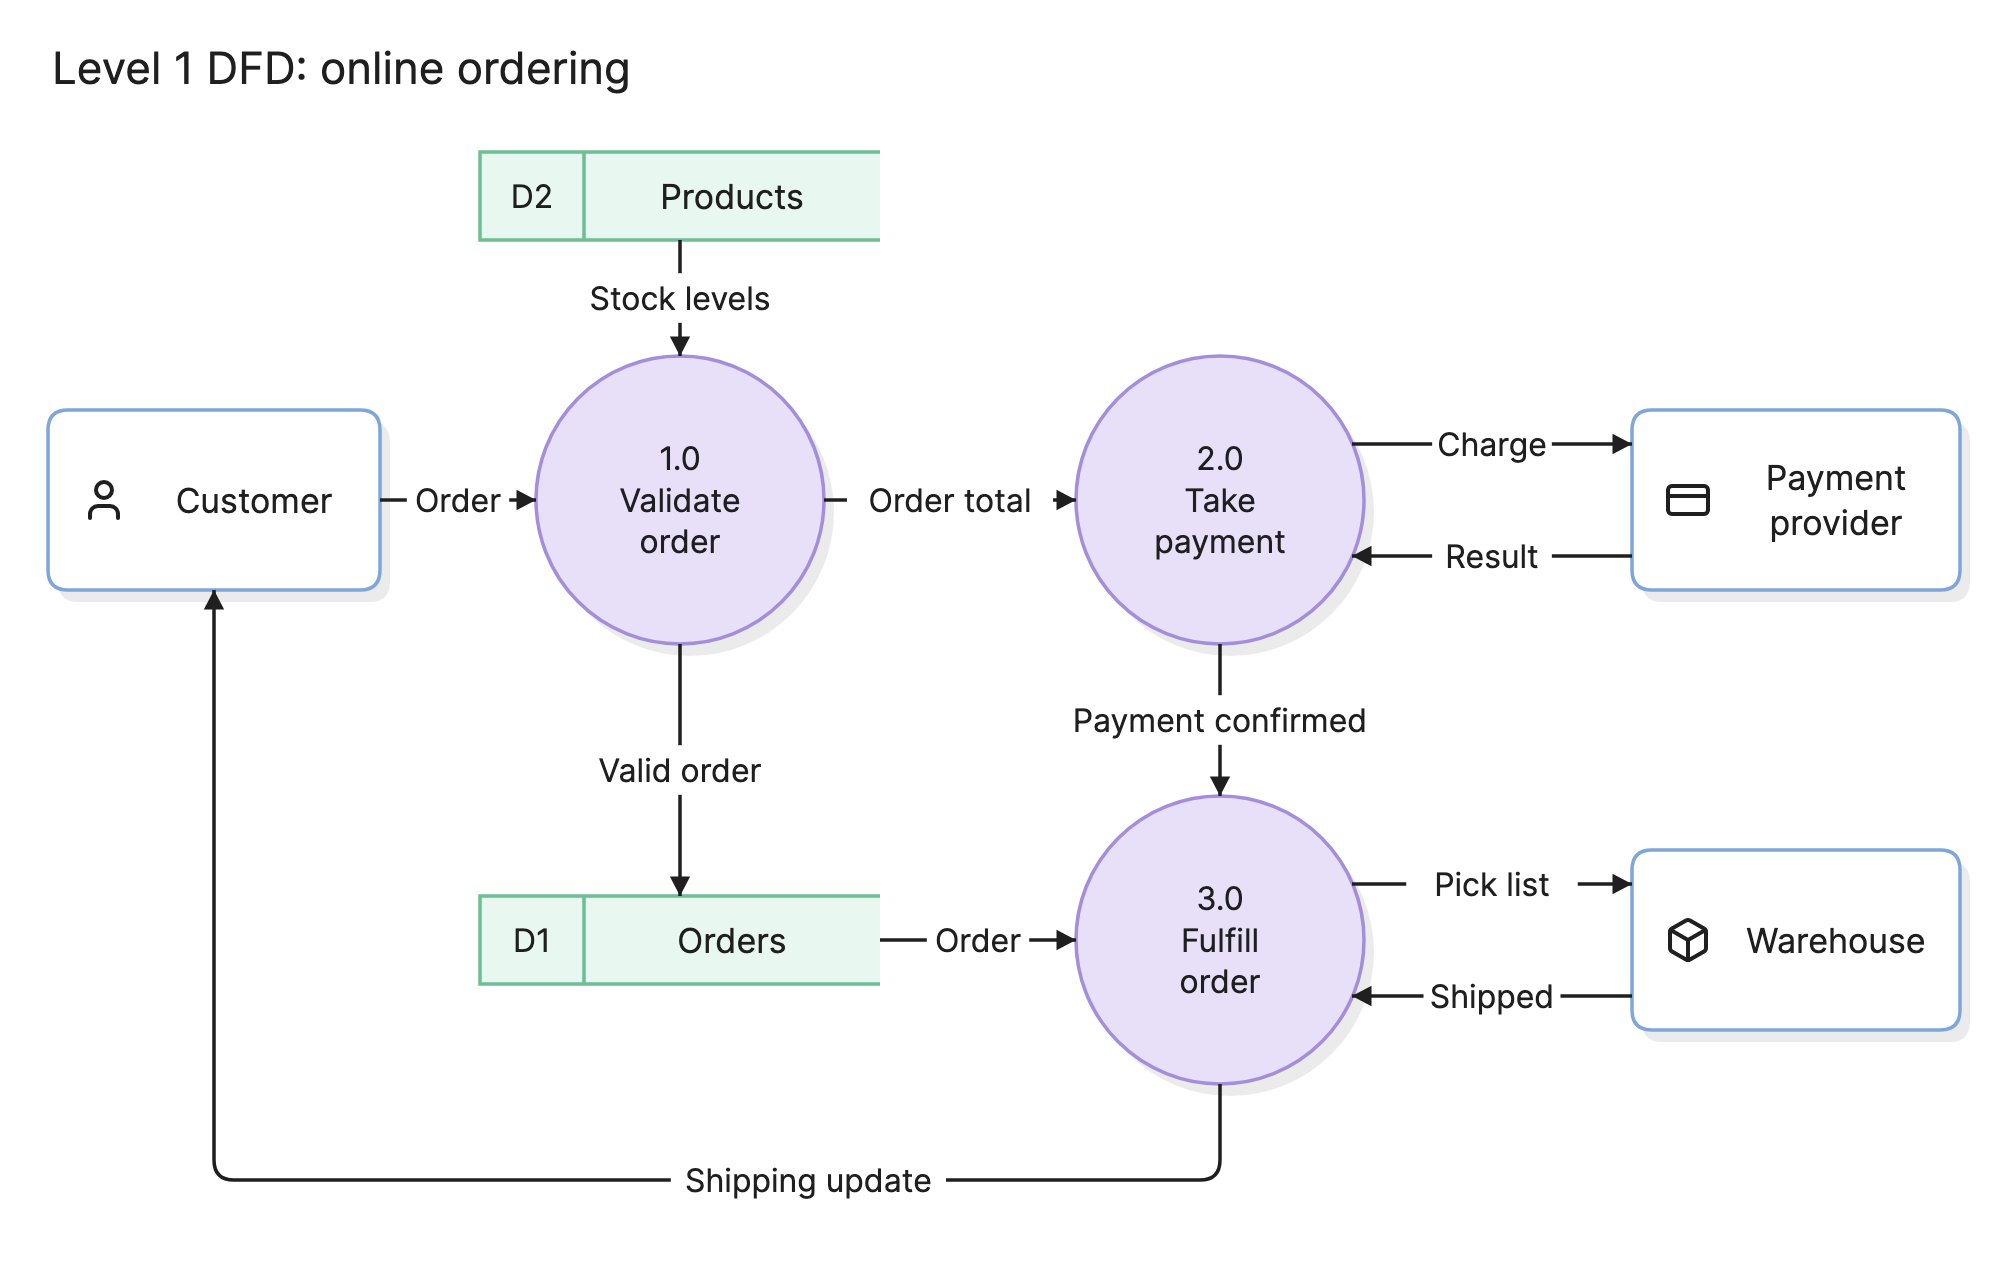
Levels should stay balanced: data going in and out of a process should match what goes in and out of the diagram that expands it. In these examples, the customer, payment provider and warehouse appear at both levels.
How do you read a data flow diagram?
Pick an input and follow it through. In the level 1 example at the top of this page, the customer sends an order to process 1.0, which checks stock levels from the products store. A valid order is saved to the orders store, and its total goes to process 2.0.
Process 2.0 exchanges a charge and a result with the payment provider, then passes a payment confirmation to process 3.0. That process takes the order from the orders store, sends a pick list to the warehouse, receives shipment status back and sends the customer a shipping update.
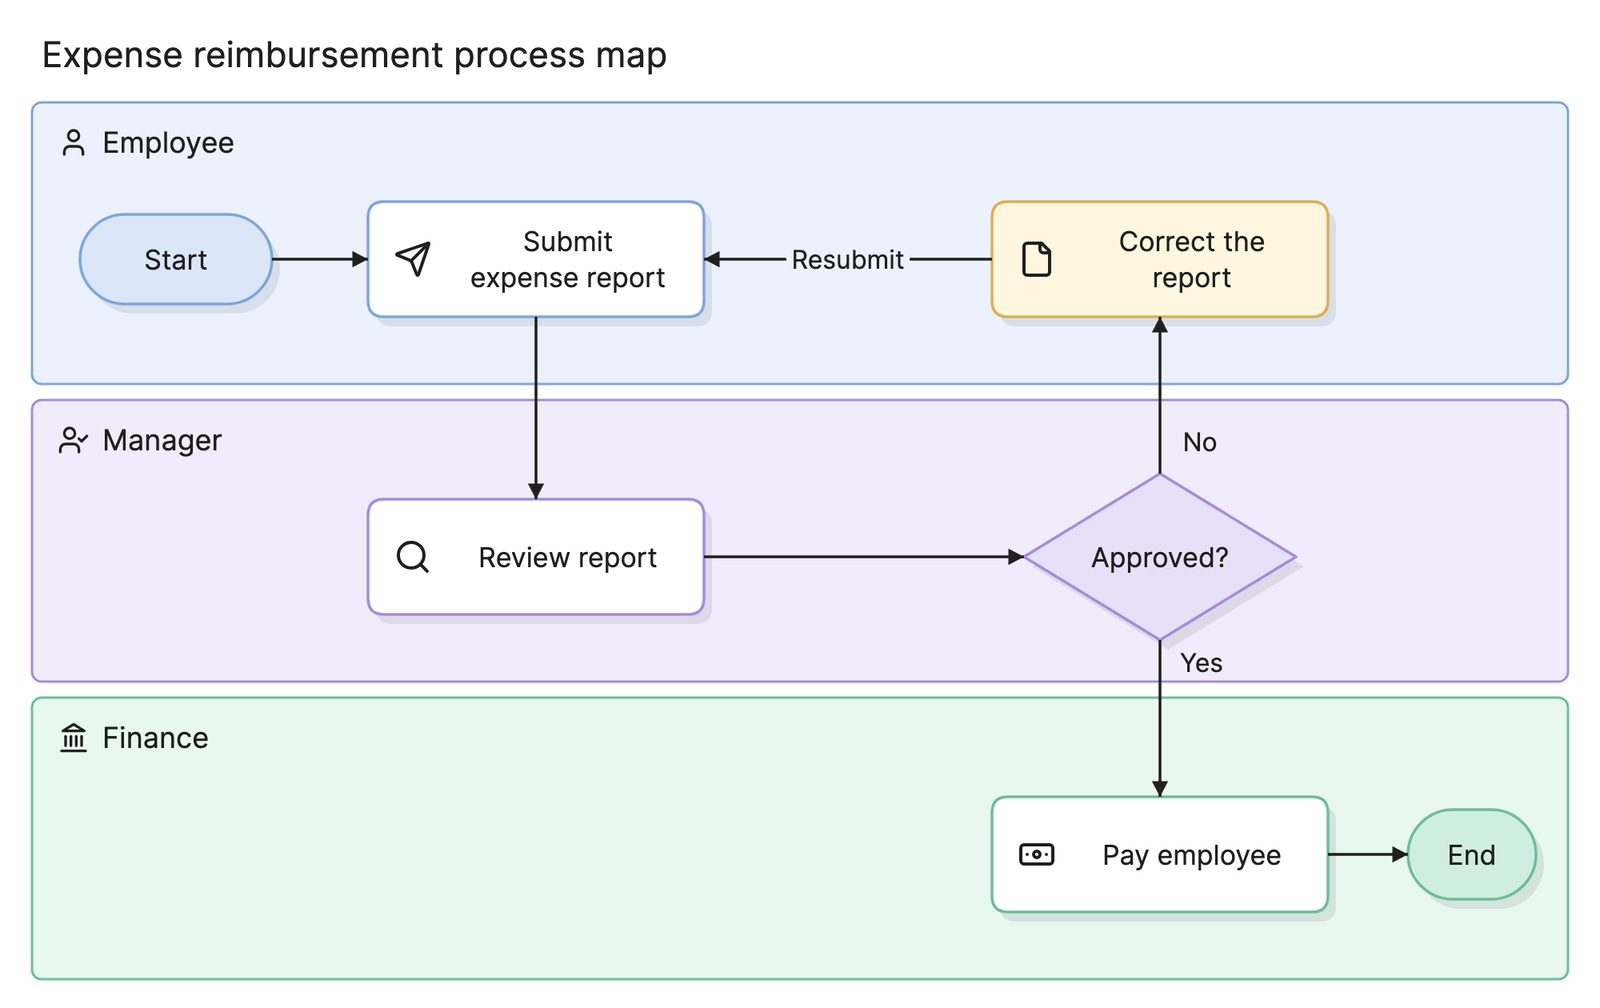
The diagram does not say how long any step takes or what happens if a payment fails. It only shows what data exists and where it goes, which is why teams often pair it with a process map.
What is the difference between logical and physical DFDs?
A logical DFD describes what the system does and what data it needs, without saying how it is built. The examples on this page are logical: “Take payment” does not name a service or a vendor.
A physical DFD shows how the system is implemented, including the actual services, databases, files and protocols. Start with a logical DFD to agree on what should happen, then draw a physical one when you need to plan the build or review its security.
What notations do DFDs use?
The two common notations differ mostly in their shapes. Yourdon and DeMarco use circles for processes and parallel lines for data stores. Gane and Sarson use rounded rectangles for processes and open-ended rectangles for data stores. Both describe the same four components, so pick one and use it consistently.
How do you create a data flow diagram?
- Define the system boundary. Decide what is inside the system and what is not.
- Draw a context diagram. Add the external entities and the data they exchange with the system.
- Break the system into processes. Turn its main functions into level 1 processes.
- Add data stores and flows. Label every arrow with the data it carries.
- Check the rules. Fix anything from the list below, then add another level only where it helps.
What are common DFD mistakes?
- Black holes. A process has inputs but no outputs, so data goes in and never comes out.
- Miracles. A process has outputs but no inputs, so data appears from nowhere.
- Direct links with no process. Data should not jump between two entities or two data stores without a process between them.
- Drawing control flow. Decisions and loops belong on a flowchart or a process map.
How does a DFD compare with other diagrams?
| Diagram | What it follows | Shows order? |
|---|---|---|
| Data flow diagram | Data moving between processes and stores | No |
| Process map | Work moving between steps and roles | Yes |
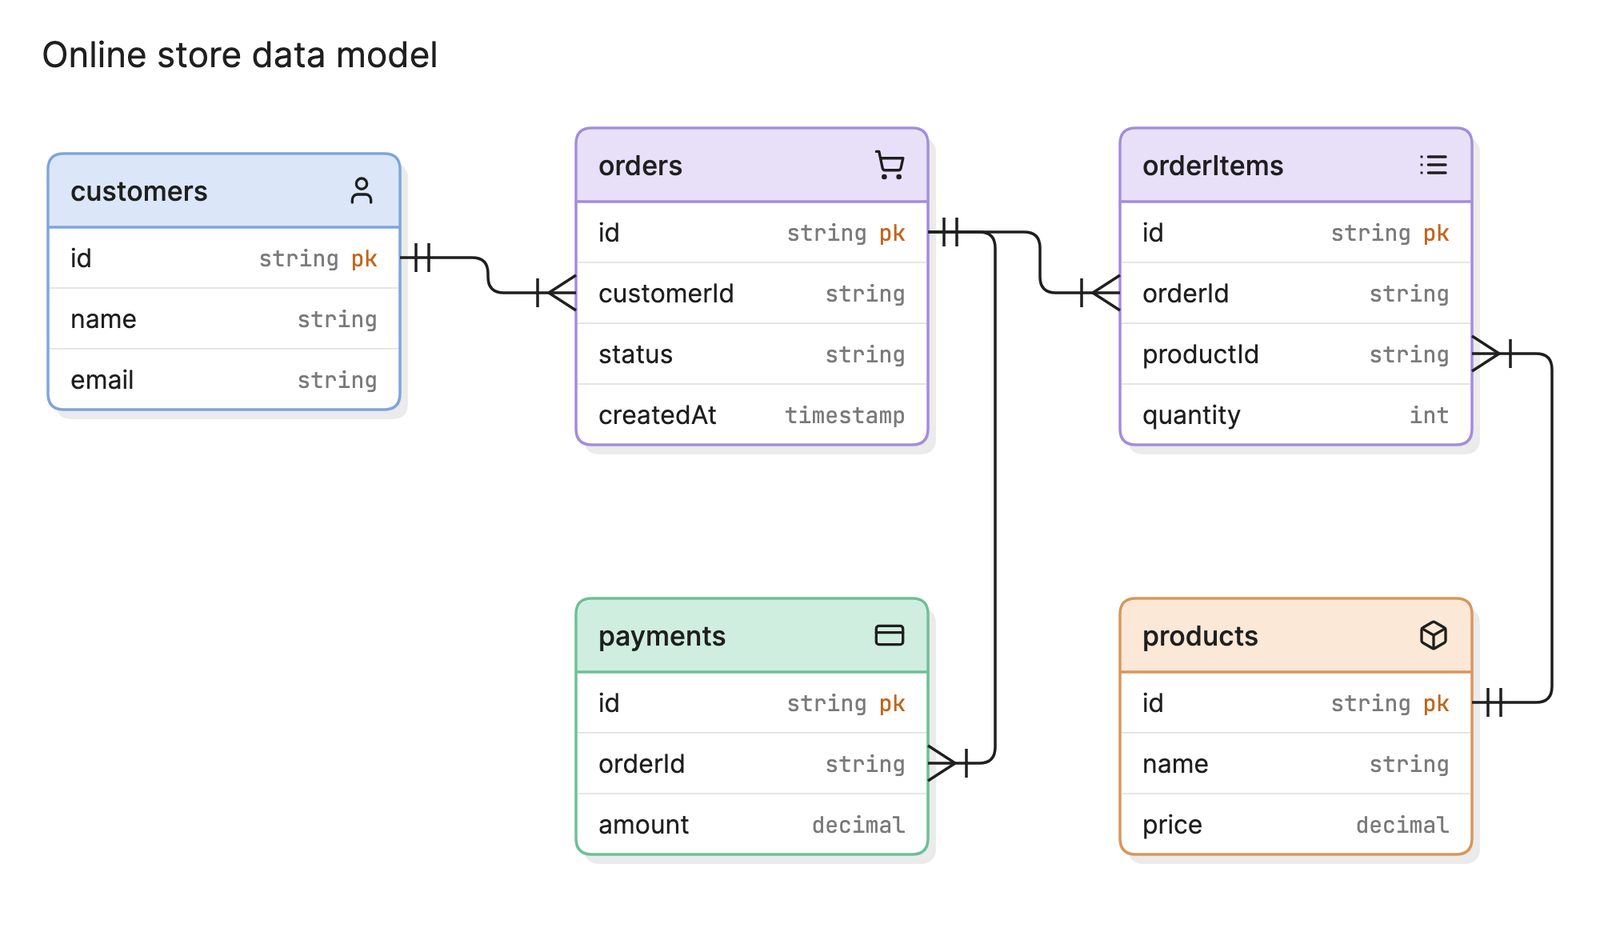
| Entity relationship diagram | How stored data is structured | No |
| Sequence diagram | Messages between components over time | Yes |
What tools can you use to make a data flow diagram?
Most teams use one of three approaches.
- Whiteboards. These work well for a first pass with the team, especially when you are still working out the system boundary.
- Drag-and-drop diagramming tools. These give you full control over the layout and are a good fit for diagrams you will maintain by hand.
- AI diagramming tools. Tools like Eraser turn a description of your system into a first draft that you can keep editing, which is a faster way to get from notes to a diagram the team can correct.
To see a finished example, look at this data flow diagram for online payments.
Frequently asked questions
-
What are the four components of a data flow diagram?
The four components are external entities, processes, data stores and data flows.
-
What is the difference between a data flow diagram and a flowchart?
A flowchart shows the order of steps and the decisions between them. A DFD shows what data moves where. It has no decision points and does not show the order in which things happen.
-
What is the difference between a DFD and an ERD?
A DFD shows data in motion, while an entity relationship diagram shows how stored data is structured. A data store on a DFD often corresponds to one or more tables on an ERD.
-
What are DFDs used for in security?
Threat modeling often starts with a DFD. Places where data crosses a trust boundary, such as between the internet and an internal service, show the team where to look for threats.