Diagram types
Process map
A process map is a diagram that shows the steps in a process, who does each one and the decisions along the way, from the first step to the last.
Process maps give a team one shared view of how work actually gets done. That makes bottlenecks, duplicate work and unclear ownership easier to spot, and it gives new hires and auditors something concrete to follow.
When should you use a process map?
- Improving a process. Map how it runs today to find delays, rework and unnecessary approvals.
- Onboarding. Show new team members how their work connects to everyone else’s.
- Compliance and audits. Document who approves what, and in what order.
- Automation. Agree on the current steps before you automate any of them.
- System changes. See which steps and teams a new tool will affect.
What should a process map include?
A useful process map answers a few questions for every step.
- What happens? Describe the action in a few words.
- Who does it? Name a role or team rather than a person, so the map stays accurate when people change jobs.
- What triggers it? Show what has to finish first.
- What can go wrong? Show the decisions, rejections and rework, not just the path where everything works.
- What comes out? Note any document, approval or data the step produces.
What symbols do process maps use?
Most process maps use a small set of shapes taken from flowcharts. Stick to these unless your organization has its own standard, because a map only works if everyone can read it.
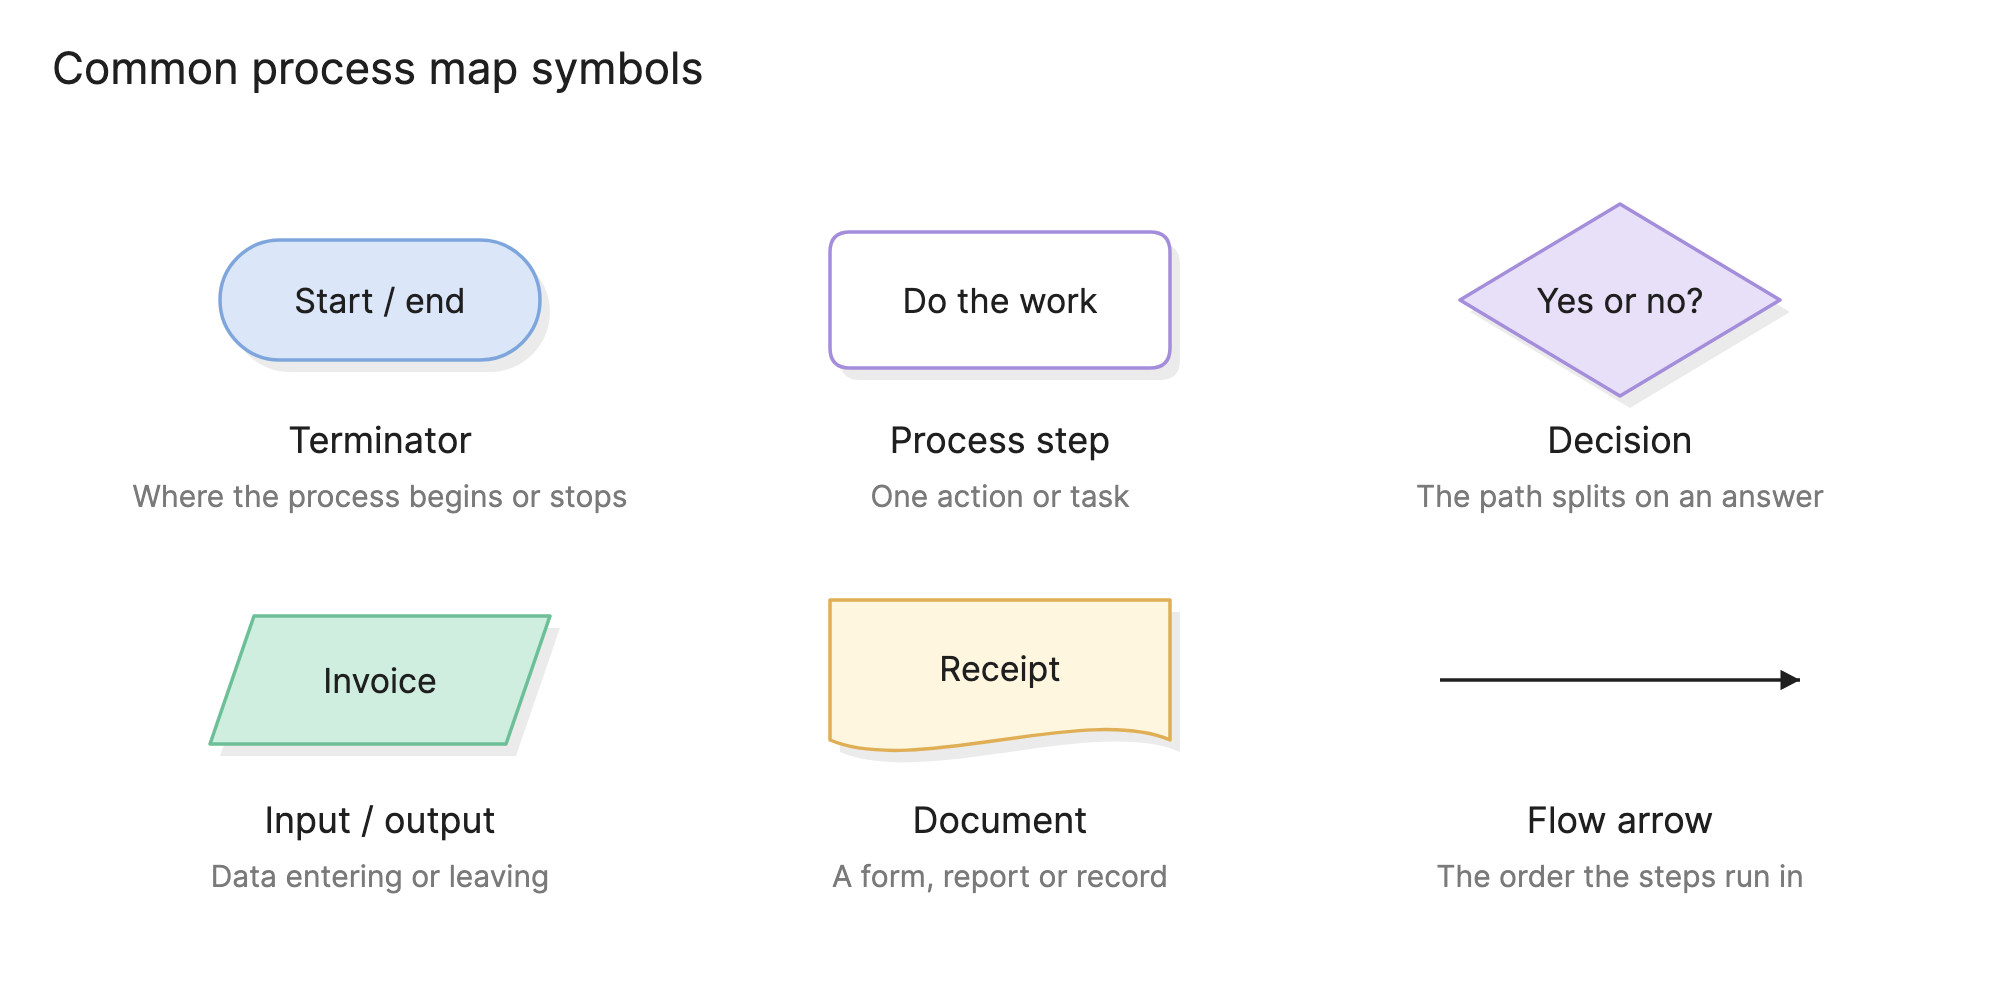
What are the types of process map?
Basic flowchart
A simple sequence of steps and decisions. This is the best choice for a short process or a first draft.
Swimlane map
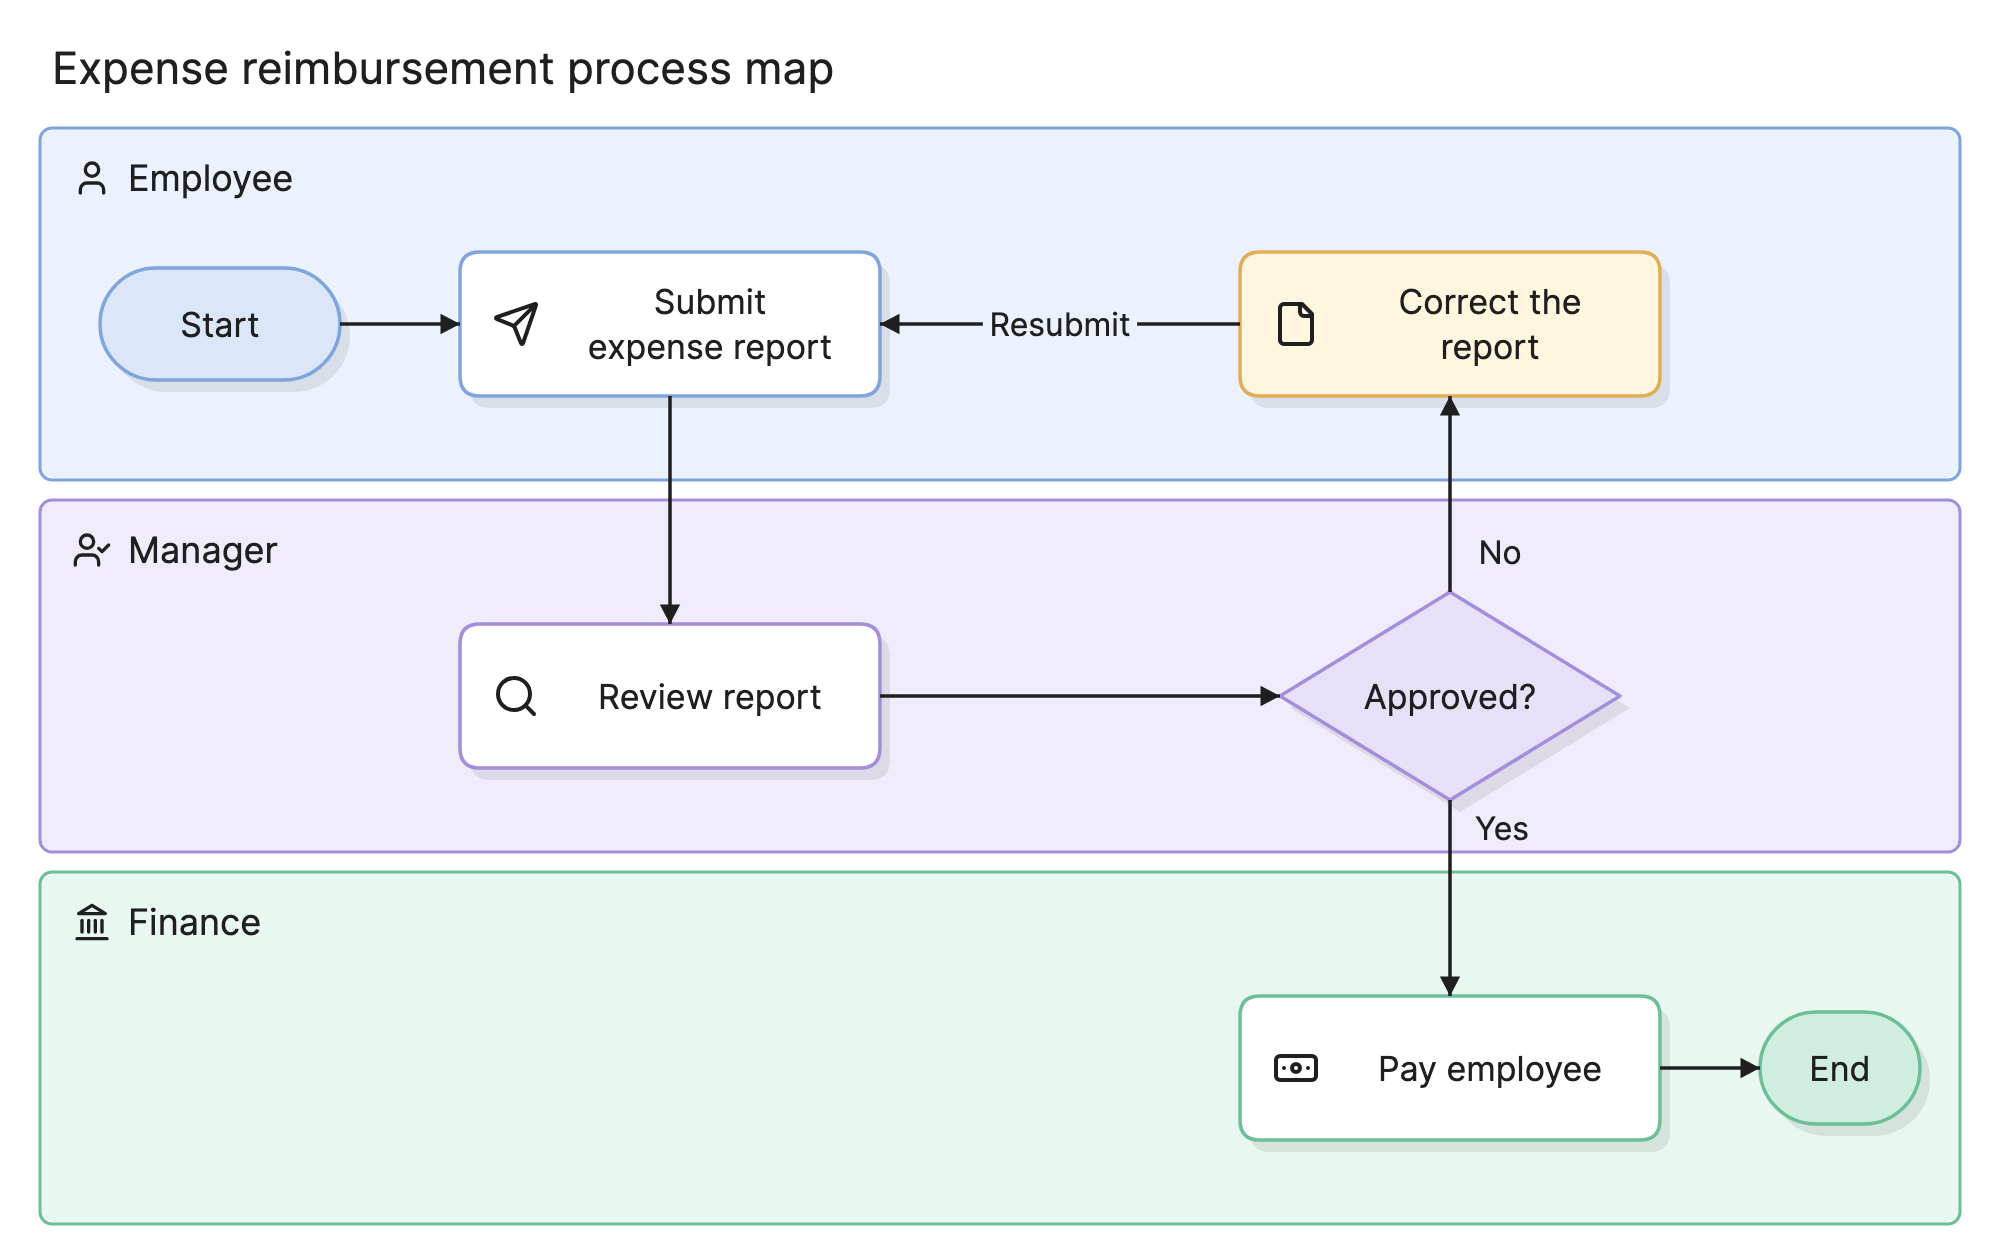
Adds a lane for each role, team or system. Use it when a process crosses teams and you need to see the handoffs. In the expense example above, the loop back from the manager to the employee is where delays are likely to build up.
SIPOC
A high-level table of suppliers, inputs, process, outputs and customers. It is useful for setting the scope of a process before you map the details.
Value stream map
Adds time and flow data to each step, so you can separate work that adds value from waiting. It is common in lean manufacturing and software delivery.
How detailed should a process map be?
Choose the level of detail by what you need the map to do.
| Level | What it shows | Good for |
|---|---|---|
| High level | The 5 to 7 main stages from start to finish | Executives, scoping, and explaining how the work fits together |
| Team level | Steps, decisions and handoffs between roles | Finding bottlenecks and clarifying ownership |
| Task level | Exact actions, systems and exceptions within one stage | Training, audits and automation |
Start at the highest level that answers your question. You can link a step to a more detailed map when someone needs it, rather than putting everything on one page.
How do you read a process map?
Follow the arrows from the start point and notice when the line changes lane. In the expense example at the top of this page, the employee submits a report, and the line crosses into the manager’s lane for review. If the manager approves it, the line continues to finance, which pays the employee and ends the process. If not, it goes back to the employee, who corrects the report and submits it again.
Reading it this way points you straight to the questions worth asking: how long do reports wait for review, how often are they sent back, and could a check at submission catch those errors sooner?
How do you create a process map?
- Set the boundaries. Name the trigger that starts the process and the outcome that ends it.
- Talk to the people doing the work. Written procedures often differ from what really happens.
- List the steps in order. Start each one with a verb, such as “Review report”.
- Add decisions and roles. Show where the path splits and who owns each step.
- Walk through it with the team. Follow a real example from start to finish and fix what does not match.
- Mark what to improve. Note the delays, repeated work and handoffs worth changing.
What are common process mapping mistakes?
- Mapping the ideal process. Document the current state first, or the problems stay hidden.
- Too much detail. If a map no longer fits on a screen, move the detail into a separate map for that sub-process.
- Missing exceptions. Rejections and rework are often where the time goes, so include them.
- Treating it as finished. A process map should change whenever the process does.
What tools can you use to make a process map?
The right tool depends on who needs to take part and how long the map needs to last.
- Sticky notes or a whiteboard. These are hard to beat for a live workshop, since anyone can move a step, but you have to redraw the result somewhere else to keep it.
- Drag-and-drop diagramming tools. These suit polished maps that you plan to maintain, and they often include standard process symbols.
- AI diagramming tools. Tools like Eraser turn a plain-English description into a first draft of a process map that you can keep editing, which is useful when a process is already written down in a procedure or a set of notes.
For more on this kind of diagram, see process flow diagrams.
Frequently asked questions
-
What is the difference between a process map and a flowchart?
A flowchart is a general diagram of steps and decisions, and it can describe anything from an algorithm to a troubleshooting guide. A process map uses the same shapes to document how work moves through a business process, and it usually adds roles, handoffs or measurements.
-
What is the difference between a process map and a data flow diagram?
A process map follows the sequence of work and who does it. A data flow diagram follows the data instead, and it does not show order or decisions.
-
What is a swimlane diagram?
A swimlane diagram is a process map divided into lanes, with one lane for each person, team or system. It makes ownership and handoffs easy to see.
-
What is the difference between process mapping and BPMN?
Process mapping is the general practice of diagramming a process. BPMN, or Business Process Model and Notation, is a formal standard for doing it, with a larger set of defined symbols. Use it when the model needs to be precise or executable.