Diagram types
Entity relationship diagram
An entity relationship diagram (ERD) is a visual model of a database that shows its entities, their attributes and how they relate to each other.
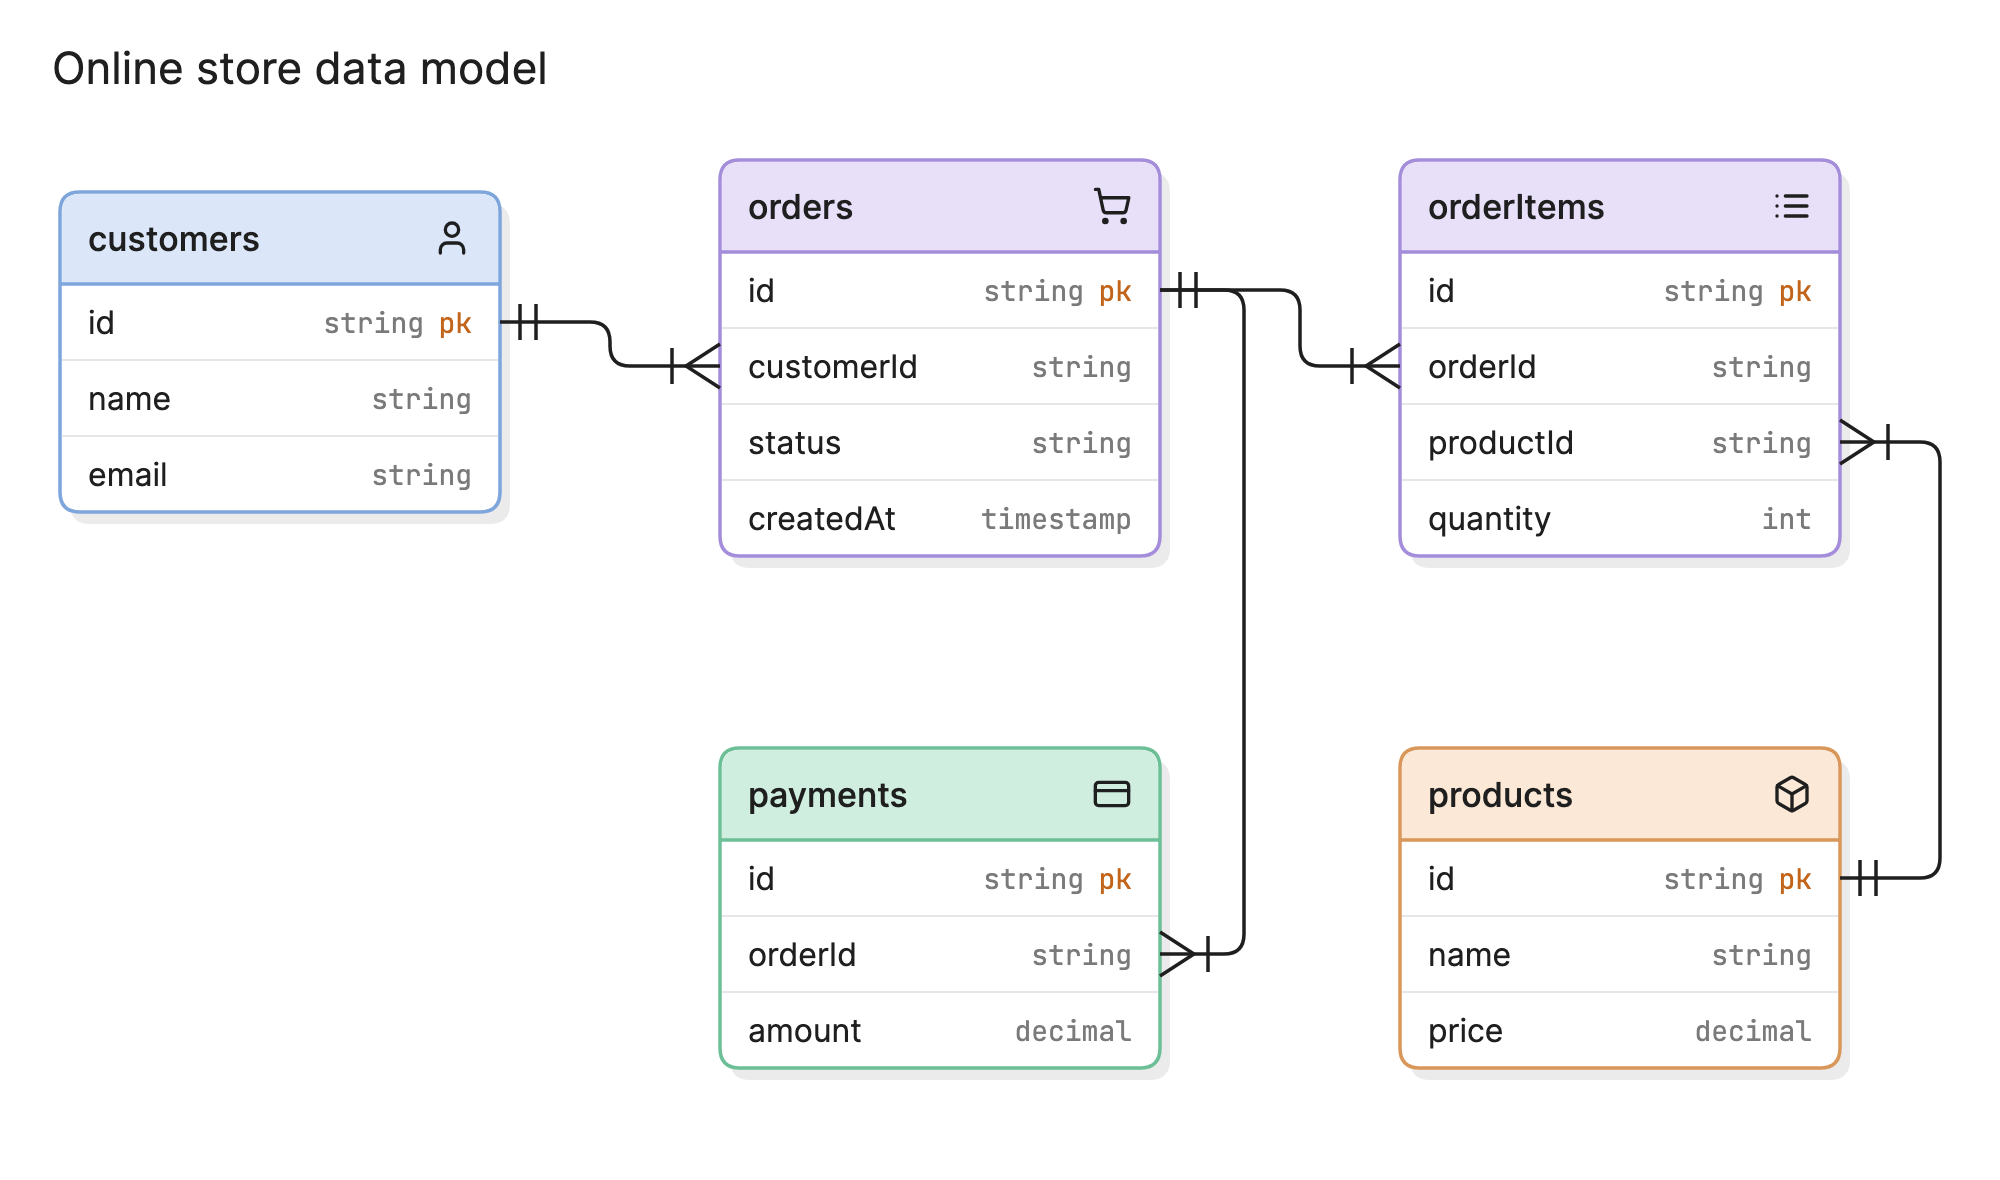
Teams use ERDs to design a database before building it, to explain an existing one and to plan changes to it. Peter Chen introduced the entity-relationship model in a 1976 paper, and the idea still underpins how most relational databases are designed.
When should you use an ERD?
- Designing a new database. Agree on the structure before anyone writes a migration, while changes are still cheap.
- Documenting an existing system. Give engineers and analysts one place to see how the data fits together.
- Planning a schema change. See which tables and relationships a change will affect.
- Debugging data problems. Duplicate records and missing joins are often easier to spot on a diagram.
- Onboarding. Help new team members learn a data model faster than they could by reading table definitions.
What are the parts of an ERD?
An ERD is built from four elements.
Entities
An entity is a thing you store data about, such as a customer, an order or a product. In a physical ERD, each entity is usually a table.
Attributes
Attributes are the properties of an entity. A customer has an ID, a name and an email address. In a database, these become columns.
Keys
A primary key uniquely identifies each record, like customers.id. A foreign key points to a record in another table, like orders.customerId. Keys are what make relationships possible.
Relationships and cardinality
A relationship is the connection between two entities, and cardinality says how many records can sit on each side. One customer can place many orders, but each order belongs to one customer.
What does ERD notation look like?
Crow’s foot is the notation you are most likely to see. Bars mean “one”, the three-pronged foot means “many” and a circle means “zero”, so the ends of a line can be read as a short sentence. Chen notation is another option, often taught in database courses, with rectangles for entities and diamonds for relationships. Some tools simply label each end of the line with 1 or *.
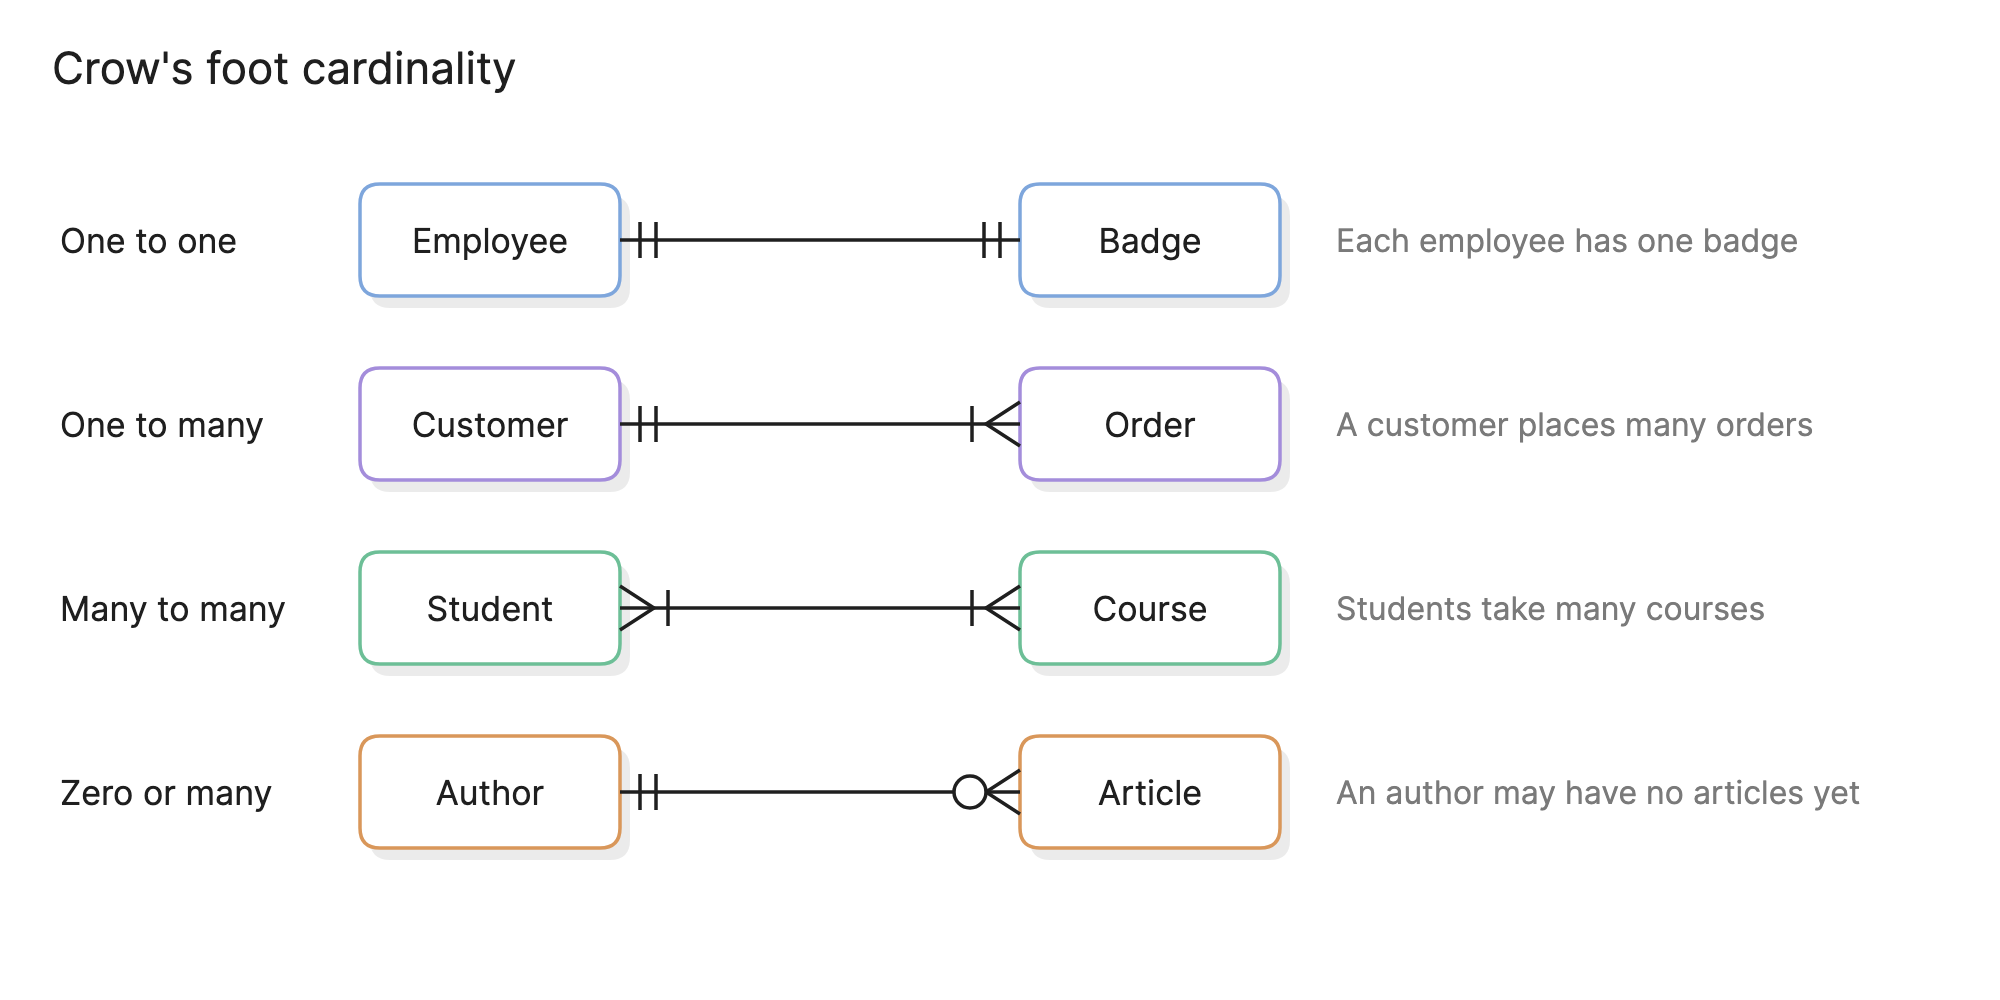
Many-to-many relationships need extra care. A relational database cannot store one directly, so it is split into two one-to-many relationships through a join table. In the online store example, orderItems is that table: it links orders to products and holds the quantity.
What are the types of ERD?
ERDs are usually drawn at one of three levels of detail, and many teams move through them in order as a design firms up.
Conceptual
Shows the main business entities and how they relate, with little or no attribute detail. It is useful for talking through scope with people who do not work in databases.
Logical
Adds attributes, primary keys and foreign keys, and resolves many-to-many relationships. It stays independent of any particular database product.
Physical
Describes how the model is built in a specific database, with real table names, column types, indexes and constraints. The online store example above is close to this level.
How do you read an ERD?
Start with a table you recognize and follow its lines. In the online store example, customers connects to orders with one set of bars at the customer end and a crow’s foot at the order end, so one customer can have many orders, and each order belongs to one customer.
From orders, follow the line to orderItems and then on to products. That path answers a real question: which products were in this order? payments also connects to orders, and its crow’s foot shows that one order can have more than one payment, such as a split payment or a retry.
How does an ERD compare with other diagrams?
| Diagram | What it shows | Use it to answer |
|---|---|---|
| Entity relationship diagram | How stored data is structured | What data do we keep, and how is it related? |
| Data flow diagram | How data moves through a system | Where does this data come from and go? |
| Class diagram | Classes, their methods and how they relate in code | How is this code organized? |
| Database schema | The exact definition of a database | What does the database actually contain? |
How do you create an ERD?
- List the entities. Pull the nouns from your requirements, such as customer, order and product.
- Add attributes and keys. Give each entity a primary key and the fields it needs.
- Draw the relationships. Connect related entities through their foreign keys.
- Set the cardinality. Decide whether each relationship is one-to-one, one-to-many or many-to-many, and add join tables where needed.
- Review it against real questions. Check that the model can answer what the product needs to ask, such as “which orders has this customer placed?”
What are common ERD mistakes?
- Too much on one diagram. Split large schemas by domain, so that each diagram tells one story.
- Unresolved many-to-many relationships. If you are modeling a real database, show the join table.
- Inconsistent naming. Mixing
customer_idandcustomerIdmakes a model harder to trust. - Letting the diagram go stale. An ERD that no longer matches the database misleads whoever reads it next. Update it as part of each schema change.
What tools can you use to create an ERD?
Most teams use one of three approaches.
- Database tools. Many can draw an ERD from an existing schema. This is accurate and quick for documenting what exists, but less useful for designing something new, and large schemas can come out cluttered.
- Drag-and-drop diagramming tools. These give you full control over the layout, but you have to update the diagram by hand each time the schema changes.
- Diagram-as-code and AI tools. Tools like Eraser turn a plain-English description or code snippet into an ERD you can keep editing, or let you write one in diagram-as-code, so the source can sit next to your code.
To see a larger model, look at this banking application data model.
Frequently asked questions
-
What does ERD stand for?
ERD stands for entity relationship diagram. You may also see it called an ER diagram or an ER model.
-
What is the difference between an ERD and a database schema?
A schema is the actual definition of a database: its tables, columns, types and constraints. An ERD is a picture of that structure. A physical ERD maps closely to a schema, while a conceptual ERD can exist before any schema does.
-
What is the difference between an ERD and a data flow diagram?
An ERD shows how data is structured. A data flow diagram shows how data moves between processes, stores and outside systems. Many teams draw both for the same system.
-
Can you generate an ERD from an existing database?
Yes. Many database tools can read an existing schema and draw the tables and foreign keys for you. It is a quick way to document a database, but you still need to judge the result, since a database does not always declare every relationship as a foreign key.