Data
Star schema
A star schema is a data model with a central fact table of measurements joined to dimension tables that describe them, designed for fast analytical queries.
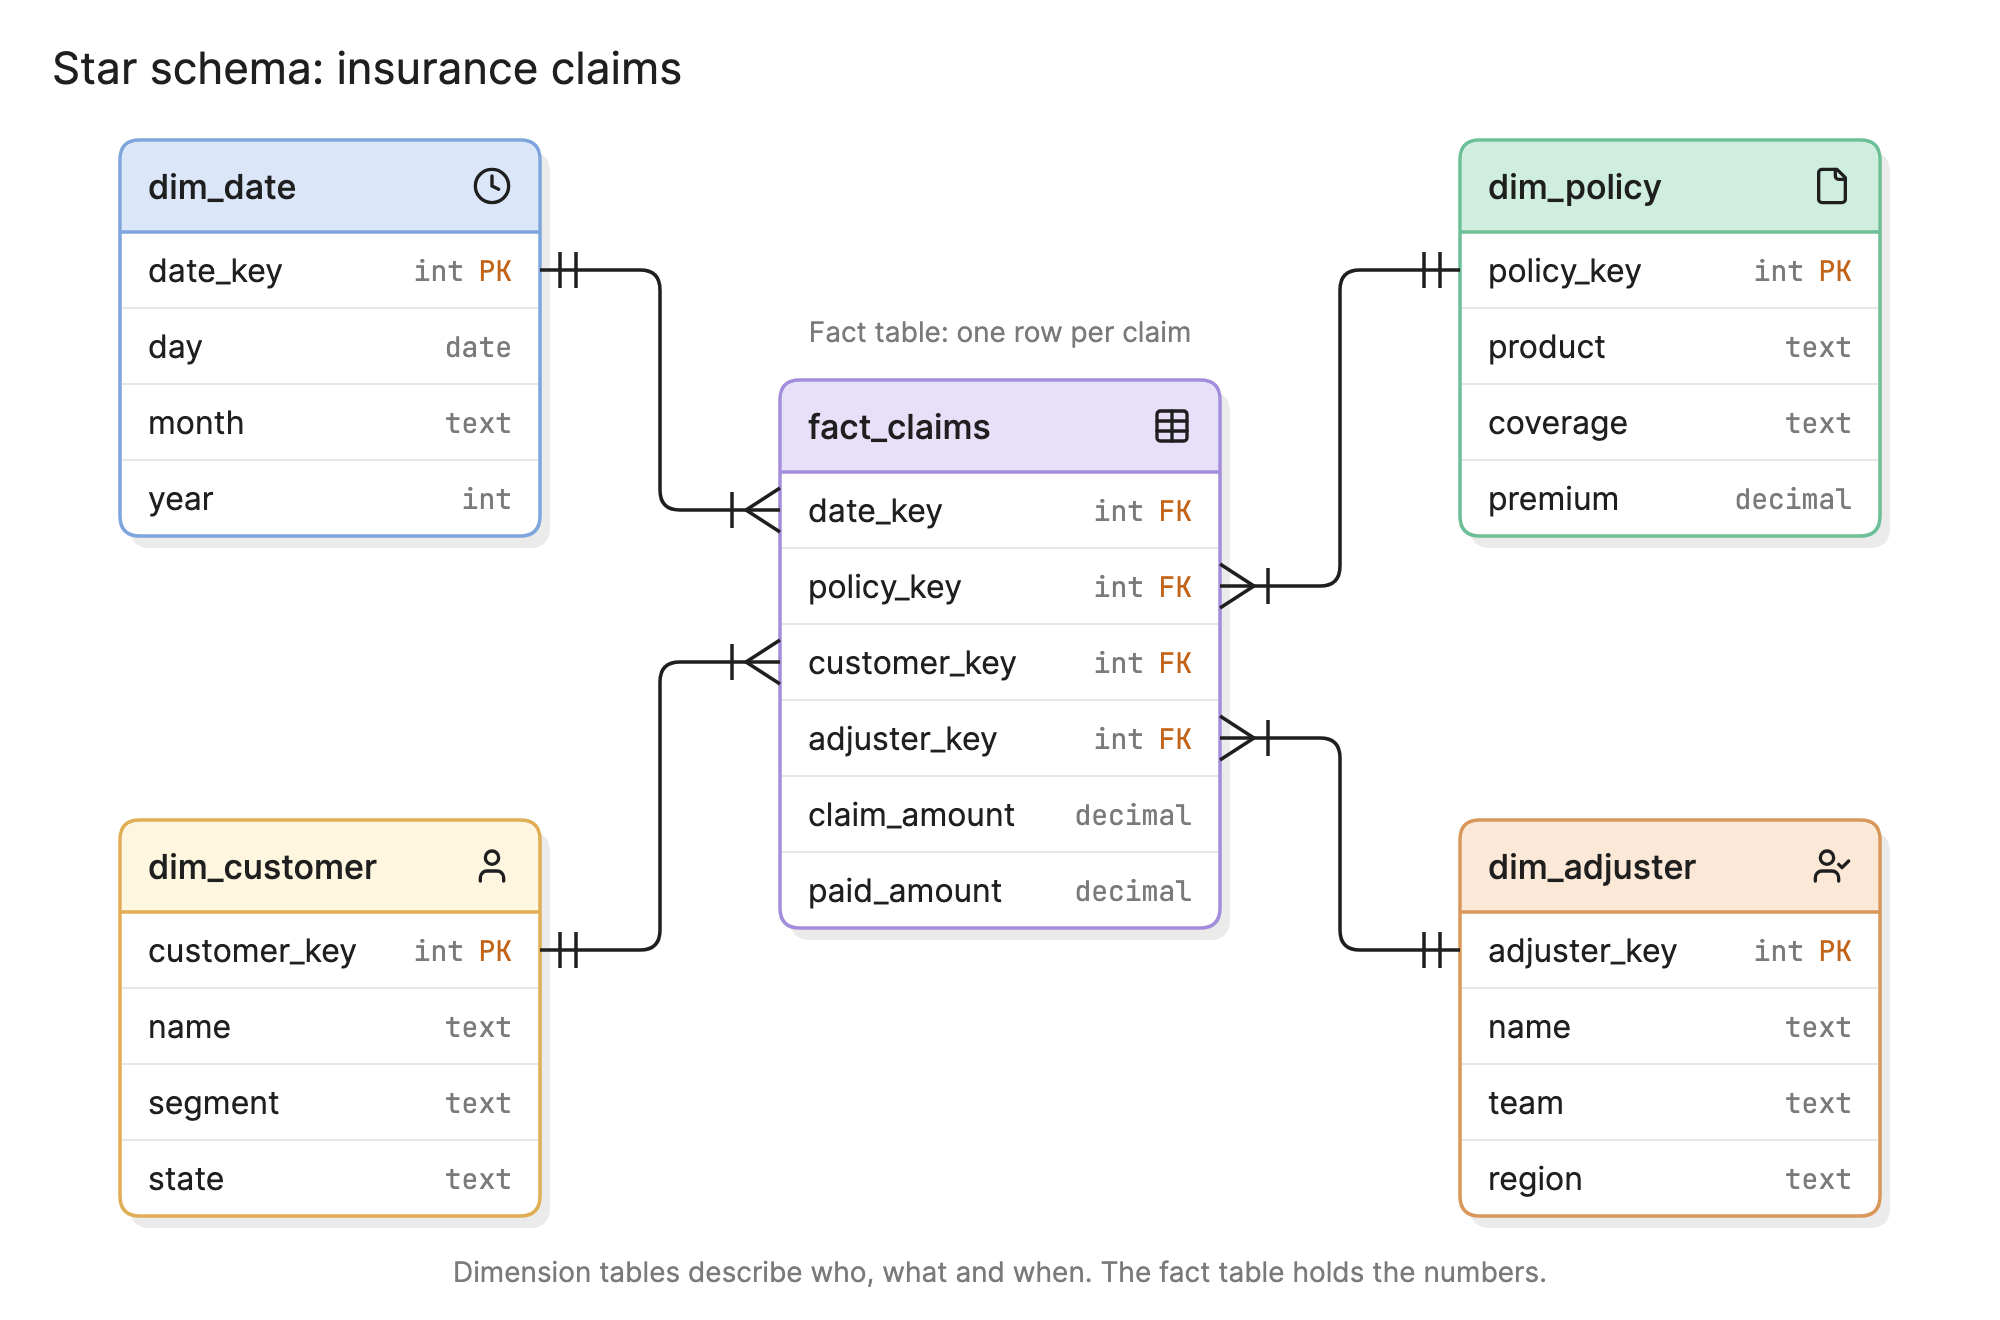
Teams model data as a star schema because the questions a business asks share a shape: a number, such as revenue or claims paid, sliced by the things that describe it, such as date, product and customer. A star schema stores the data in exactly that shape, so the query is as simple as the question.
What are the parts of a star schema?
- Fact table. The center of the star. It has one row per event, with the numbers that were measured and a key to each dimension.
- Grain. What one row of the fact table means, stated in a sentence: one row per claim, or one row per order line. Every other decision follows from it.
- Measures. The numeric columns in the fact table, such as quantity, revenue or paid amount. Most can be summed across any dimension.
- Dimension tables. The points of the star. Each has one row per date, product, customer or other thing you group and filter by, with descriptive columns.
- Surrogate keys. Integer keys the warehouse generates for each dimension row. They keep facts stable when a source system changes its own ids and make it possible to keep history.
- Conformed dimensions. Dimensions such as date and customer that several fact tables share, so numbers from different stars can be compared.
How do you read a star schema diagram?
Start in the middle of the diagram at the top of this page. fact_claims holds one row per insurance claim. It has two measures, claim_amount and paid_amount, and four foreign keys.
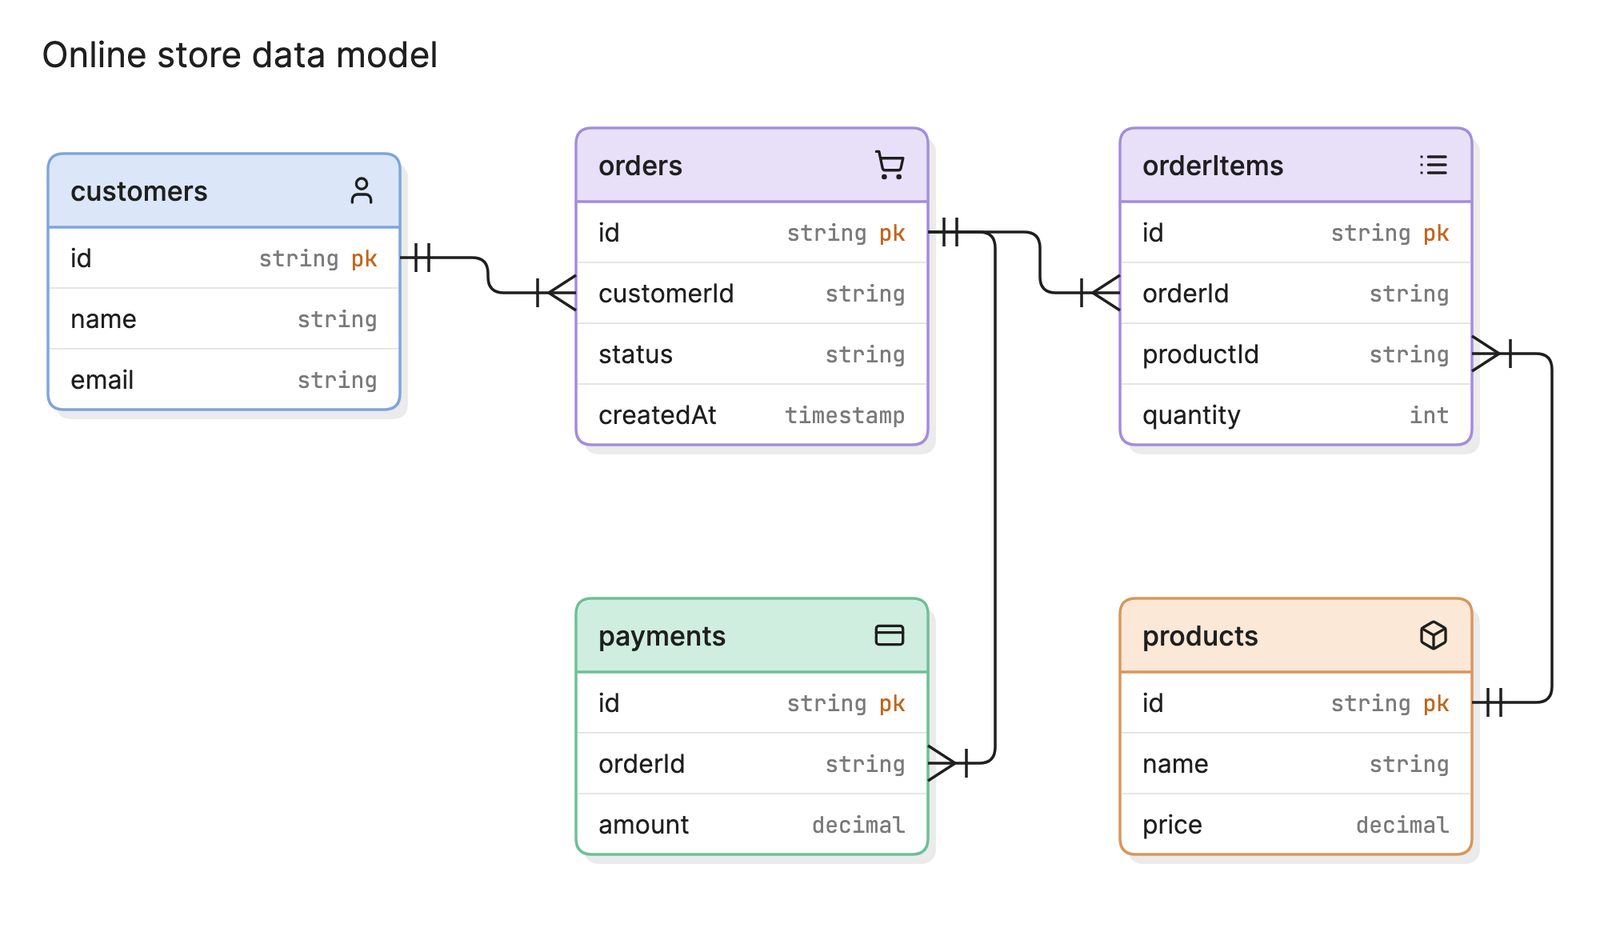
Each key leads to a dimension. dim_date says when the claim was filed, dim_policy which product and coverage it was made against, dim_customer who made it and dim_adjuster who handled it. The crow’s foot on each line sits at the fact table, because one dimension row matches many facts. The notation is the same as an entity relationship diagram.
Now ask a question: paid amount by product by month. The query joins the fact table to dim_policy and dim_date, groups by product and month and sums one column. Two joins and one sum, however many rows the fact table has. Any other slicing of the same numbers works the same way.
How does a star schema compare with a snowflake schema?
| Star schema | Snowflake schema | |
|---|---|---|
| Dimensions | One flat table each | Split into linked tables |
| Joins per query | Few | More |
| Repeated values | Category and department repeat on every product row | Each value is stored once |
| Easier for | Analysts and BI tools | Maintaining large hierarchies |
| Use it when | Almost always | A dimension is very large or its hierarchy is shared |
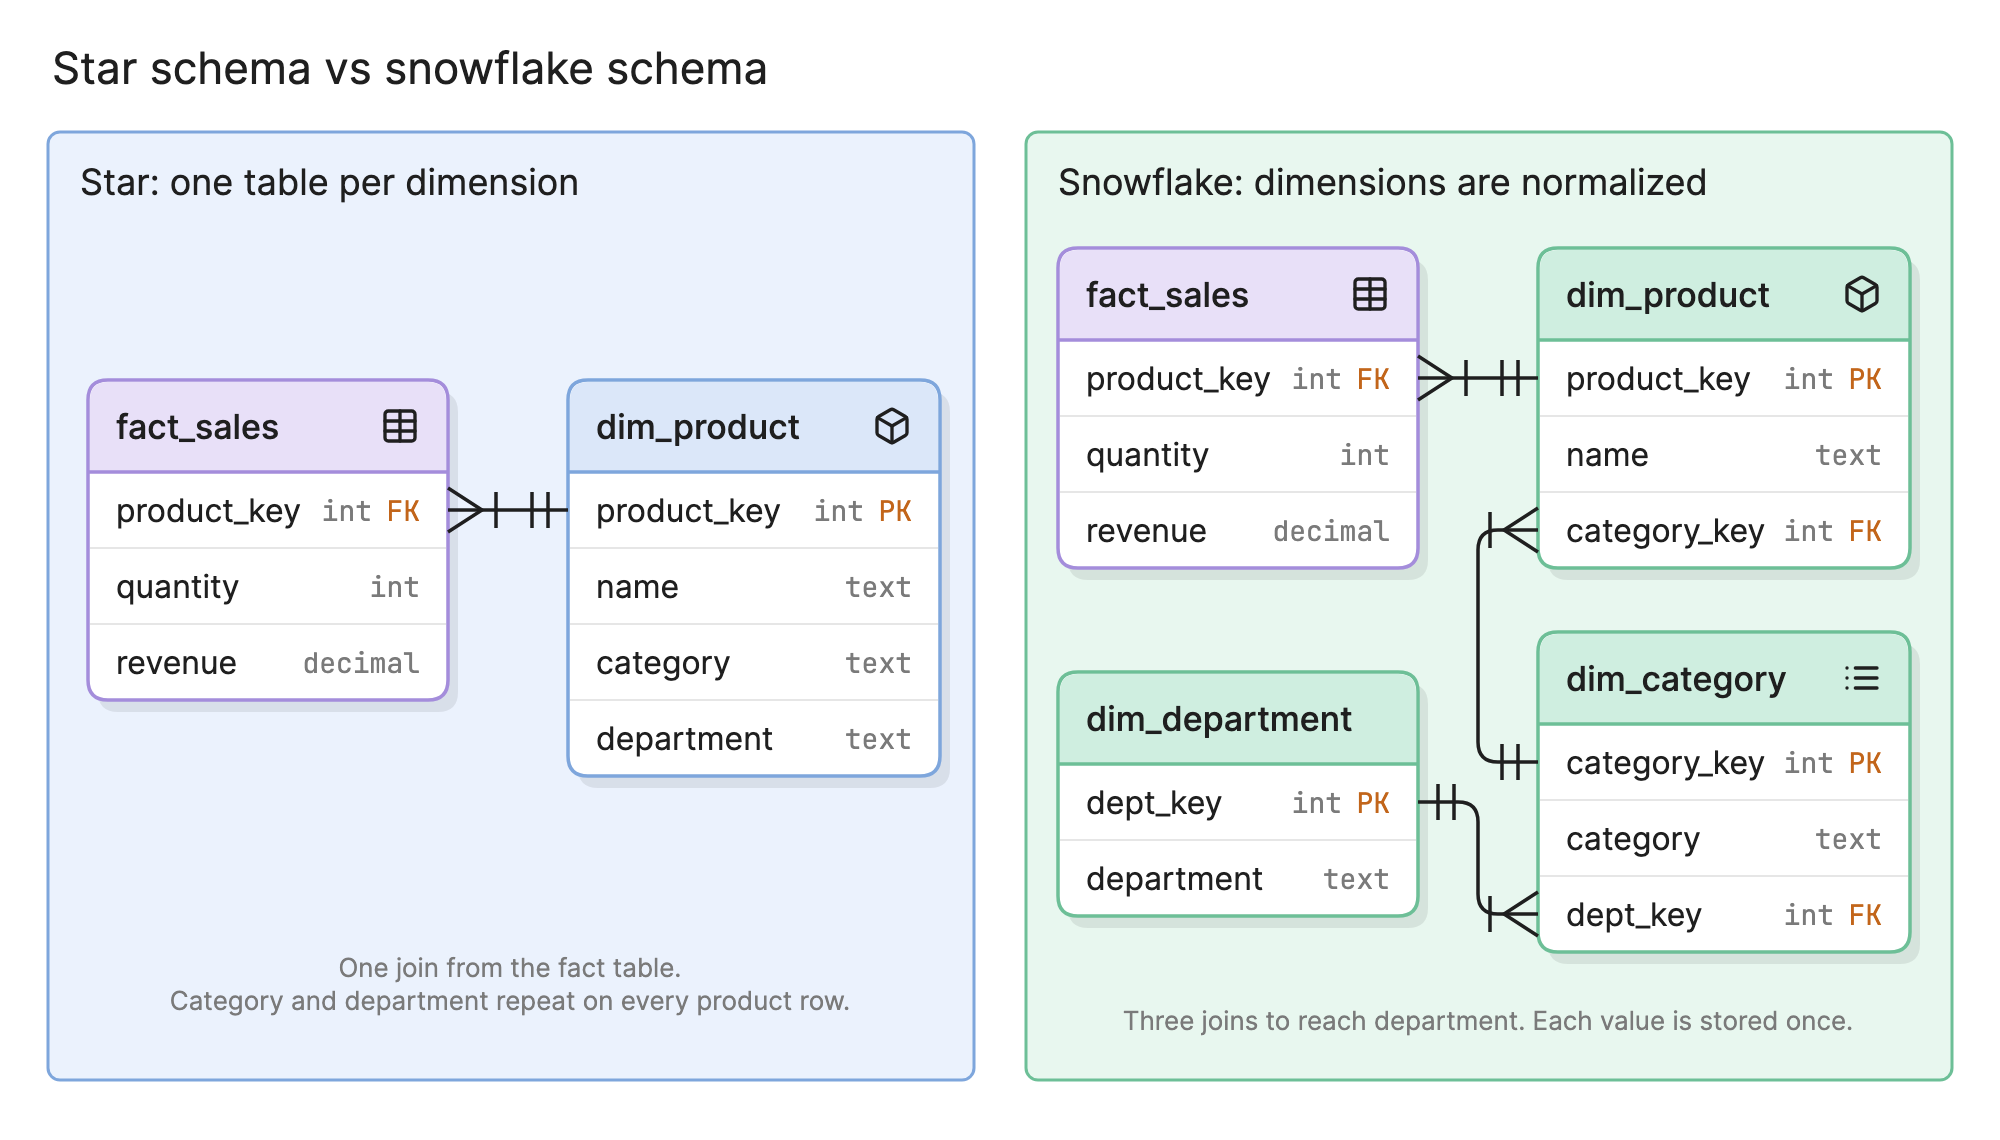
In the figure, the star keeps category and department as columns on dim_product. The snowflake moves them into dim_category and dim_department, so reaching the department takes three joins instead of one. Storage is rarely the constraint on a modern warehouse, which is why most teams stay with the star.
What are the types of fact table?
| Type | One row per | Example |
|---|---|---|
| Transaction | Event | Each claim payment |
| Periodic snapshot | Thing per period | Each policy’s balance at month end |
| Accumulating snapshot | Process, updated as it moves on | Each claim from filed to closed |
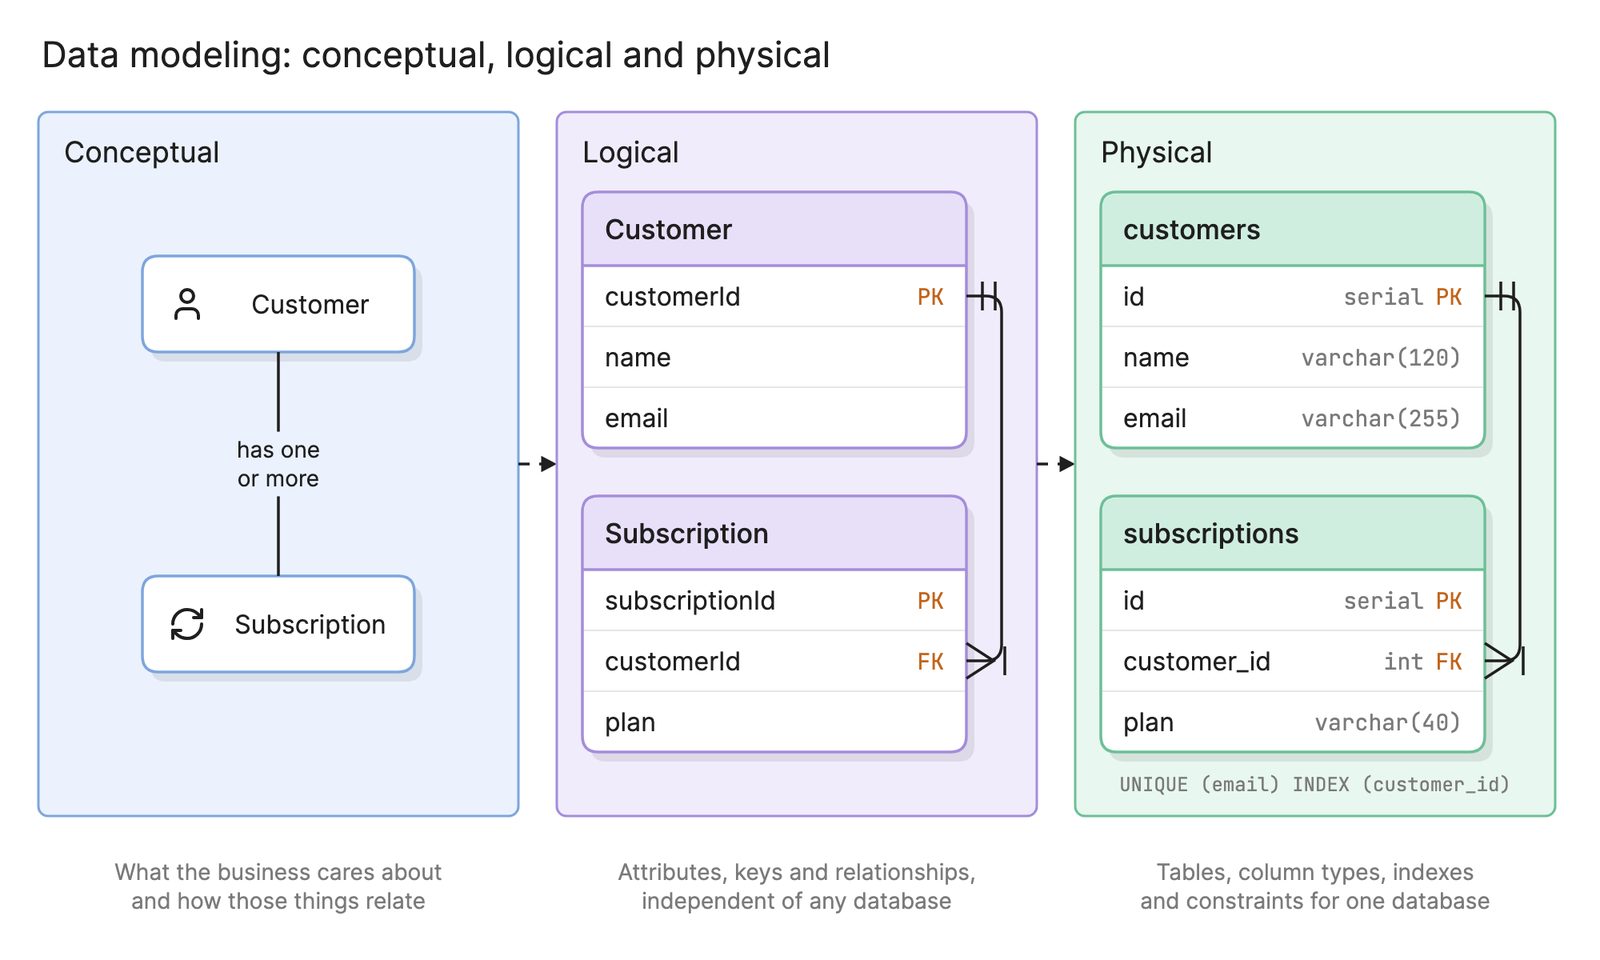
A transaction fact table is the default. Add a snapshot when people need a balance at a point in time and not the events that led to it. All three sit in the same star shape. A star schema is deliberately denormalized compared with an application’s database schema, which is designed for fast, safe writes. Data modeling covers the difference between the two.
How do you design a star schema?
- Pick the business process. Claims, orders, shipments: one process per fact table.
- Declare the grain. Write the sentence that says what one row is, and do not mix levels of detail.
- Choose the dimensions. Who, what, where and when, for an event at that grain.
- Choose the facts. The numeric measures that are true at that grain.
- Add surrogate keys and a date dimension. Almost every fact table needs both.
- Decide how each dimension changes. Overwrite the value or keep its history, attribute by attribute.
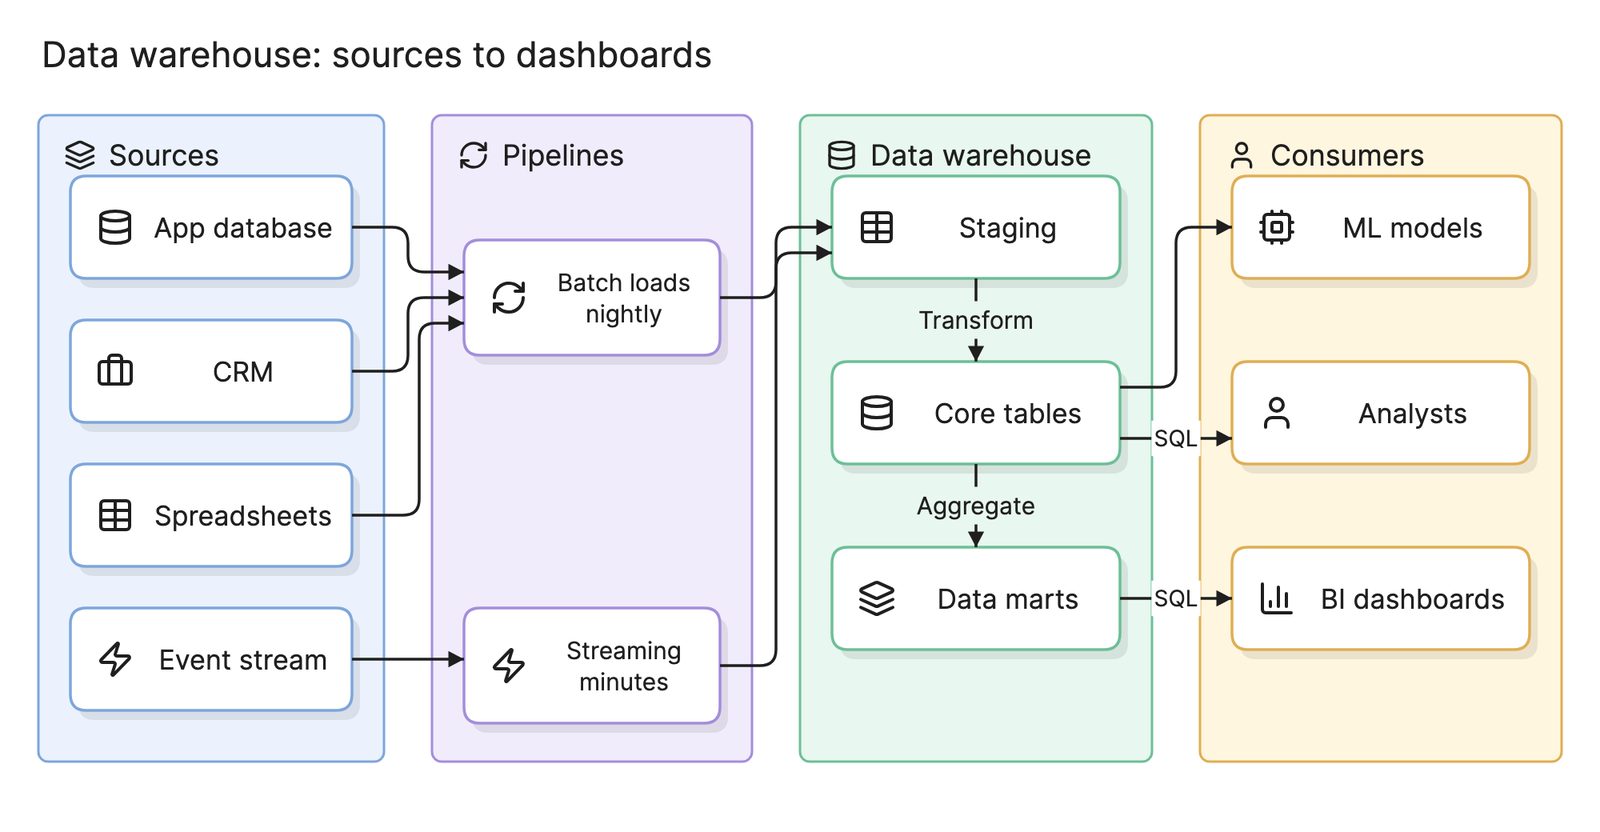
- Draw it and review it. Show the diagram to the people who will query it before loading a row. The result usually becomes a data mart in the data warehouse.
What are common star schema mistakes?
- Mixed grain. Order totals and order lines in one fact table double-count as soon as someone sums a column.
- Snowflaking by habit. Normalizing dimensions the way an application would adds joins and saves little.
- Source ids as keys. When the source system reuses or changes an id, history breaks. Use surrogate keys.
- Text in the fact table. Descriptions belong in dimensions, where they are stored once and can be filtered.
- A star per report. If every team builds its own customer dimension, no two dashboards agree.
- No date dimension. Filtering on raw timestamps makes fiscal periods and holidays every analyst’s problem.
What tools can you use to make a star schema?
- Transformation frameworks. SQL model tools that build fact and dimension tables in dependency order and test keys for uniqueness and missing references.
- Data modeling tools. Dedicated modelers that manage keys, history and naming standards across many stars.
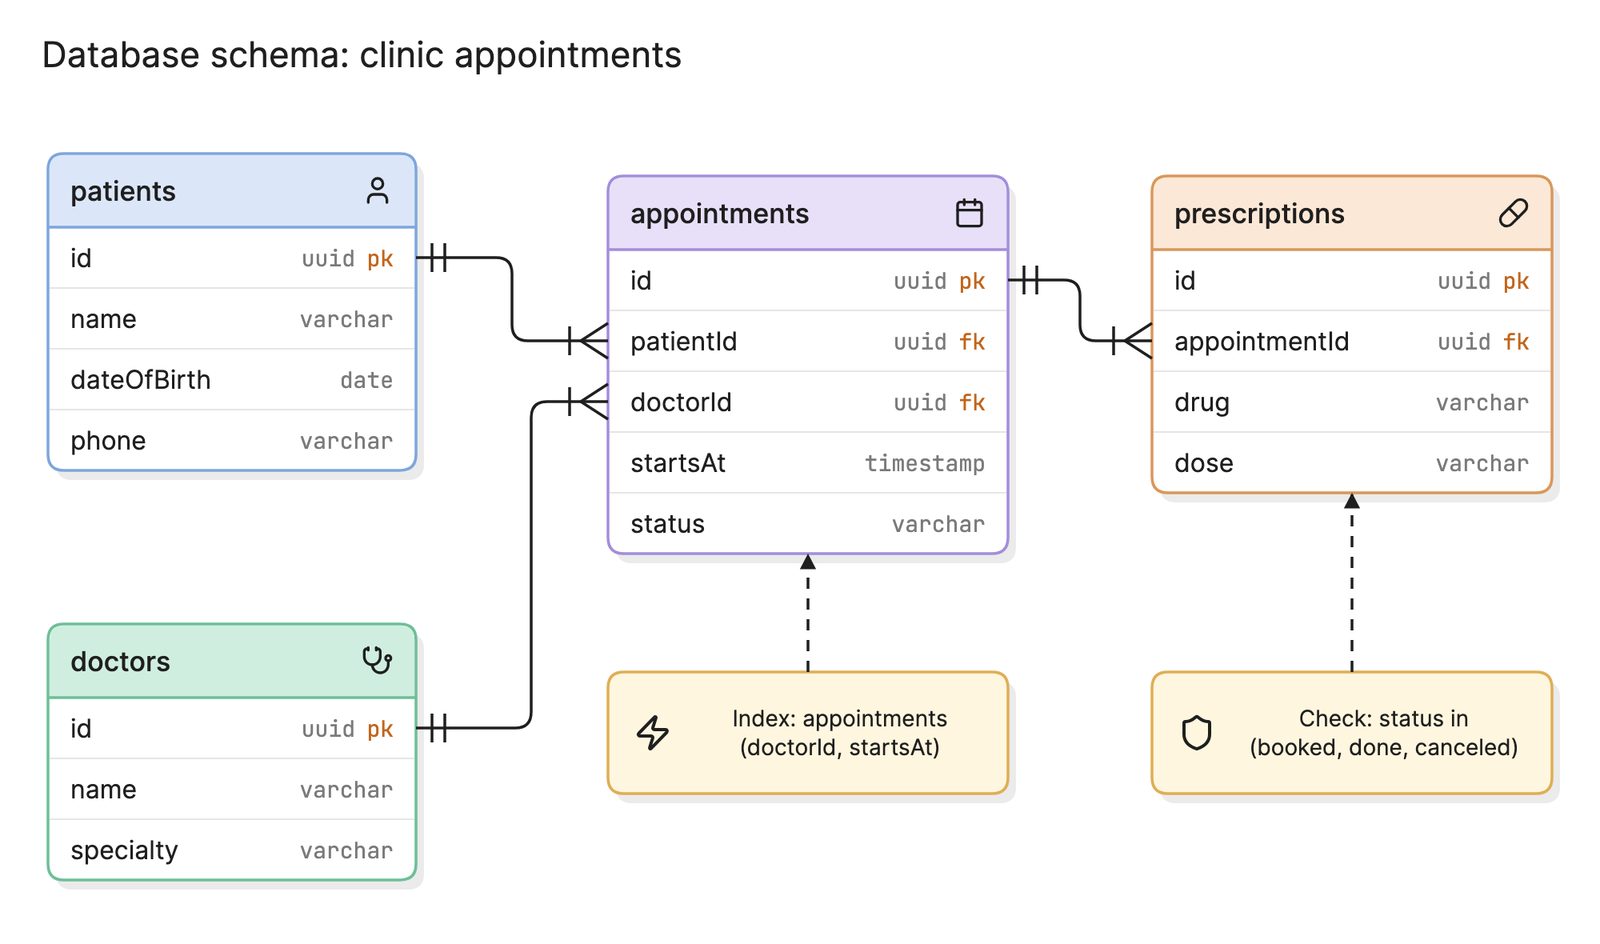
- AI diagramming tools. Tools like Eraser turn a list of tables or a block of SQL into an entity relationship diagram or a database schema diagram you can keep editing as text, which makes the design easy to review before it is built.
For more on this kind of diagram, see data models.
Frequently asked questions
-
What is the difference between a star schema and a snowflake schema?
In a star schema each dimension is one flat table. In a snowflake schema the dimensions are normalized into chains of linked tables, such as product, category and department. Snowflaking stores each value once and suits very large or shared hierarchies, but every query needs more joins. Star is the usual default.
-
What is the difference between a fact table and a dimension table?
A fact table has one row per event, such as a sale or a claim, with numeric measures and a foreign key to each dimension. It is long and narrow. A dimension table has one row per thing you group by, such as a product or a customer, with descriptive columns. It is short and wide.
-
What is a slowly changing dimension?
It is a dimension whose attributes change over time, such as a customer who moves to another state. A Type 1 change overwrites the old value and loses the history. A Type 2 change adds a new row with validity dates, so older facts still point to the value that was true at the time.
-
Is a star schema still relevant on a cloud data warehouse?
Yes. Columnar engines made wide flat tables faster than they once were, but a star schema still gives every report the same definitions, lets several fact tables share dimensions and matches what BI tools expect. Many teams keep star schemas in the gold layer of a medallion architecture.