Diagram types
Fishbone diagram
A fishbone diagram, also called an Ishikawa or cause-and-effect diagram, lays out the possible causes of a problem by category to help find the root cause.
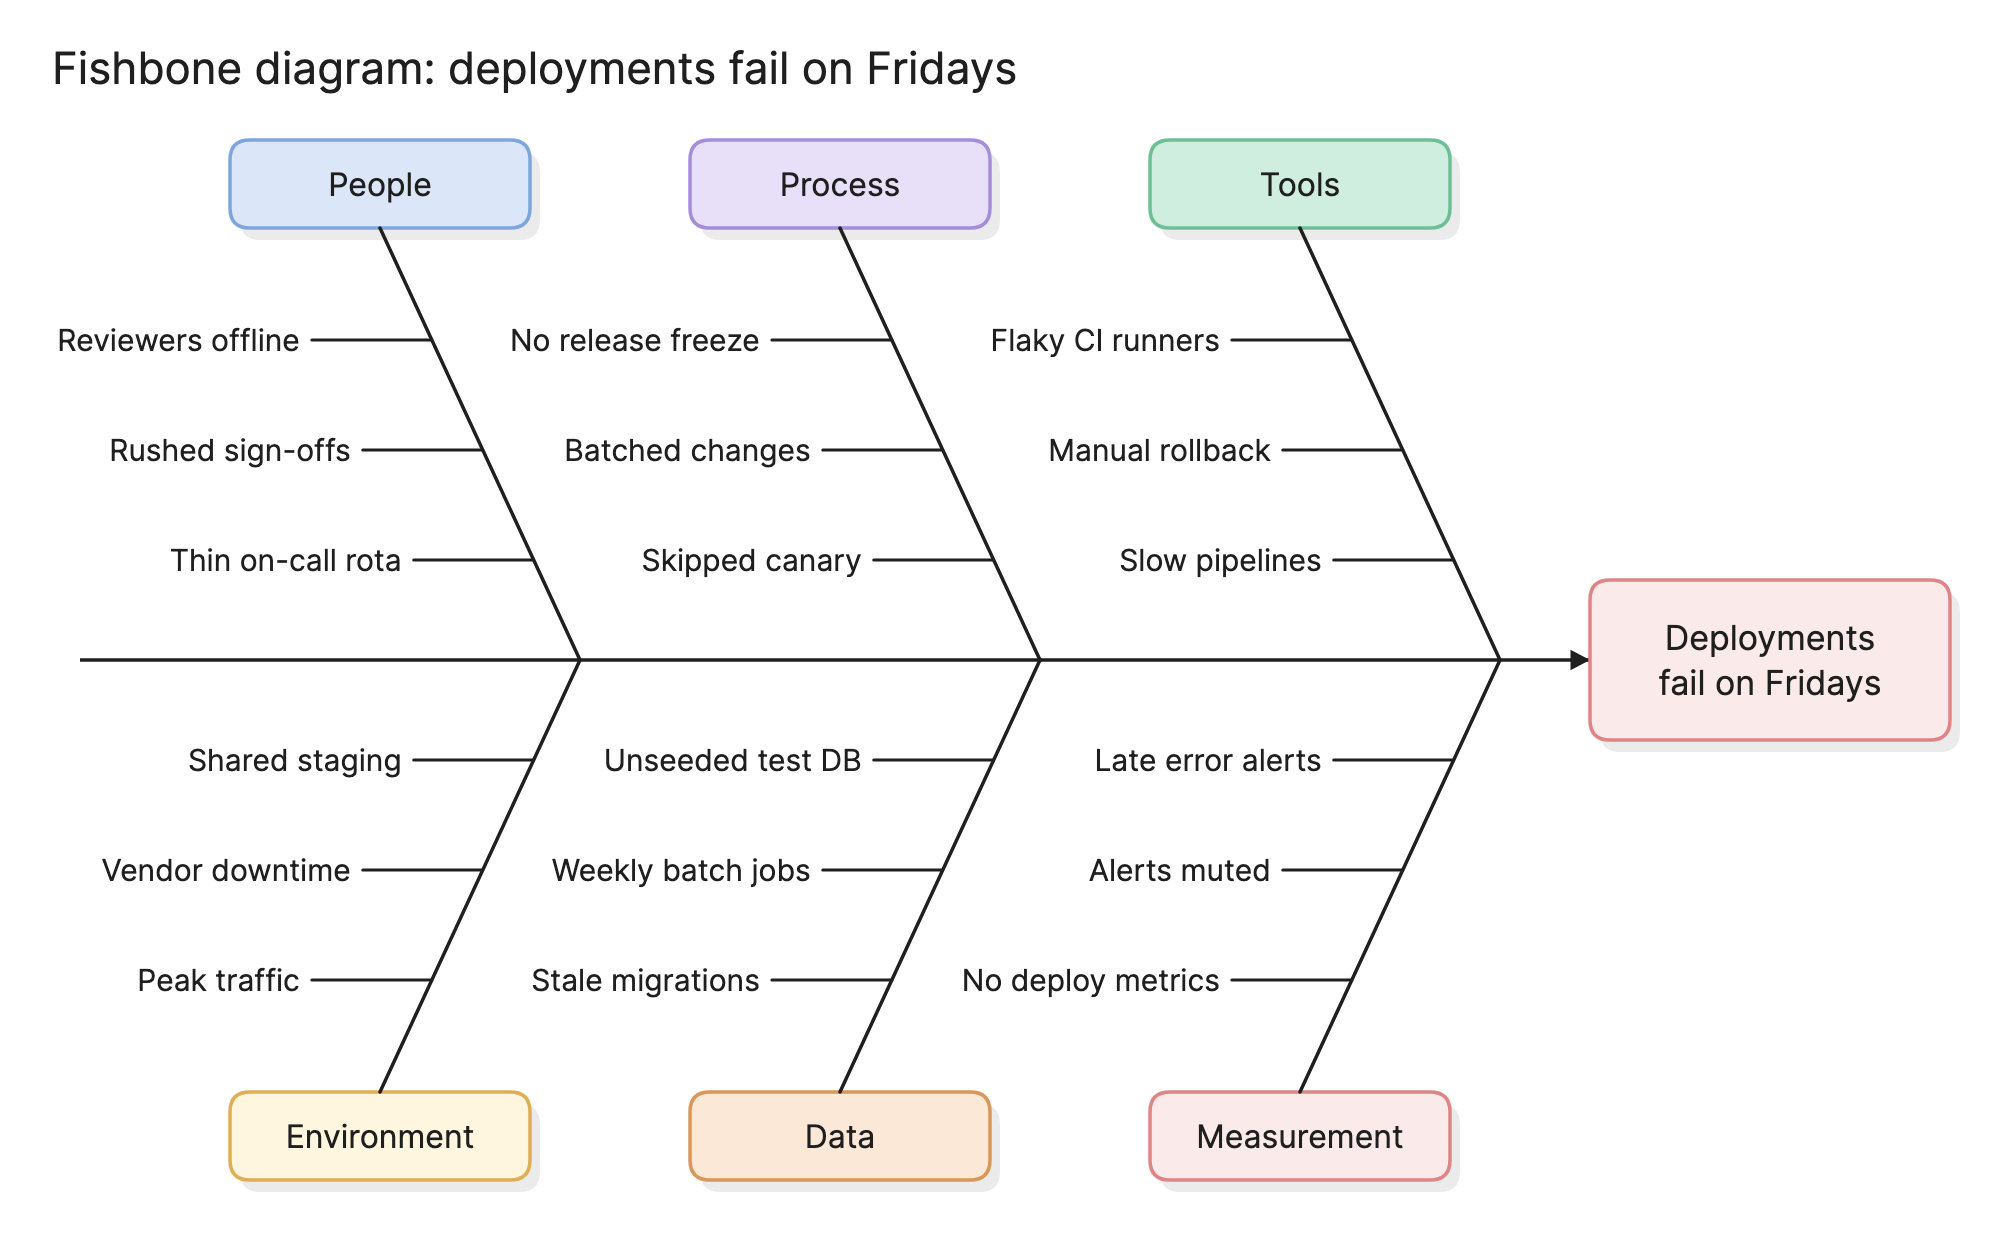
Teams use fishbone diagrams in post-mortems and quality reviews to stop the discussion from jumping to the first explanation that comes up. Laying every plausible cause out by category makes the gaps visible and gives the group something concrete to vote on.
When should you use a fishbone diagram?
- Running a post-mortem. After an incident, collect the contributing causes before deciding which ones to fix.
- Investigating a recurring problem. When the same failure keeps coming back, the diagram shows whether the fixes so far have all been in one category.
- Explaining a metric that moved. A drop in conversion or a rise in support tickets usually has several candidate causes, and this is a way to list them without arguing about each one.
- Starting a quality improvement project. The diagram defines the territory before the team gathers data.
What are the parts of a fishbone diagram?
Head
The problem statement, written as an effect the team can observe, such as “Deployments fail on Fridays” or “High checkout abandonment”. A vague head, like “Reliability”, produces a vague diagram.
Spine
The horizontal line running into the head. It carries nothing itself but organizes the bones.
Bones
The major categories of cause, drawn as diagonal lines off the spine. Six is typical. The categories are prompts for brainstorming rather than conclusions, so pick ones that fit the problem.
Causes
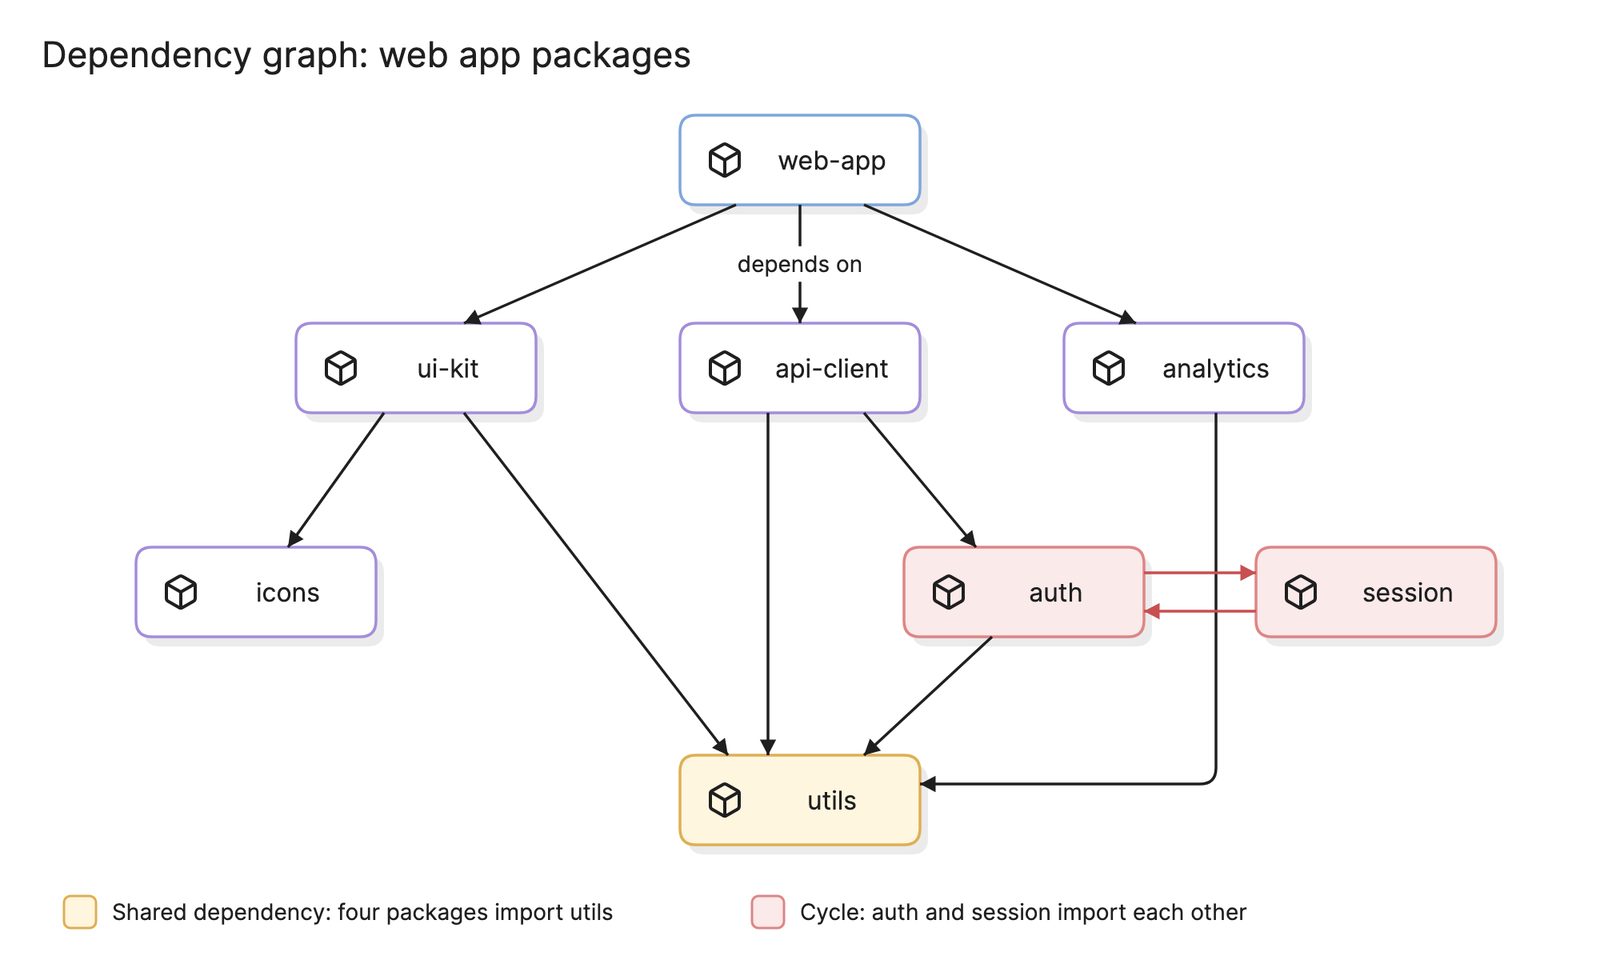
Short horizontal lines off each bone, each naming one possible cause. A cause can have sub-causes branching off it, which is where the diagram starts to resemble a dependency graph.
What categories does a fishbone diagram use?
The right categories depend on the domain. These are the common sets.
| Set | Categories | Used in |
|---|---|---|
| 6 Ms | Manpower, method, machine, material, measurement, mother nature | Manufacturing |
| 4 Ss | Surroundings, suppliers, systems, skills | Service industries |
| 8 Ps | Product, price, place, promotion, people, process, physical evidence, performance | Marketing and sales |
| Software | People, process, tools, environment, data, measurement | Engineering and operations |
The software set is the one used in the example above. The important thing is that the categories are different from each other and together cover everything the team can think of. If a cause fits two bones, put it on one and move on.
How do you read a fishbone diagram?
Read the head first, then scan the bones. In the deployment example, the problem is that deployments fail on Fridays. Under People, the team listed reviewers being offline, rushed sign-offs and a thin on-call rota. Under Process, there is no release freeze, changes are batched and the canary stage is skipped. Tools holds flaky CI runners, manual rollback and slow pipelines.
Below the spine, Environment points at peak traffic, vendor downtime and a shared staging environment. Data lists stale migrations, weekly batch jobs and an unseeded test database. Measurement notes that there are no deploy metrics, alerts are muted and error reports arrive late.
The diagram does not say which cause is responsible. It does show the shape of the team’s thinking: three bones describe things that differ on Fridays, a strong hint about where to collect data first, while the Measurement bone explains why the problem has been hard to see.
How do you create a fishbone diagram?
- Write the problem statement. Describe the effect, with a measure if you have one, and put it in the head.
- Choose the categories. Start from one of the standard sets and adapt it. Four to six bones is the usual range.
- Brainstorm causes. Go bone by bone and ask “why does this category contribute?” Record every answer without debating it.
- Add sub-causes. For any cause that is still broad, ask why again and branch off it. This is where a 5 whys exercise fits.
- Pick the causes to investigate. Vote, or use data you already have, to choose two or three to test.
- Verify before fixing. Collect evidence that a chosen cause really drives the effect. A fishbone diagram lists hypotheses, not findings.
What are common fishbone diagram mistakes?
- A vague head. “Quality is poor” cannot be investigated. “Defect rate doubled since March” can.
- Treating causes as conclusions. Everything on the diagram is a guess until data backs it up.
- Stopping at the first level. “Flaky CI” is a symptom. Branch off it until you reach something a person can change.
- Blaming people. A cause written as “Carelessness” ends the conversation. Ask what about the process made the mistake easy.
- Keeping it as a wall chart. The diagram is a working document. Record which causes were tested, what was found and what was fixed.
How does a fishbone diagram compare with other tools?
| Tool | What it does | Use it when |
|---|---|---|
| Fishbone diagram | Collects possible causes of one effect by category | You want breadth before depth |
| 5 whys | Chases one cause back to its root | You have a likely cause and need to go deeper |
| Pareto chart | Ranks causes by how often they occur | You have data on cause frequency |
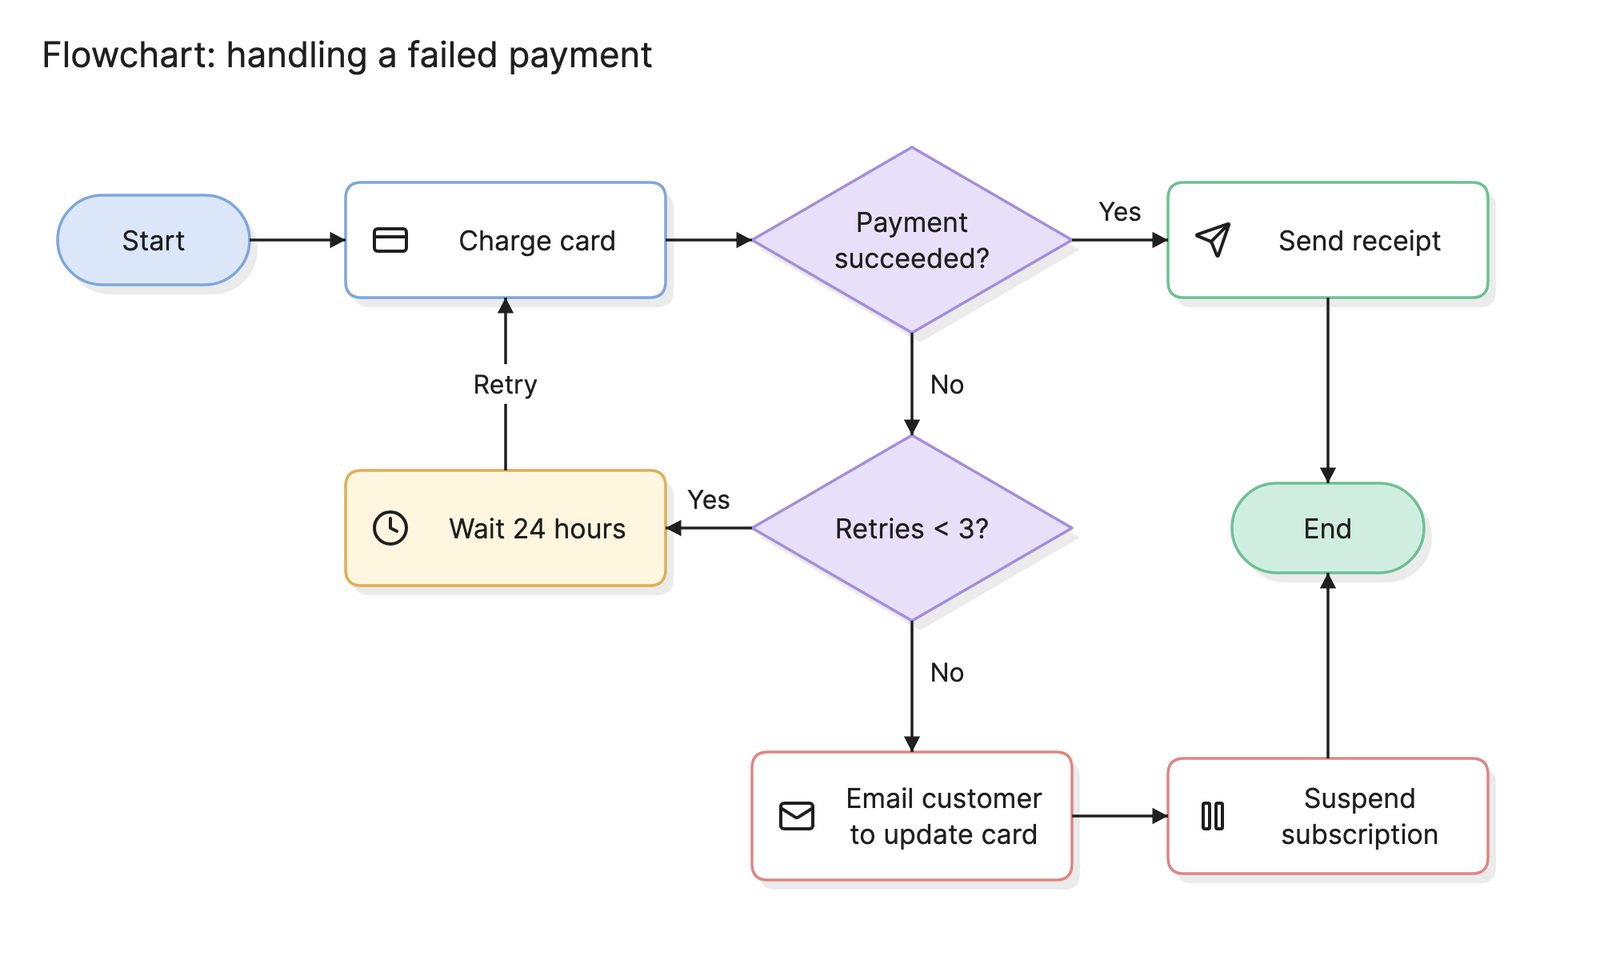
| Flowchart | Shows the steps of a process in order | The problem is likely to live in a specific step |
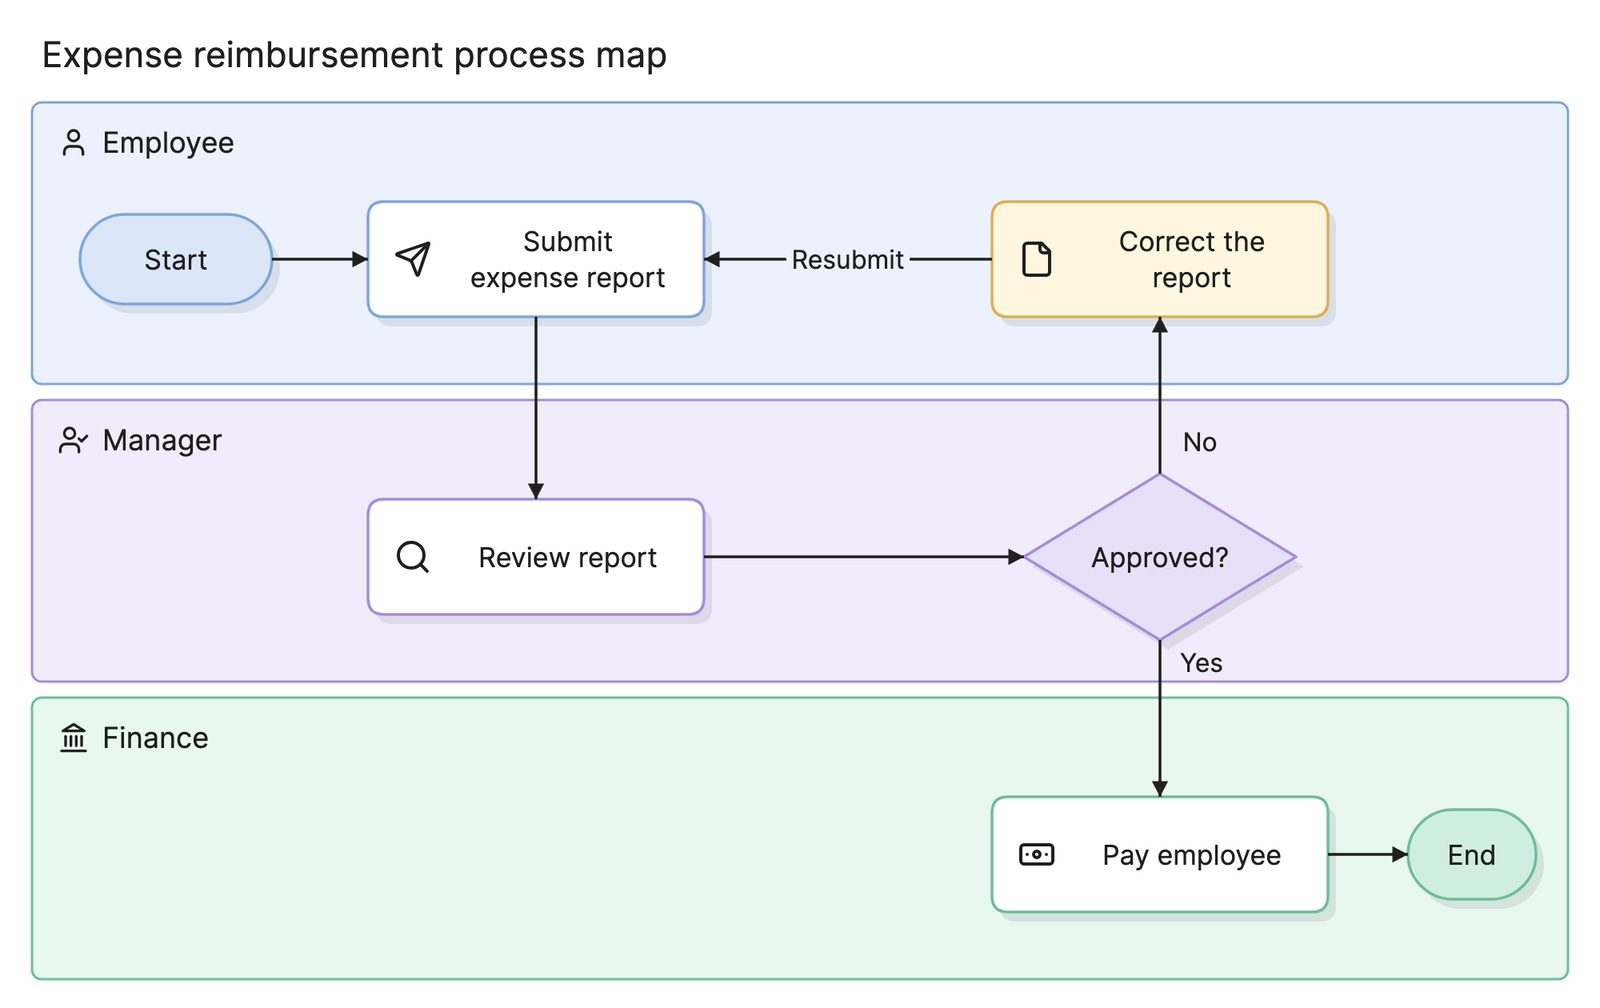
| Process map | Shows who does each step and the handoffs | The problem is likely to live between teams |
What tools can you use to make a fishbone diagram?
- Whiteboards and sticky notes. Draw the spine and bones on a whiteboard and let the group add causes as notes. This is the best format for the brainstorming itself.
- Drag-and-drop diagramming tools. Most include a fishbone template, which suits a diagram you want to keep and update as the investigation progresses.
- AI diagramming tools. Tools like Eraser turn a problem statement and a list of causes, such as the notes from a post-mortem, into a first draft of a diagram that you can keep editing.
Frequently asked questions
-
Why is it called a fishbone diagram?
Because of its shape. The problem sits in a box at the head, a horizontal spine runs into it and the categories branch off the spine like ribs. It is also called an Ishikawa diagram after Kaoru Ishikawa, who popularized it in Japanese quality circles in the 1960s, and a cause-and-effect diagram, which describes what it shows.
-
What are the 6 Ms in a fishbone diagram?
The 6 Ms are the traditional manufacturing categories: manpower, method, machine, material, measurement and mother nature, meaning the environment. Service teams often use the 4 Ss instead: surroundings, suppliers, systems and skills. Software teams usually pick their own categories, such as people, process, tools, environment, data and measurement.
-
What is the difference between a fishbone diagram and 5 whys?
They are both root cause techniques and they work well together. A fishbone diagram goes wide, collecting every plausible cause across categories. 5 whys goes deep, asking why repeatedly about one cause until it reaches something you can fix. Teams often use the fishbone to choose which causes deserve a 5 whys.
-
What is the difference between a fishbone diagram and a flowchart?
A flowchart shows the steps of a process in order. A fishbone diagram shows the causes of one problem grouped by category, and there is no order or flow between the bones. If you suspect the problem is in a specific step, a flowchart of the process helps you find which one.