Diagram types
Flowchart
A flowchart is a diagram that shows the steps of a process or algorithm as shapes joined by arrows, with a diamond wherever the path depends on a decision.
Flowcharts are the diagram most people can read without being taught, which is why teams use them to explain a procedure, debug logic or agree on how a process should work before anyone builds it.
When should you use a flowchart?
- Explaining a procedure. A support runbook or an onboarding checklist is easier to follow as a chart than as a page of nested bullet points.
- Designing logic. Sketch the branches and loops of an algorithm before writing code, so edge cases turn up early.
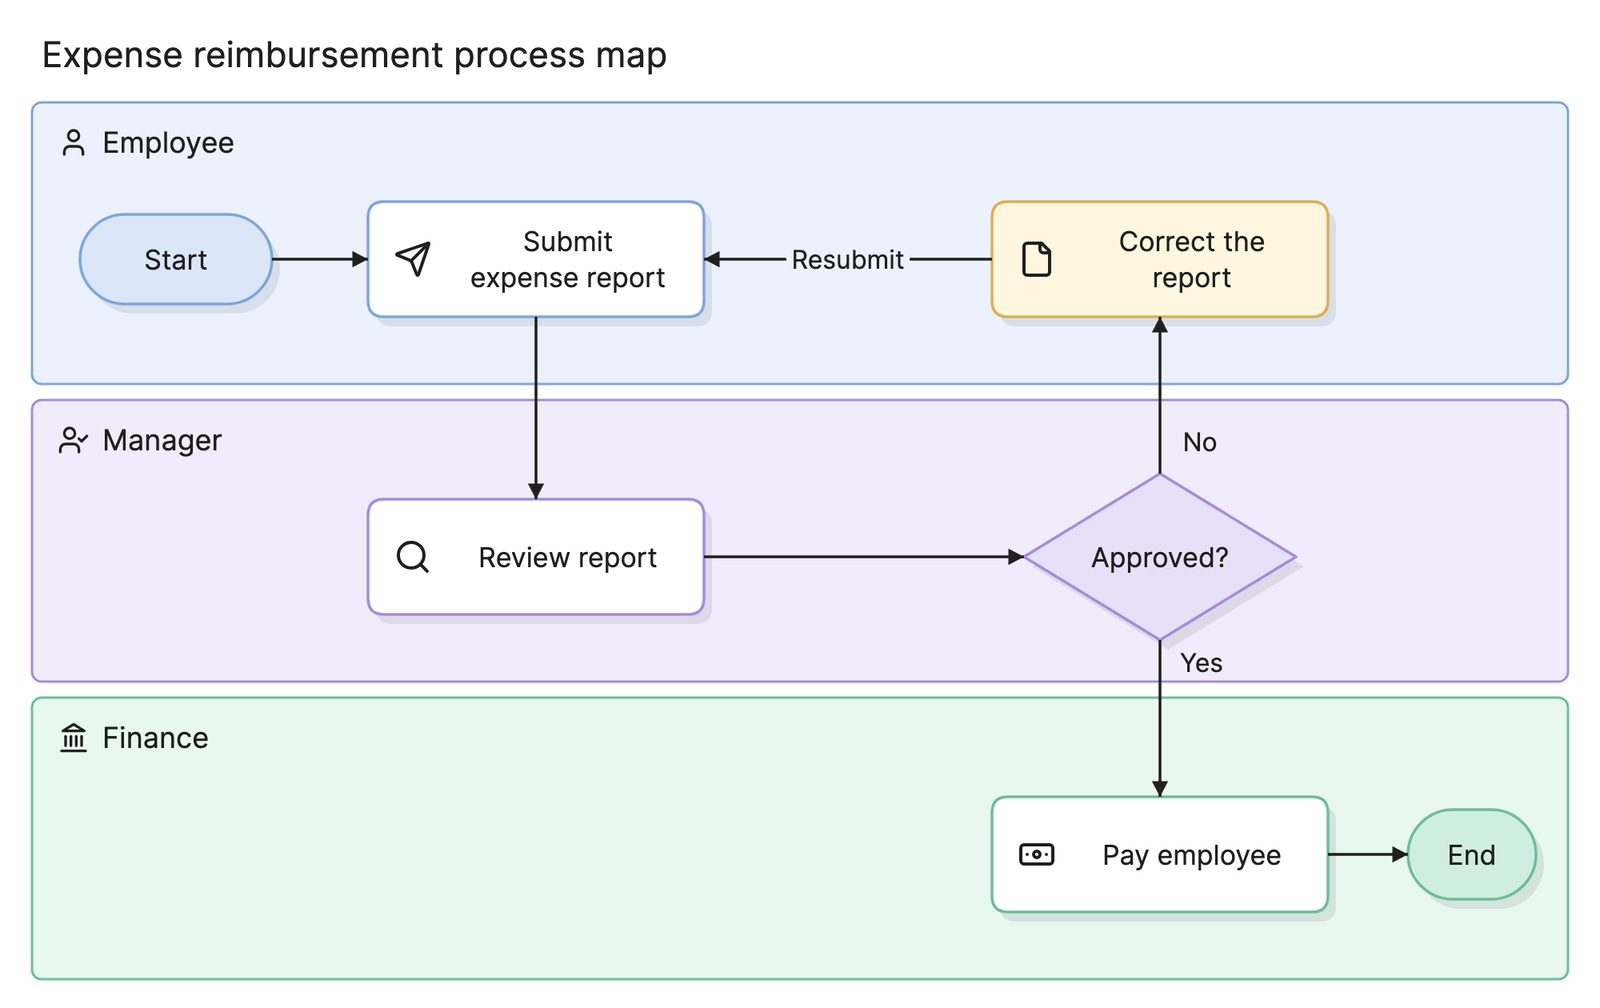
- Documenting a process. Record how work moves from a trigger to a result. When ownership matters, a process map or a swimlane diagram adds that.
- Troubleshooting. Lead someone through a set of checks, where each answer decides the next step.
What symbols does a flowchart use?
Flowchart symbols were standardized in ISO 5807, and most tools still follow it. A rounded pill starts and ends the flow, a rectangle is a step, a diamond is a decision and a parallelogram is data going in or out. Arrows show the order.
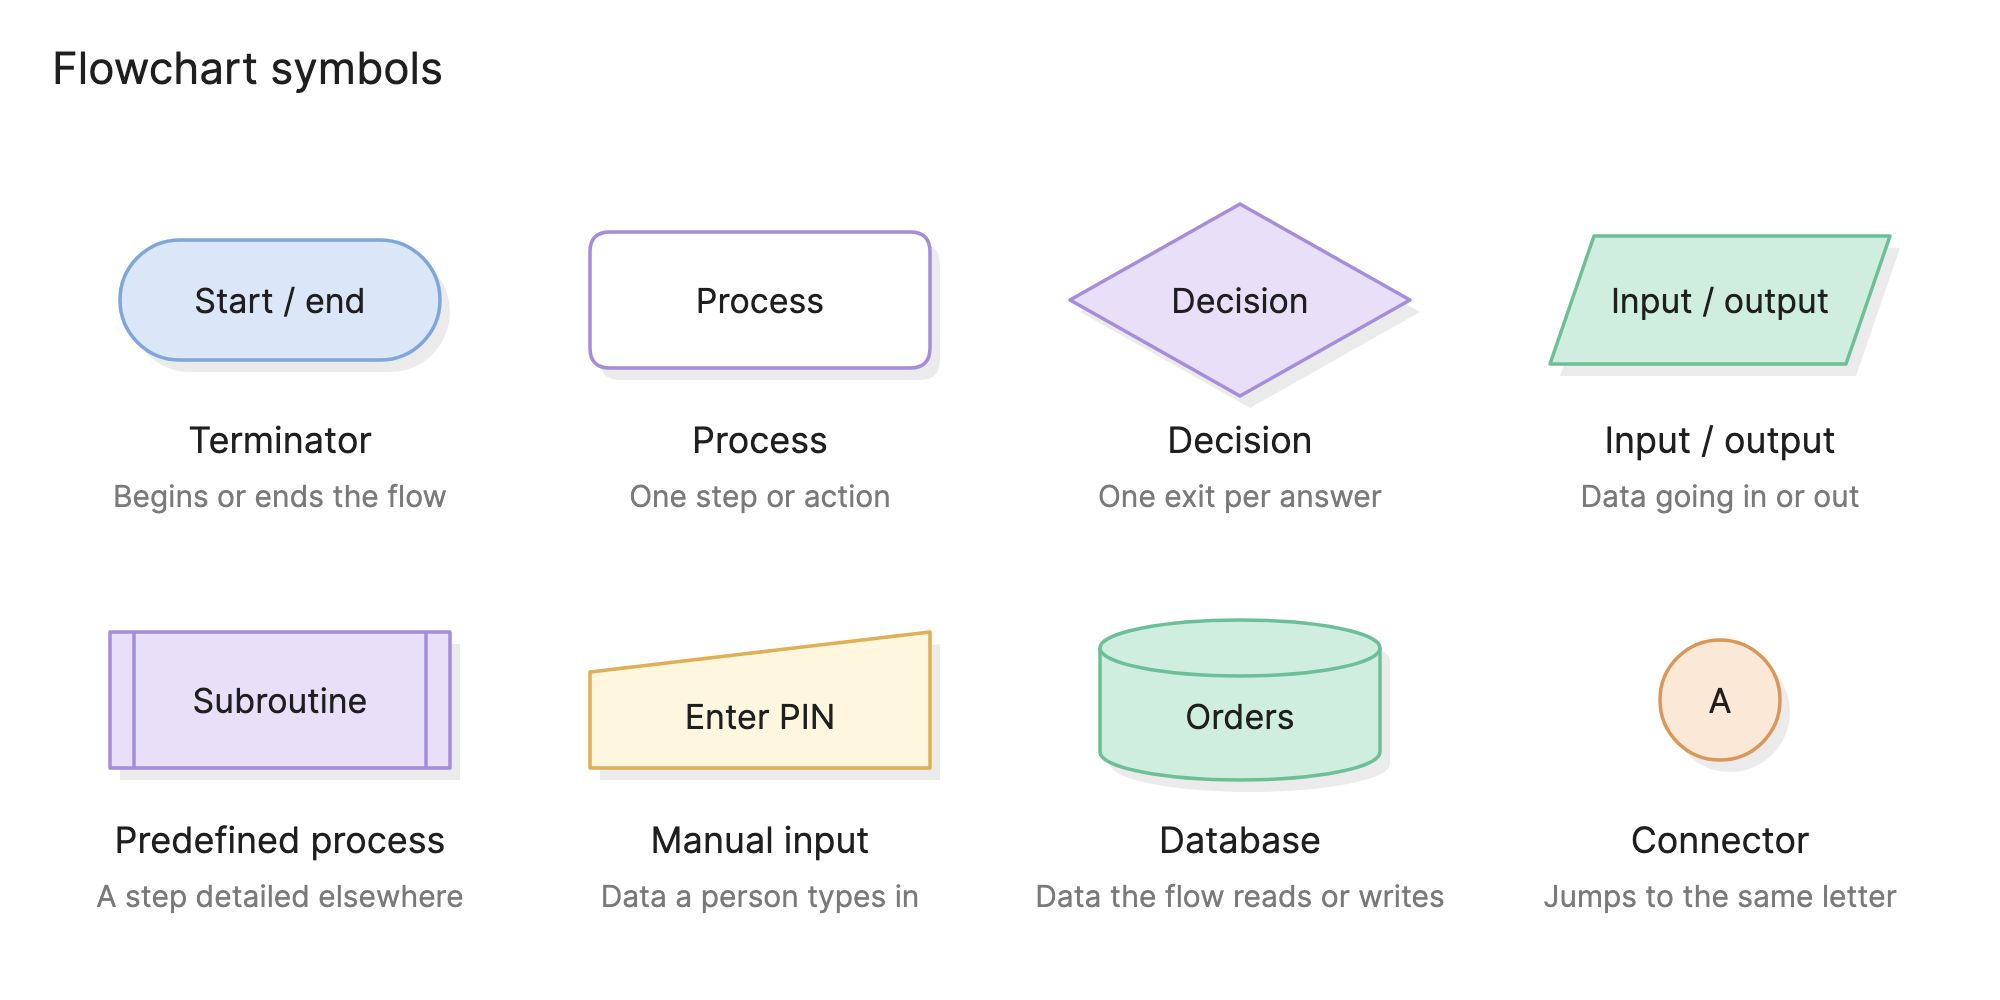
Technical flowcharts add a few more. A predefined process points to a step detailed in another chart. A manual input shape marks data a person types in. A cylinder is a database the flow reads or writes. A connector lets a long flow continue elsewhere on the page without a tangle of arrows.
What are the types of flowchart?
Process flowchart
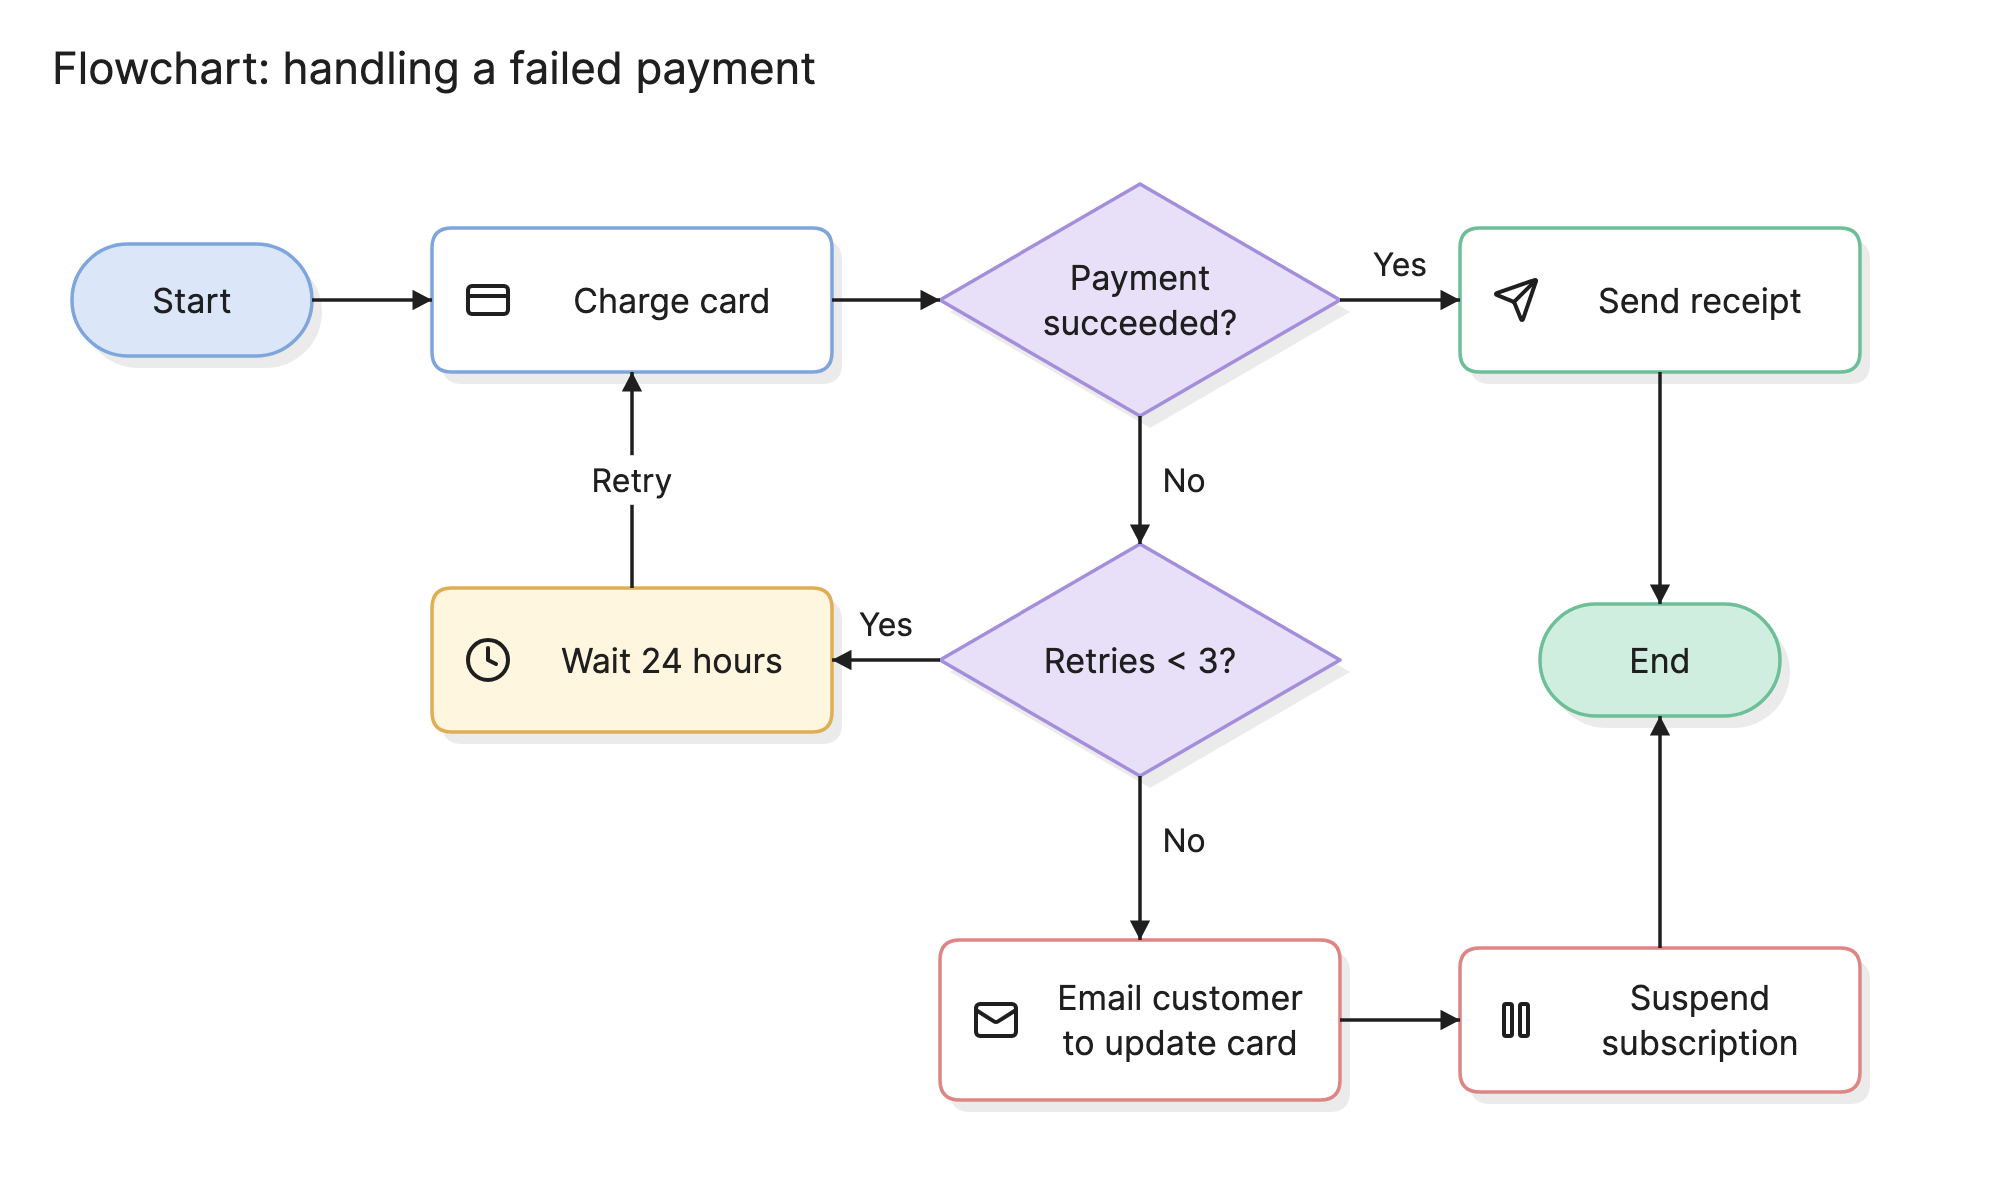
The basic form: one path from start to end with decisions along the way. The failed payment example at the top of this page is one.
Swimlane flowchart
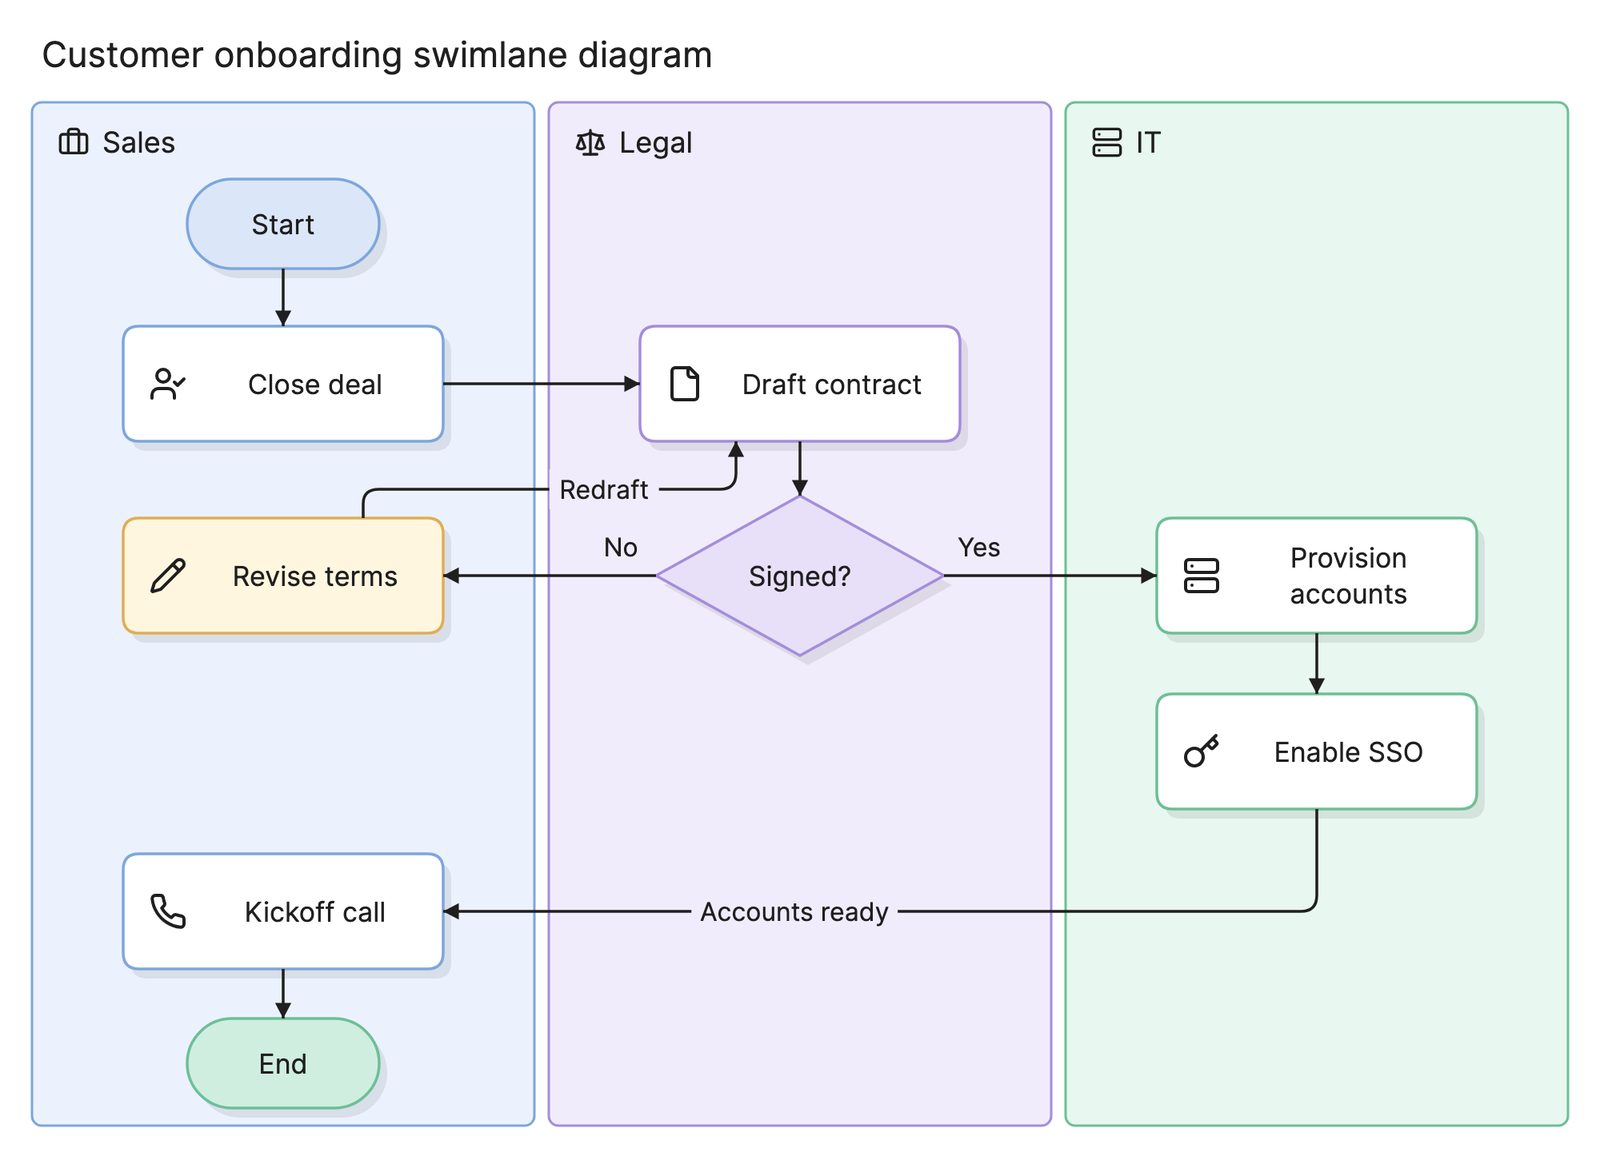
The same chart divided into lanes, one for each role, team or system. It is the best choice when a process crosses teams, and it has its own page.
Workflow diagram
A flowchart of how work moves through an organization, often with documents and approvals rather than computation. Many teams call this a process map.
Decision tree
A flowchart made almost entirely of decisions, read from one question to the next until it reaches an answer. Troubleshooting guides and eligibility checks take this form.
Program flowchart
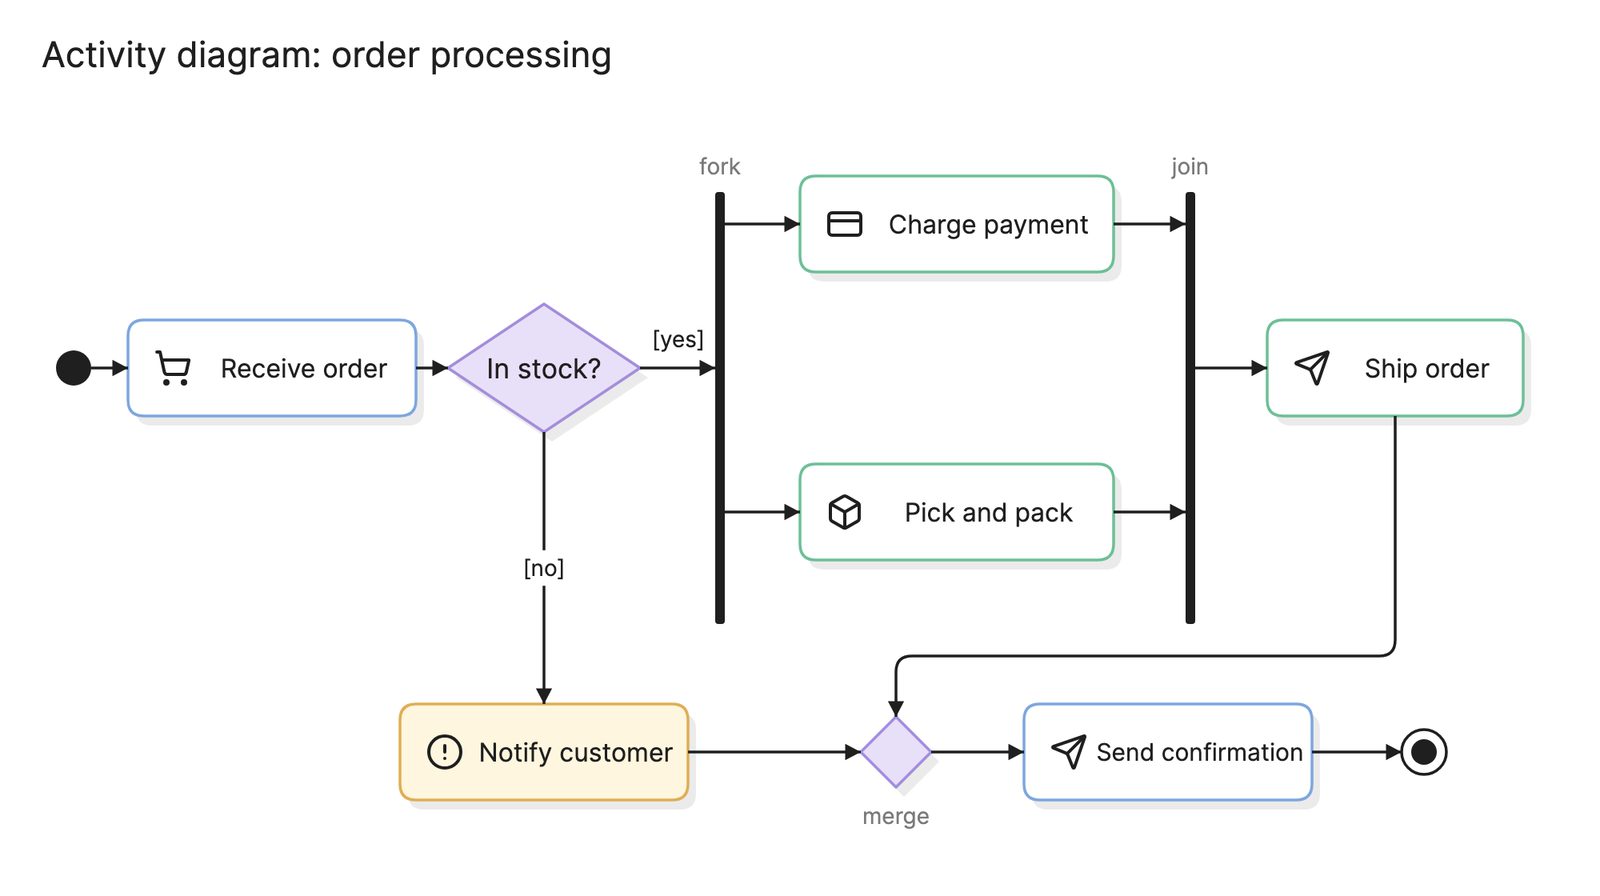
A chart of the control flow in a piece of code, with loops and conditions. Activity diagrams are the UML equivalent, with extra notation for parallel paths.
How do you read a flowchart?
Start at the pill marked Start and follow the arrows. In the example at the top of this page, the flow charges the card and then asks whether the payment succeeded. If it did, the system sends a receipt and the flow ends.
If it did not, the next diamond asks whether there have been fewer than three retries. When the answer is yes, the flow waits 24 hours and the arrow loops back up to the charge step. When the answer is no, it emails the customer to update their card, suspends the subscription and ends.
Two things are worth noticing. Every diamond has exactly one arrow out per answer, so there is no doubt about where to go next. And the loop is explicit: you can see how many times a payment is retried and what finally breaks the cycle.
How do you create a flowchart?
- Define the start and end. Name the trigger and the possible outcomes, including the failure cases.
- List the steps in order. Begin each one with a verb, such as “Charge card” or “Send receipt”.
- Add the decisions. Write each one as a yes-or-no question, and label every exit.
- Draw the flow. Keep the main path running top to bottom or left to right, and route exceptions off to the side.
- Check for loops and dead ends. Every path should reach an end, and every loop should have a way out.
- Test it with a real case. Walk through one actual example and fix anything the chart gets wrong.
What are common flowchart mistakes?
- Decisions with unlabeled exits. A diamond with two unmarked arrows forces the reader to guess.
- Too much on one page. If a chart no longer fits on a screen, move a branch into a predefined process with its own chart.
- Crossing arrows. Rearrange the shapes or use connectors. Crossings are where readers lose the thread.
- Mixing levels of detail. “Process refund” and “Click the Save button” do not belong on the same chart.
- Documenting the happy path only. The retries, rejections and timeouts are usually what people need the chart for.
How does a flowchart compare with other diagrams?
| Diagram | What it adds to a flowchart | Use it when |
|---|---|---|
| Process map | Roles, handoffs and measurements for a business process | You are improving or auditing how work gets done |
| Swimlane diagram | Lanes that show who owns each step | A process crosses teams or systems |
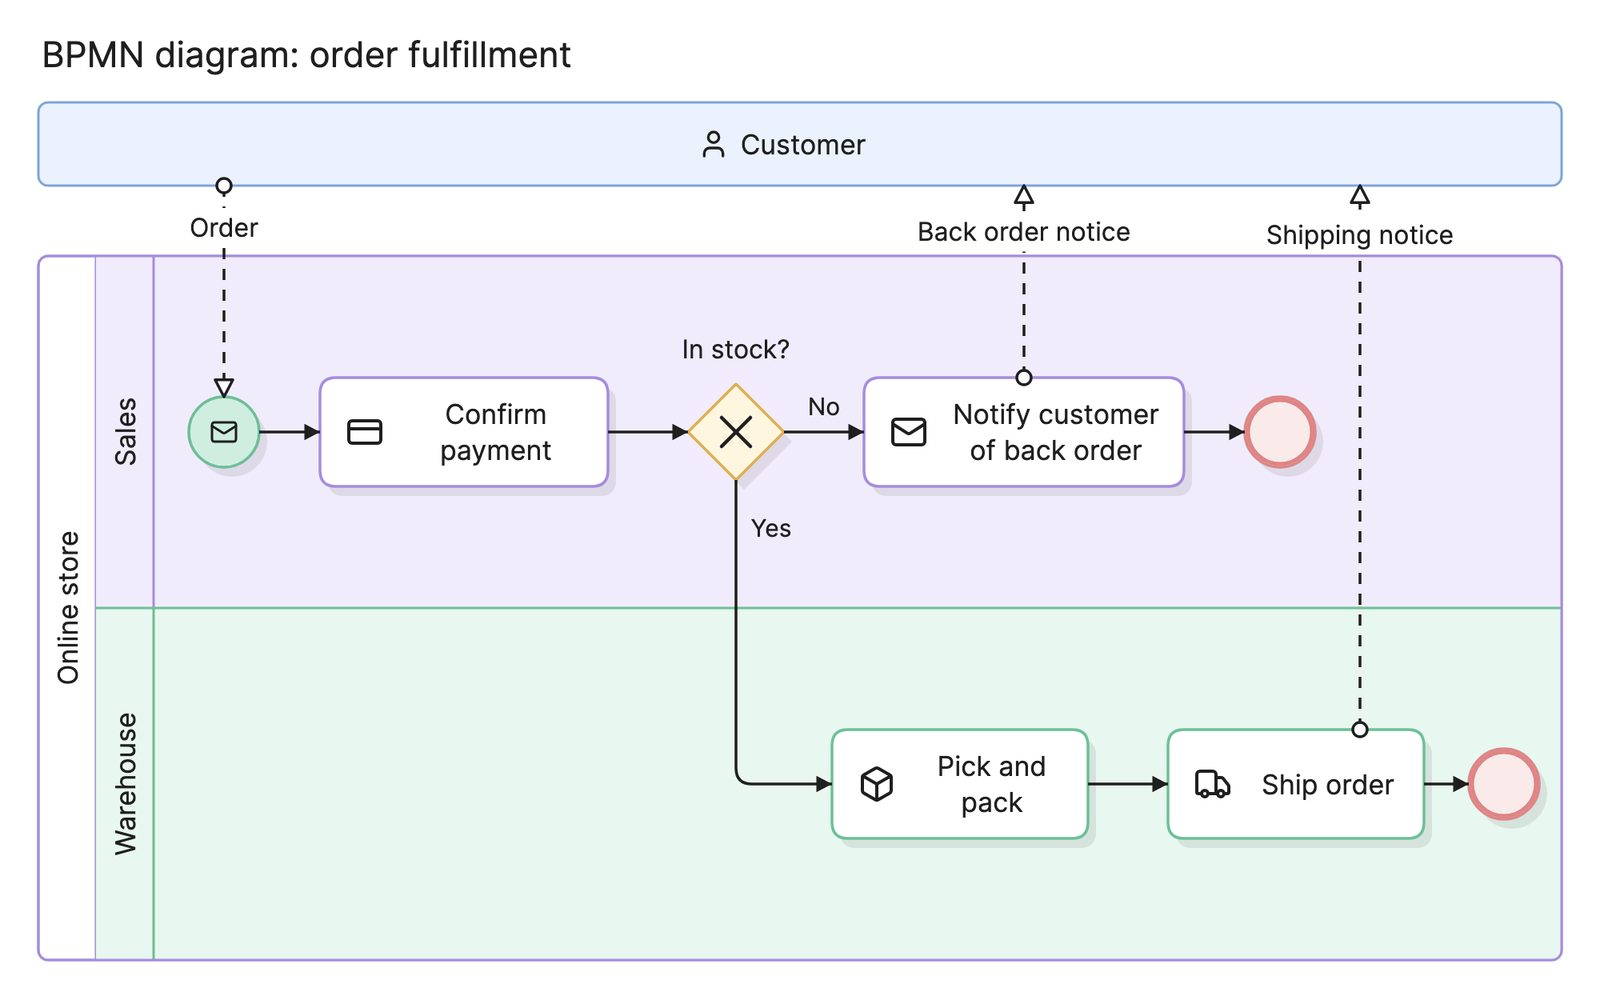
| BPMN | A formal standard with events, gateways and message flows | The model has to be precise or executable |
| State diagram | States and the events that move between them | One object changes state over time |
| Activity diagram | UML notation for parallel paths and object flows | You are modeling software behavior in UML |
What tools can you use to make a flowchart?
- Whiteboards and paper. Quickest for a first draft in a meeting, but someone has to redraw the result to keep it.
- Drag-and-drop diagramming tools. Good for a polished chart that will be maintained, with standard symbol libraries and automatic connectors.
- AI diagramming tools. Tools like Eraser turn a written procedure or a snippet of code into a first draft of a flowchart that you can keep editing, which saves the layout work when the steps are already written down.
For more on this kind of diagram, see process flow diagrams.
Frequently asked questions
-
What is the difference between a flowchart and a process map?
A flowchart is the general form: steps and decisions joined by arrows, used for anything from an algorithm to a troubleshooting guide. A process map is a flowchart used to document a business process, and it usually adds who does each step. Every process map is a flowchart, but not every flowchart maps a business process.
-
What is the difference between a flowchart and a swimlane diagram?
A swimlane diagram is a flowchart divided into lanes, one for each role, team or system. The shapes are the same. The lanes add ownership, so a handoff shows up as an arrow crossing from one lane to the next.
-
What is the difference between a flowchart and BPMN?
BPMN is a formal standard with a much larger set of symbols, including several kinds of event and gateway, and rules about what each one means. A flowchart has a handful of shapes and no governing standard. Use a flowchart to explain, and BPMN when the model needs to be precise or executable.
-
What is the difference between a flowchart and an algorithm?
An algorithm is the set of steps that solves a problem. A flowchart is one way to write it down, alongside pseudocode and plain prose. Flowcharts are useful for algorithms with branches and loops, because the shape of the diagram shows the control flow without any syntax to read.