Diagram types
Activity diagram
An activity diagram is a UML behavior diagram that shows the flow of actions in a process, including decisions, parallel work and where it starts and ends.
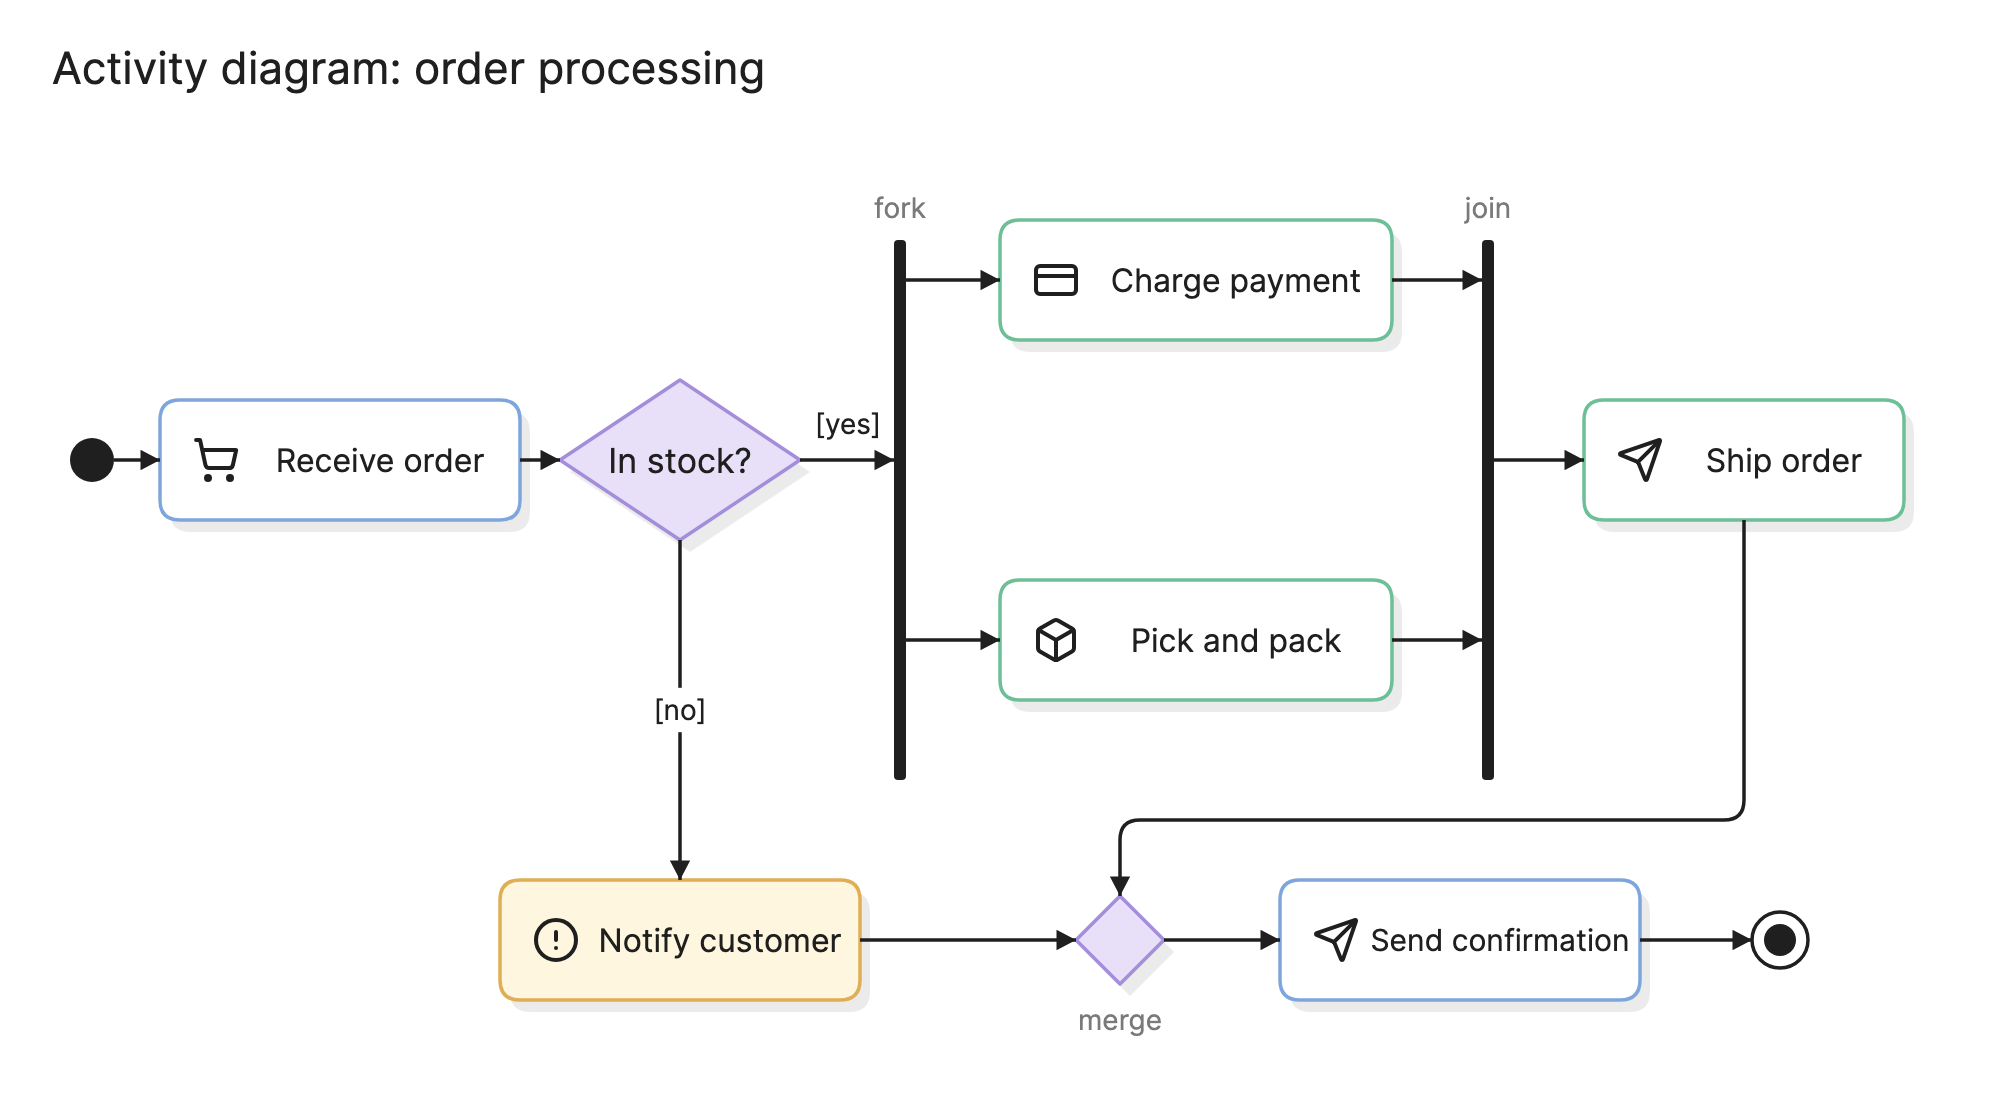
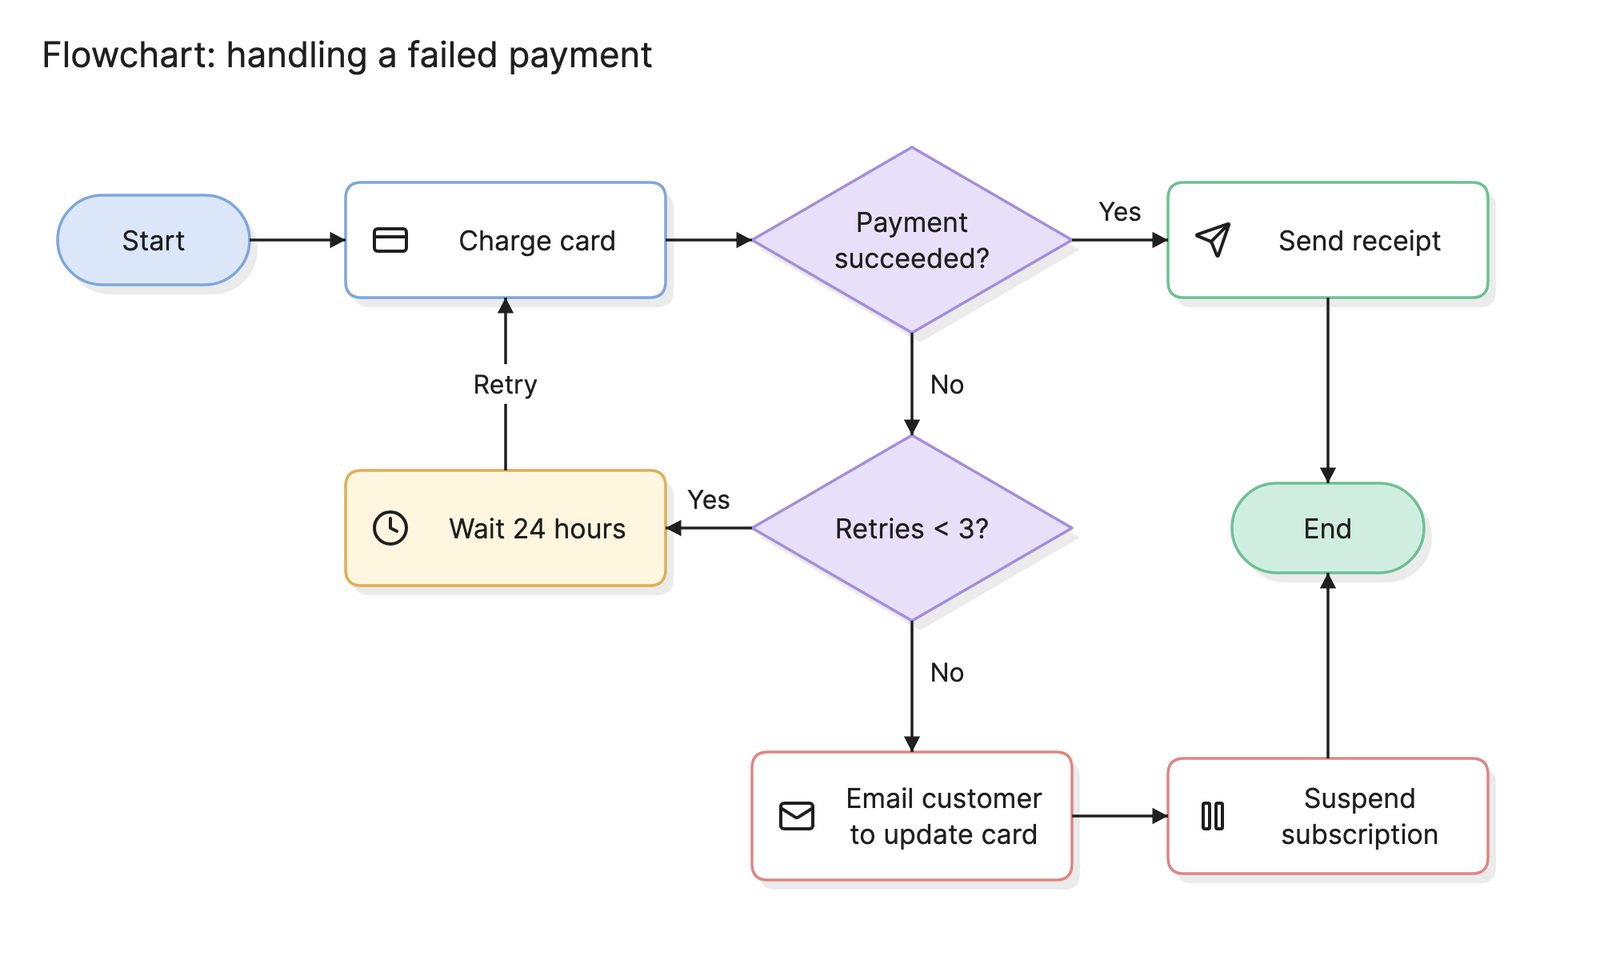
Activity diagrams are the UML diagram for processes. Teams use them where a flowchart would do but the process has parallel work, handoffs between roles or exceptions that need to be shown precisely.
When should you use an activity diagram?
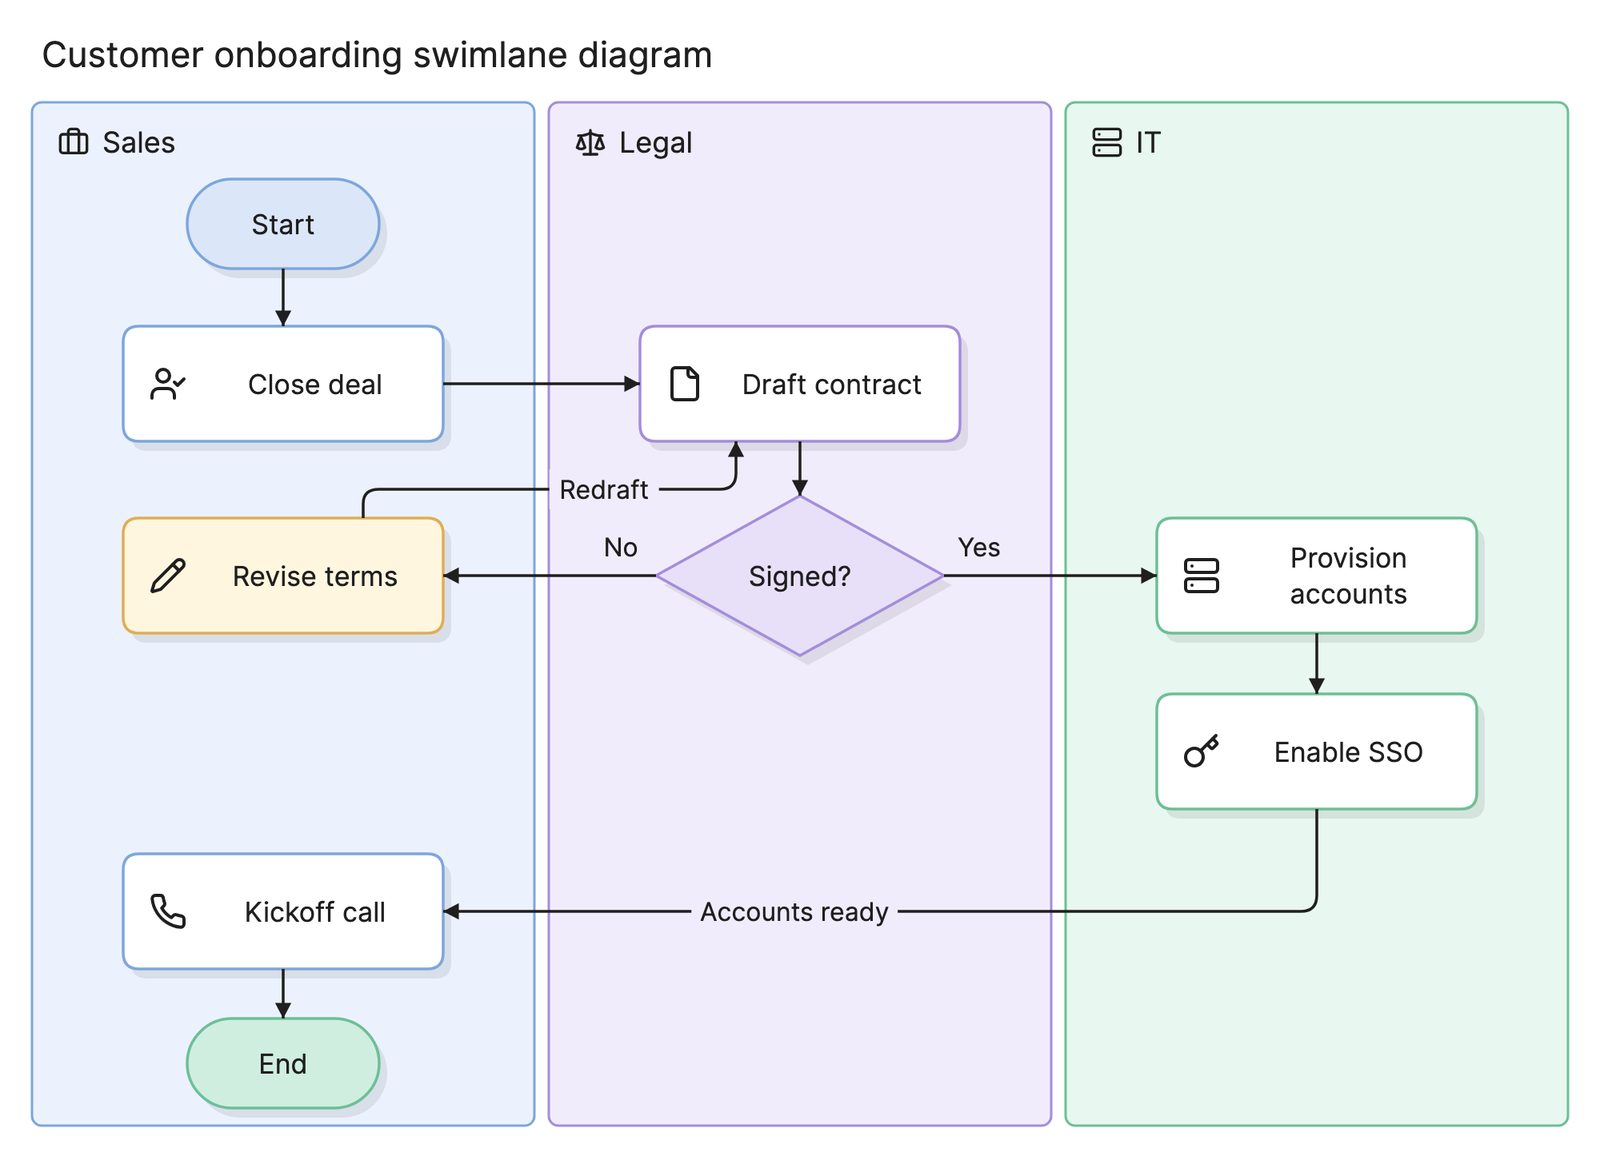
- Describing a business process. Order fulfillment, onboarding and approval workflows all fit, especially with swimlanes for the roles involved.
- Detailing a use case. Each oval in a use case diagram can have an activity diagram showing how it runs.
- Showing parallel work. When two things happen at once and must both finish, an activity diagram says so with a fork and a join, which a flowchart cannot.
- Modeling before automating. Agree on the current process, including exceptions, before building a workflow engine or an integration around it.
What symbols does an activity diagram use?
| Symbol | Shape | Meaning |
|---|---|---|
| Initial node | Filled circle | Where the activity starts |
| Action | Rounded rectangle | One step, named with a verb, such as “Charge payment” |
| Control flow | Arrow | The order actions run in |
| Decision | Diamond with one input and several outputs | One outgoing path is taken, chosen by guards in square brackets such as [yes] |
| Merge | Diamond with several inputs and one output | Brings alternative paths back together; no waiting |
| Fork | Thick bar with one input and several outputs | All outgoing paths start at once |
| Join | Thick bar with several inputs and one output | Waits for every incoming path before continuing |
| Activity final | Bullseye | The whole activity ends |
| Flow final | Circle with an X | One path ends, the rest continue |
| Object node | Rectangle | Data passed between actions, such as an order or an invoice |
| Swimlane | Column or row with a name | Who performs the actions inside it |
The decision and merge nodes use the same diamond, and the fork and join use the same bar. You tell them apart by counting the arrows: one in and many out means decision or fork, many in and one out means merge or join.
How do you read an activity diagram?
Start at the filled circle and follow the arrows. In the order processing example, the first action is “Receive order”, which leads to a decision: is the item in stock? The guards on the outgoing arrows, [yes] and [no], say which path is taken.
On the [yes] path the flow hits a fork. Both arrows out of it start at once, so “Charge payment” and “Pick and pack” run in parallel. The join on the right waits until both have finished before “Ship order” begins. A flowchart would have to put payment before packing or after it, and either order would misstate how the warehouse works.
On the [no] path the flow goes to “Notify customer”. Both paths then arrive at a merge diamond, which passes whichever path arrives straight through. “Send confirmation” runs in both cases, and the bullseye ends the activity.
How do you create an activity diagram?
- Set the start and end. Name the trigger and the outcome, and draw the initial and final nodes first.
- List the actions in order. Start each with a verb. Stay at one level of detail.
- Add decisions with guards. Every outgoing arrow from a decision gets a condition, and the conditions should not overlap.
- Find the parallel work. Where two actions do not depend on each other, put them between a fork and a join.
- Merge the branches. Where alternative paths come back together, use a merge node rather than pointing several arrows at one action.
- Add swimlanes if more than one role is involved. Then every handoff is a line crossing a lane boundary.
- Walk through a real case. Follow one order through and check it never gets stuck or takes two paths at once.
What are common activity diagram mistakes?
- A fork with no join. Parallel paths that never rejoin leave the reader unsure when the activity is done. Either join them or end each with a flow final.
- A decision used as a fork. If both branches must run, it is a fork. If one is chosen, it is a decision.
- Guards that overlap or leave a gap.
[amount > 100]and[amount < 100]miss exactly 100. Use[else]for the remaining case. - Missing exceptions. Out of stock, payment declined and address invalid are where the process gets interesting. Show at least the common ones.
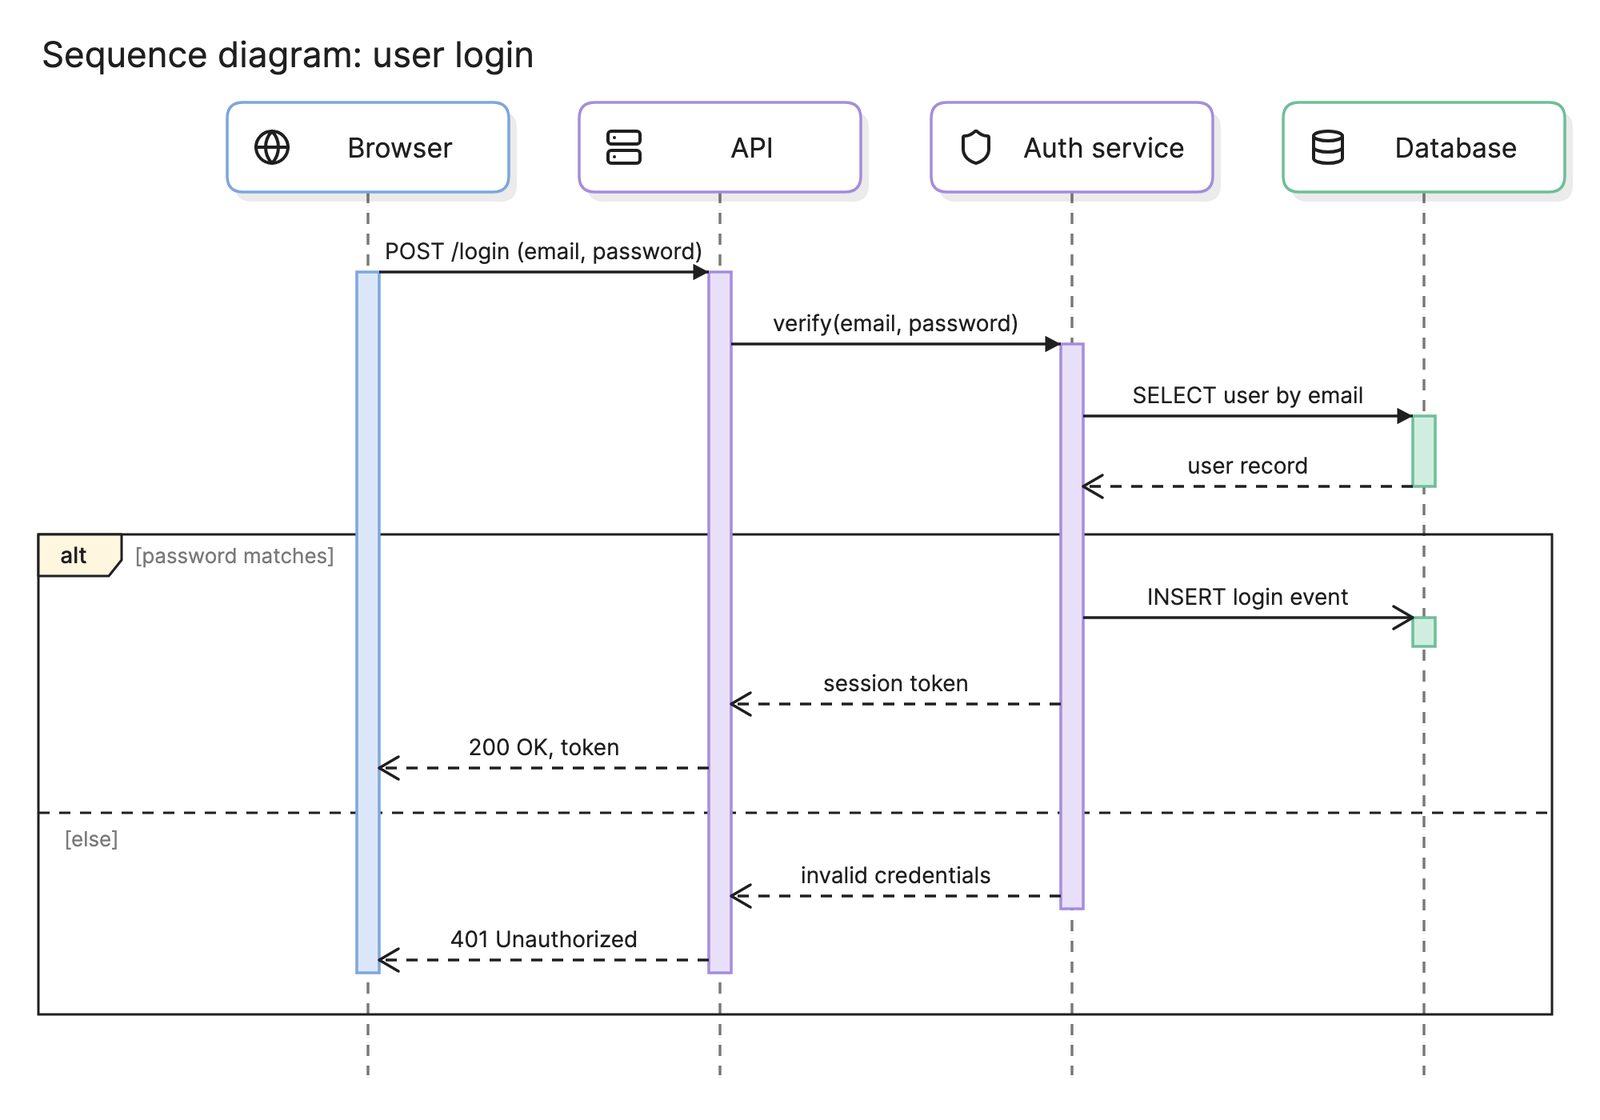
- Treating it as a sequence diagram. If you need to show which component sends which message, draw a sequence diagram instead.
How does an activity diagram compare with other diagrams?
| Diagram | What it shows | Use it when |
|---|---|---|
| Activity diagram | The flow of actions, with decisions and parallel paths | The process has parallelism, handoffs or needs UML precision |
| Flowchart | Steps and decisions in a loose, familiar notation | The audience is general and the process is simple |
| BPMN | Business processes in a richer, executable notation | The model has to drive a process engine or be audited |
| Sequence diagram | Messages between participants in time order | The question is who calls whom |
| State diagram | The states of one object and the events that change them | The question is about an object’s lifecycle, not a workflow |
What tools can you use to make an activity diagram?
- Drag-and-drop diagramming tools. Most ship the UML activity shapes, including fork and join bars and swimlanes.
- Diagram-as-code tools. PlantUML has a full activity diagram syntax, and Mermaid flowcharts cover the simpler cases, so the diagram can live in the repository.
- AI diagramming tools. Tools like Eraser take a written process, a ticket or a procedure and return a UML diagram you can keep editing, which is the fastest way to get an existing process onto the page.
For more on this kind of diagram, see process flow diagrams.
Frequently asked questions
-
What is the difference between an activity diagram and a flowchart?
They look alike and both show steps and decisions. An activity diagram is the UML version, with a defined notation and a few things a plain flowchart lacks: fork and join bars for parallel work, a separate merge node, swimlanes for responsibility and object nodes for the data that passes between actions.
-
What is the difference between a fork and a decision?
A decision picks one outgoing path based on a condition, so exactly one branch runs. A fork starts every outgoing path at once, so all branches run in parallel, and a join waits for all of them to finish before the flow continues. Confusing the two is the most common activity diagram error.
-
What is a swimlane in an activity diagram?
A swimlane, called an activity partition in UML, is a column or row that groups actions by who performs them, such as a team, a role or a system. Actions sit in the lane of their owner, and a flow crossing from one lane to another is a handoff. See swimlane diagram.
-
What is the difference between an activity diagram and a state diagram?
An activity diagram follows the flow of work from start to finish. A state diagram follows one object and the states it can be in, with the events that move it between them. For an order, the activity diagram shows the steps to fulfill it, and the state diagram shows that it can be pending, paid, shipped or cancelled.