Diagram types
State diagram
A state diagram shows the states an object can be in, the events that move it between them and the actions taken on each transition, from start to finish.
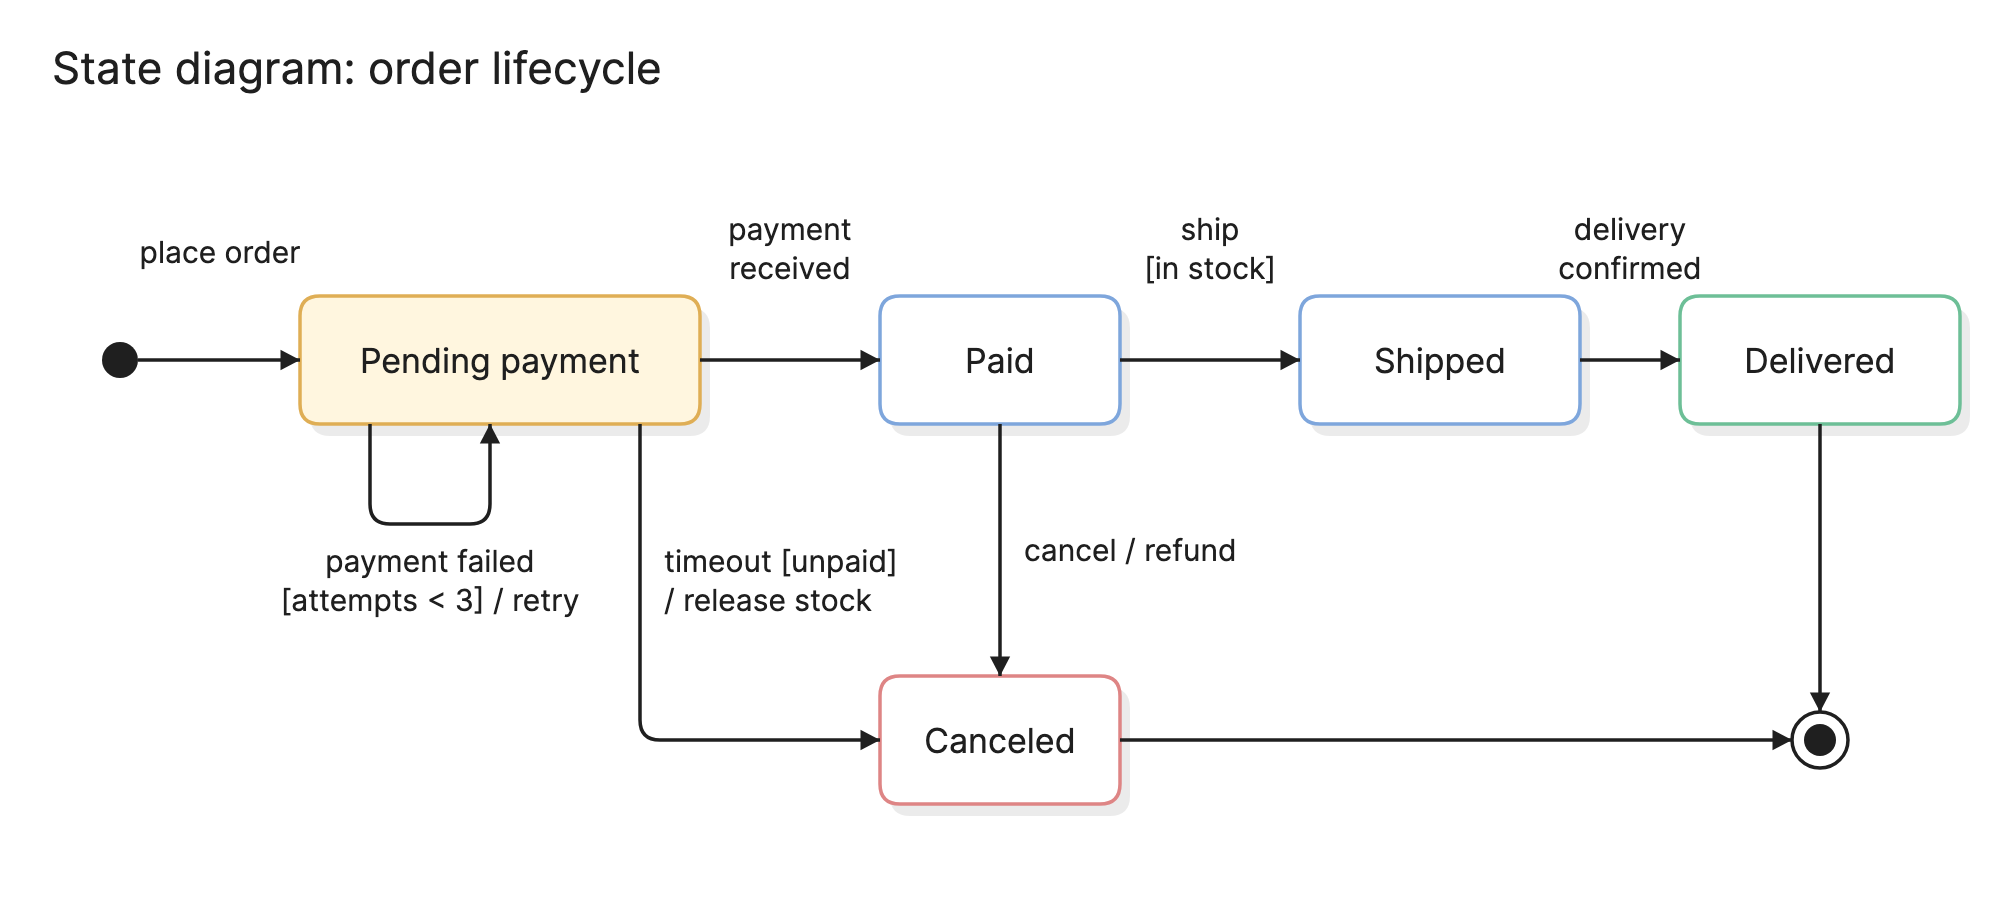
Teams draw state diagrams to pin down the lifecycle of something that changes over time, such as an order or a connection, so that every allowed transition is listed and every forbidden one is obvious by its absence.
When should you use a state diagram?
- Modeling a lifecycle. Orders, tickets, subscriptions and documents all pass through a fixed set of statuses, and the diagram is the authoritative list.
- Designing a protocol or a device. Connections, sessions and embedded controllers are state machines by nature.
- Finding missing cases. Laying out every state and event exposes the combinations nobody has considered, such as a cancellation after shipping.
- Reviewing code with a status field. If the code has an
if status ==chain, a diagram shows whether the transitions are complete.
What notation does a state diagram use?
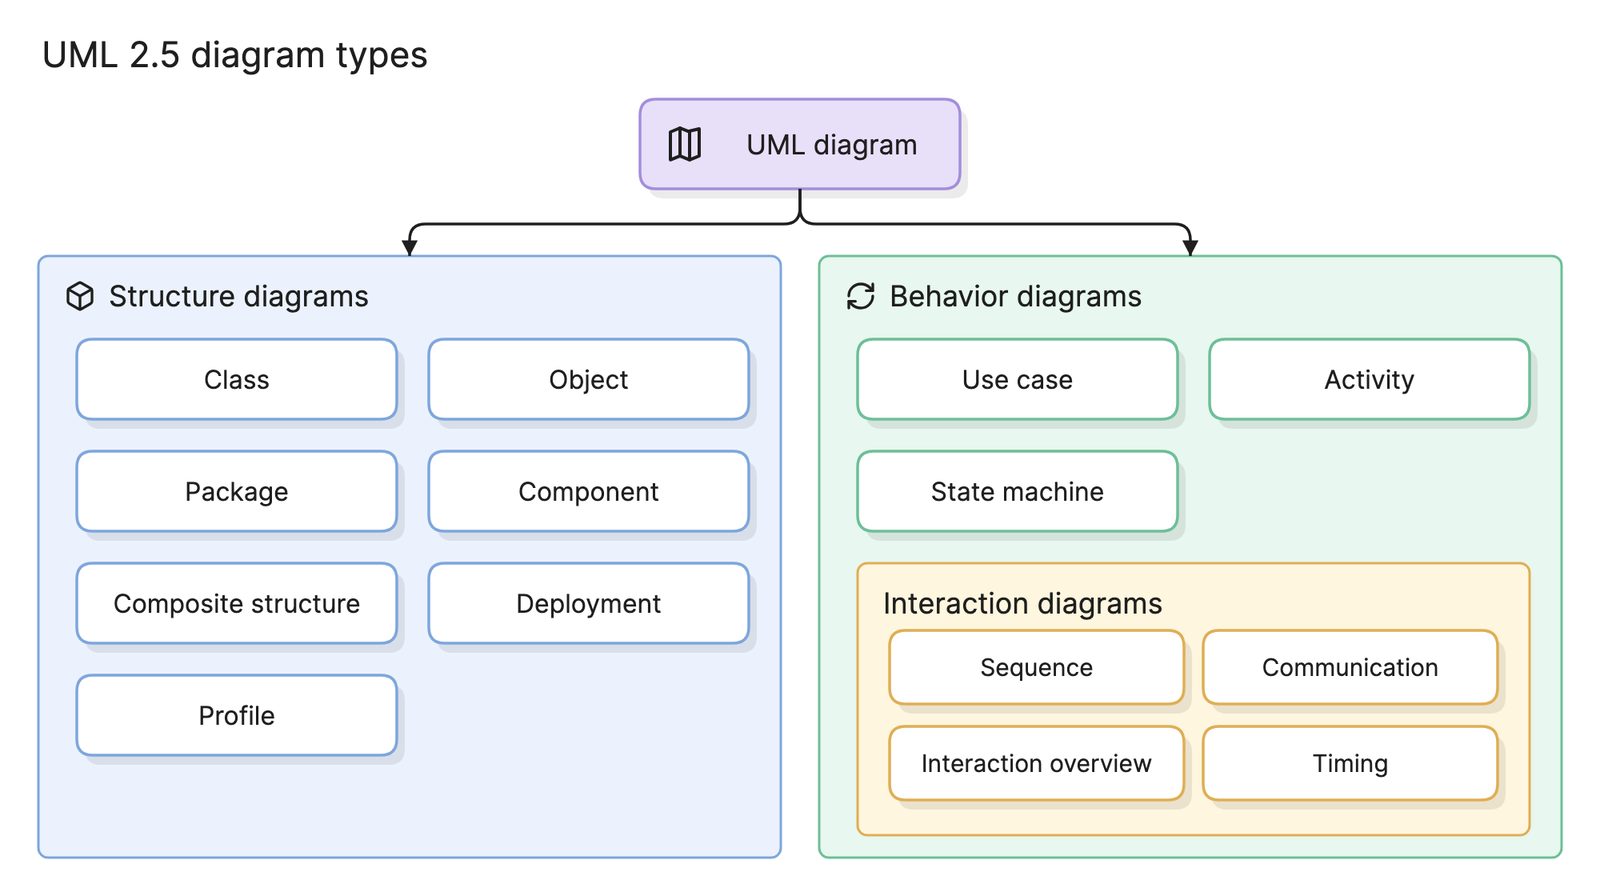
State diagrams follow the UML state machine notation, which is one of the standard UML diagram types.
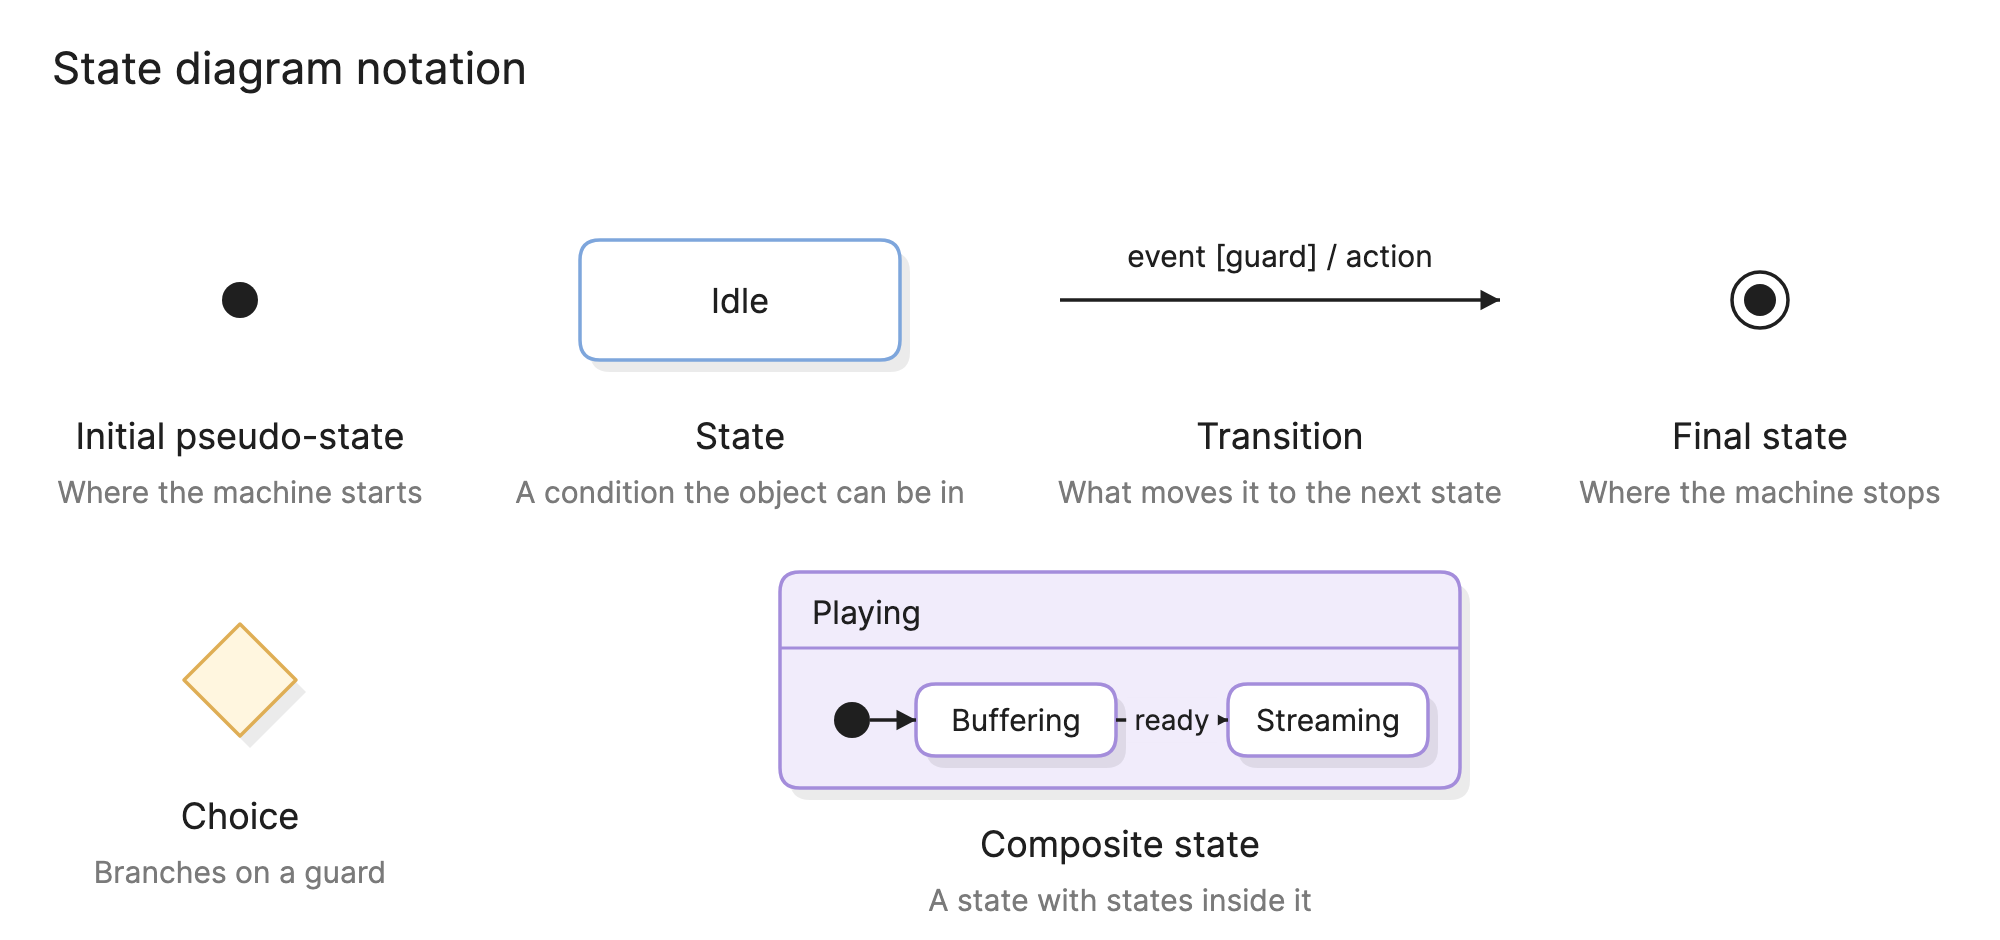
- Initial pseudo-state. A filled circle marks where the machine starts. It has exactly one outgoing transition.
- State. A rounded rectangle named for a condition the object can be in, such as
Paid. A state can list entry, exit and internal actions below its name. - Transition. An arrow from one state to another, labeled
event [guard] / action. The event triggers it, the guard must be true for it to fire and the action is what happens on the way. All three parts are optional. - Final state. A filled circle inside a ring marks where the lifecycle ends. A diagram can have several or none.
- Choice. A diamond that branches on a guard evaluated at that moment.
- Composite state. A state containing its own states, so that related states can share a transition, such as one
cancelarrow leaving the composite instead of one from each inner state.
What are the types of state diagram?
Simple state machine
A flat set of states and transitions, like the order example above. It is enough for most lifecycles with fewer than a dozen states.
Hierarchical state machine
Adds composite states, so an inner machine lives inside an outer state. A media player is Playing or Paused at the top level, while Playing contains Buffering and Streaming.
Concurrent state machine
Splits a composite state into regions that run at once, so a document can be Draft or Published in one region and Locked or Unlocked in another.
Mealy and Moore machines
The classic distinction from digital design. A Moore machine’s output depends on the state alone, a Mealy machine’s on the state and the input. UML covers both, since actions can sit on states or on transitions.
How do you read a state diagram?
Start at the filled circle and follow the arrows, reading each label as “when this event happens, if this guard holds, do this action”. In the order example, placing the order creates it in Pending payment, and a received payment moves it to Paid. The self-transition underneath shows a failed payment: with fewer than three attempts so far, the order retries and stays where it is.
From Pending payment a timeout releases the stock and moves the order to Canceled. From Paid, a cancellation issues a refund and leads to the same state. The happy path continues to Shipped, then Delivered and the final state.
Just as useful is what is not there. No arrow leaves Shipped for Canceled, so a cancellation after shipping is not allowed, and the code should reject it.
How do you create a state diagram?
- Pick one object. A state diagram describes a single thing, such as an order, not a whole process.
- List its states. Use the statuses the business already talks about, and make sure each is a condition, not an action.
- List the events. Write down everything that can happen to the object: user actions, timers and messages from other systems.
- Draw the transitions. For each state, ask what each event does. Add guards where the answer depends on data and actions where something has to happen.
- Mark the start and the ends. Add the initial pseudo-state and a final state for each way the lifecycle can finish.
- Check for gaps. Every state should be reachable and have an exit, and every event should be handled or deliberately ignored in each state.
What are common state diagram mistakes?
- States that are really actions. “Sending email” is an activity, not a state. The state is “Awaiting confirmation”.
- Unlabeled transitions. An arrow without an event leaves the reader guessing what fires it.
- Flat diagrams that should be hierarchical. When five states all have the same
canceltransition, wrap them in a composite state. - Letting the diagram and the code drift. The diagram should match the status enum and the transition rules exactly.
How does a state diagram compare with other diagrams?
| Diagram | What it follows | Use it when |
|---|---|---|
| State diagram | One object through its states | You need every allowed status change in one place |
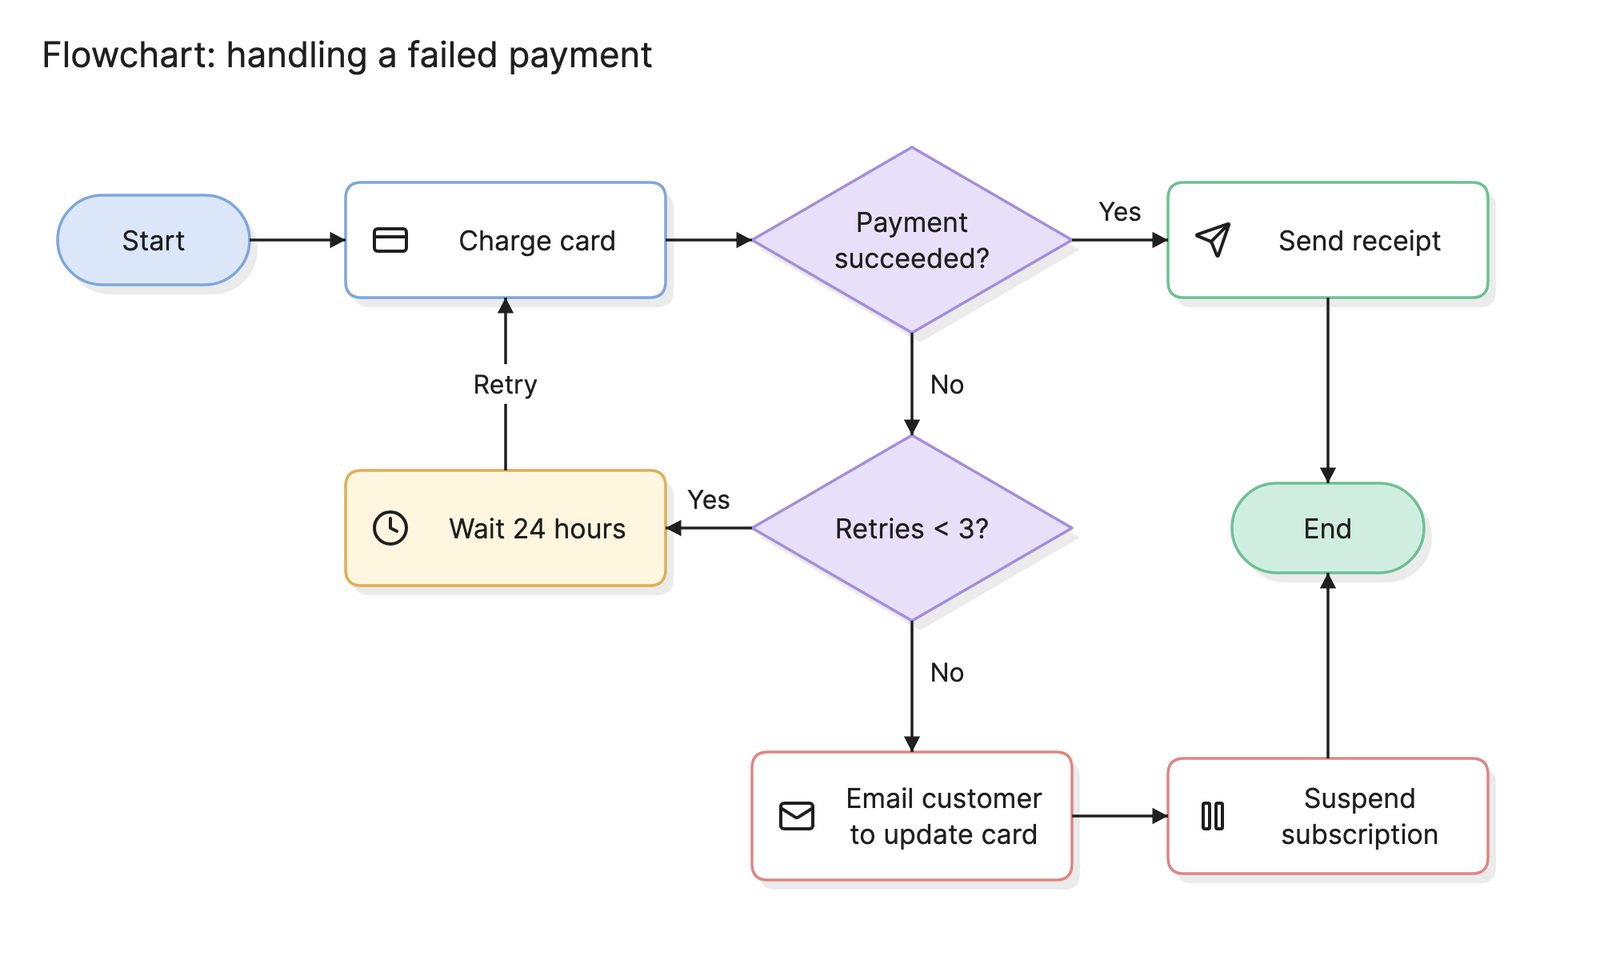
| Flowchart | A procedure from start to end | The subject is a sequence of steps, not a lifecycle |
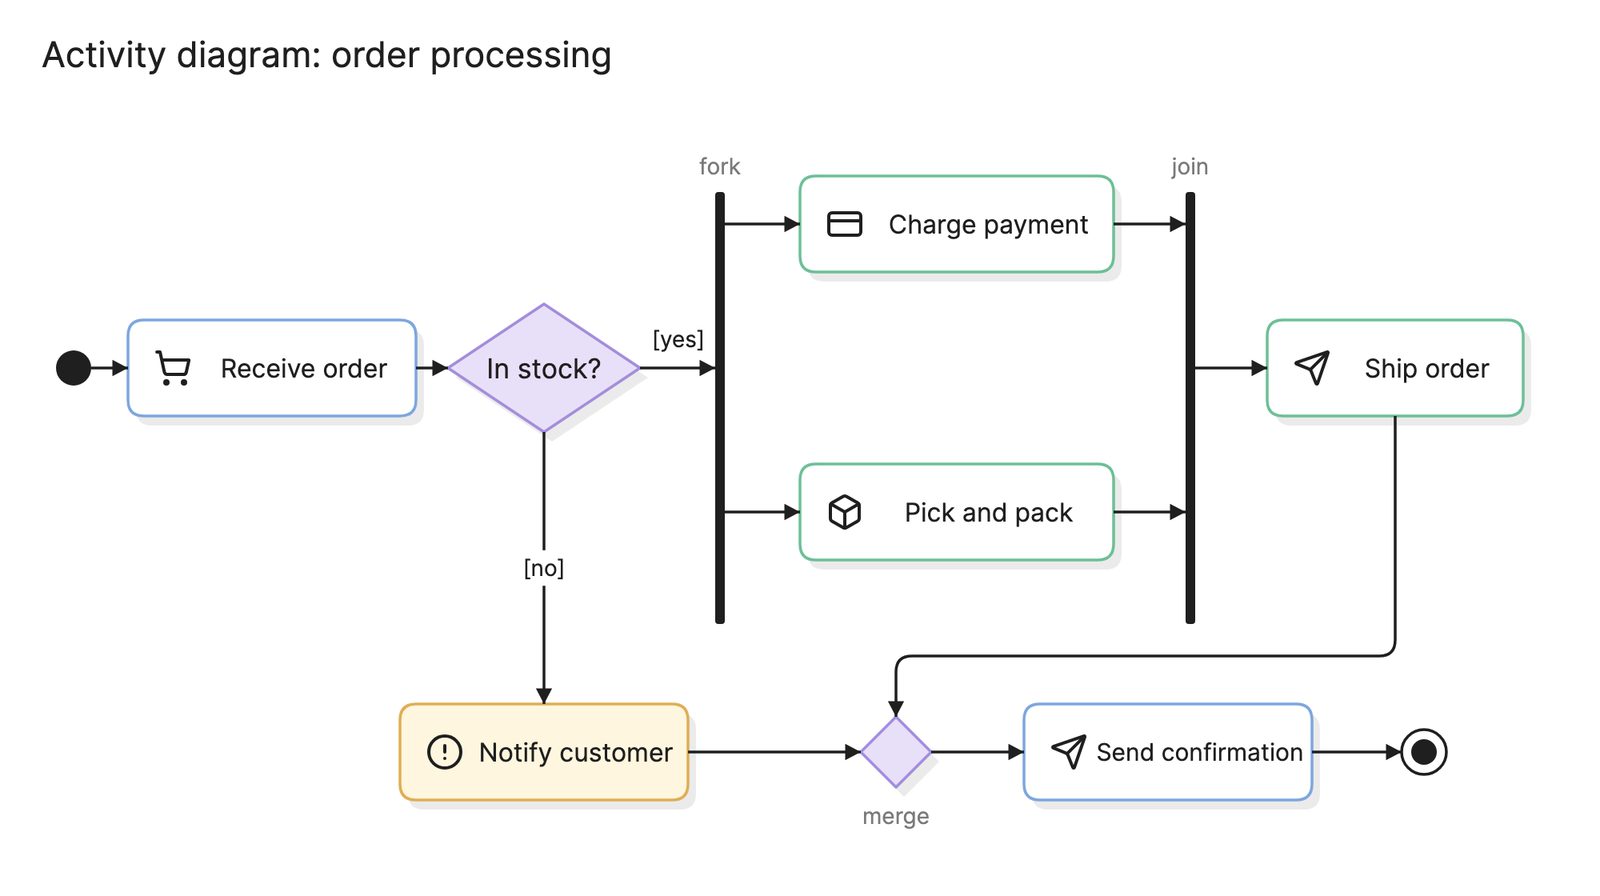
| Activity diagram | Control flow through a process, in UML | You are modeling a workflow with parallel paths |
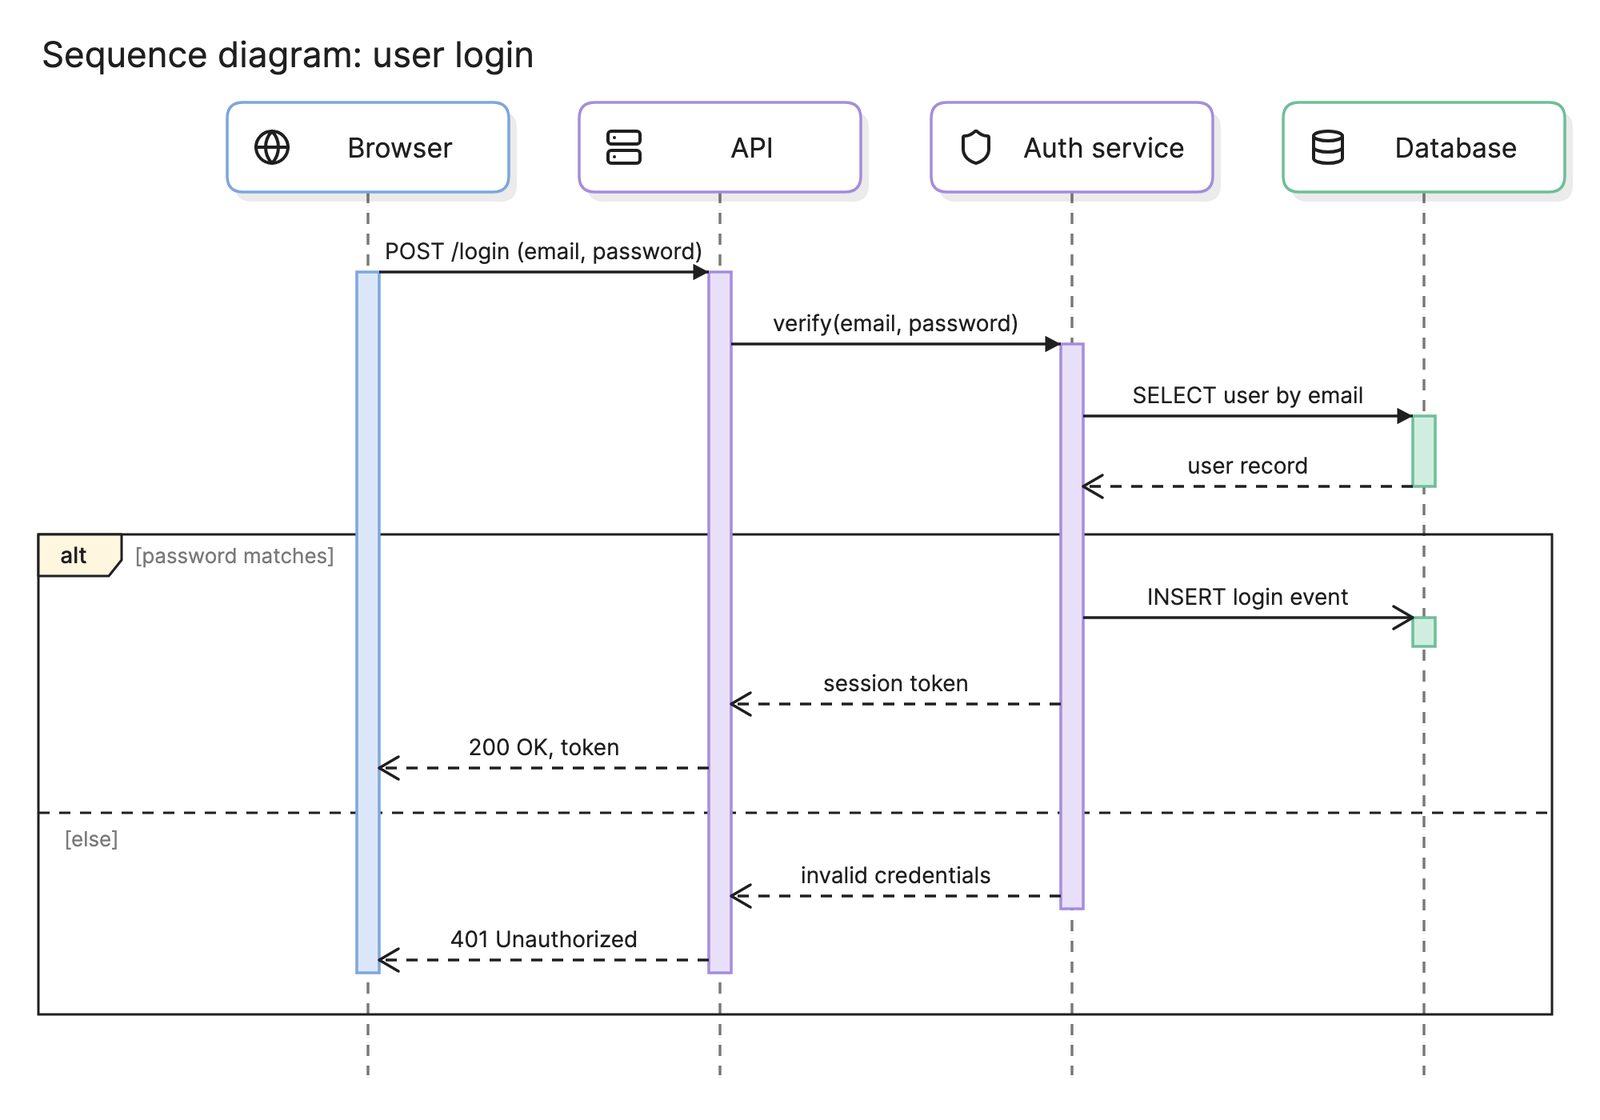
| Sequence diagram | Messages between components over time | You are showing how parts of a system call each other |
What tools can you use to make a state diagram?
- Diagram-as-code tools. Mermaid and PlantUML both support state diagrams, so the source can sit next to the code that implements the machine.
- Drag-and-drop diagramming tools. These give full control over layout, which helps when a diagram has many crossing transitions.
- AI diagramming tools. Tools like Eraser turn a written description of a lifecycle, or the enum and transition code itself, into a first draft of a state diagram that you can keep editing.
For more on this kind of diagram, see state diagrams.
Frequently asked questions
-
What is the difference between a state diagram and a flowchart?
A flowchart shows a sequence of steps that runs from start to end. A state diagram shows the conditions one object can be in and what moves it between them, and the object can sit in a state indefinitely waiting for an event. Use a flowchart for a procedure and a state diagram for a lifecycle.
-
What is the difference between a state diagram and an activity diagram?
An activity diagram follows the flow of control through a process, with nodes for actions. A state diagram follows one object, with nodes for its states. They are both UML behavior diagrams, and teams often draw an activity diagram of a process and a state diagram of the key entity inside it.
-
What is a state machine?
A state machine is the model a state diagram draws: a finite set of states, a set of events and the rules for which event moves the machine from which state to which. The term is also used for the code that implements the model, which is why state diagrams are so common in software design.
-
What is a statechart?
A statechart is David Harel's extension of the state diagram, which added composite states, concurrent regions and history. UML's state machine diagram is based on it, so in practice the terms state diagram, state machine diagram and statechart are used interchangeably.