Diagram types
Sequence diagram
A sequence diagram is a UML interaction diagram that shows the messages passed between objects or services over time, in the order they happen.
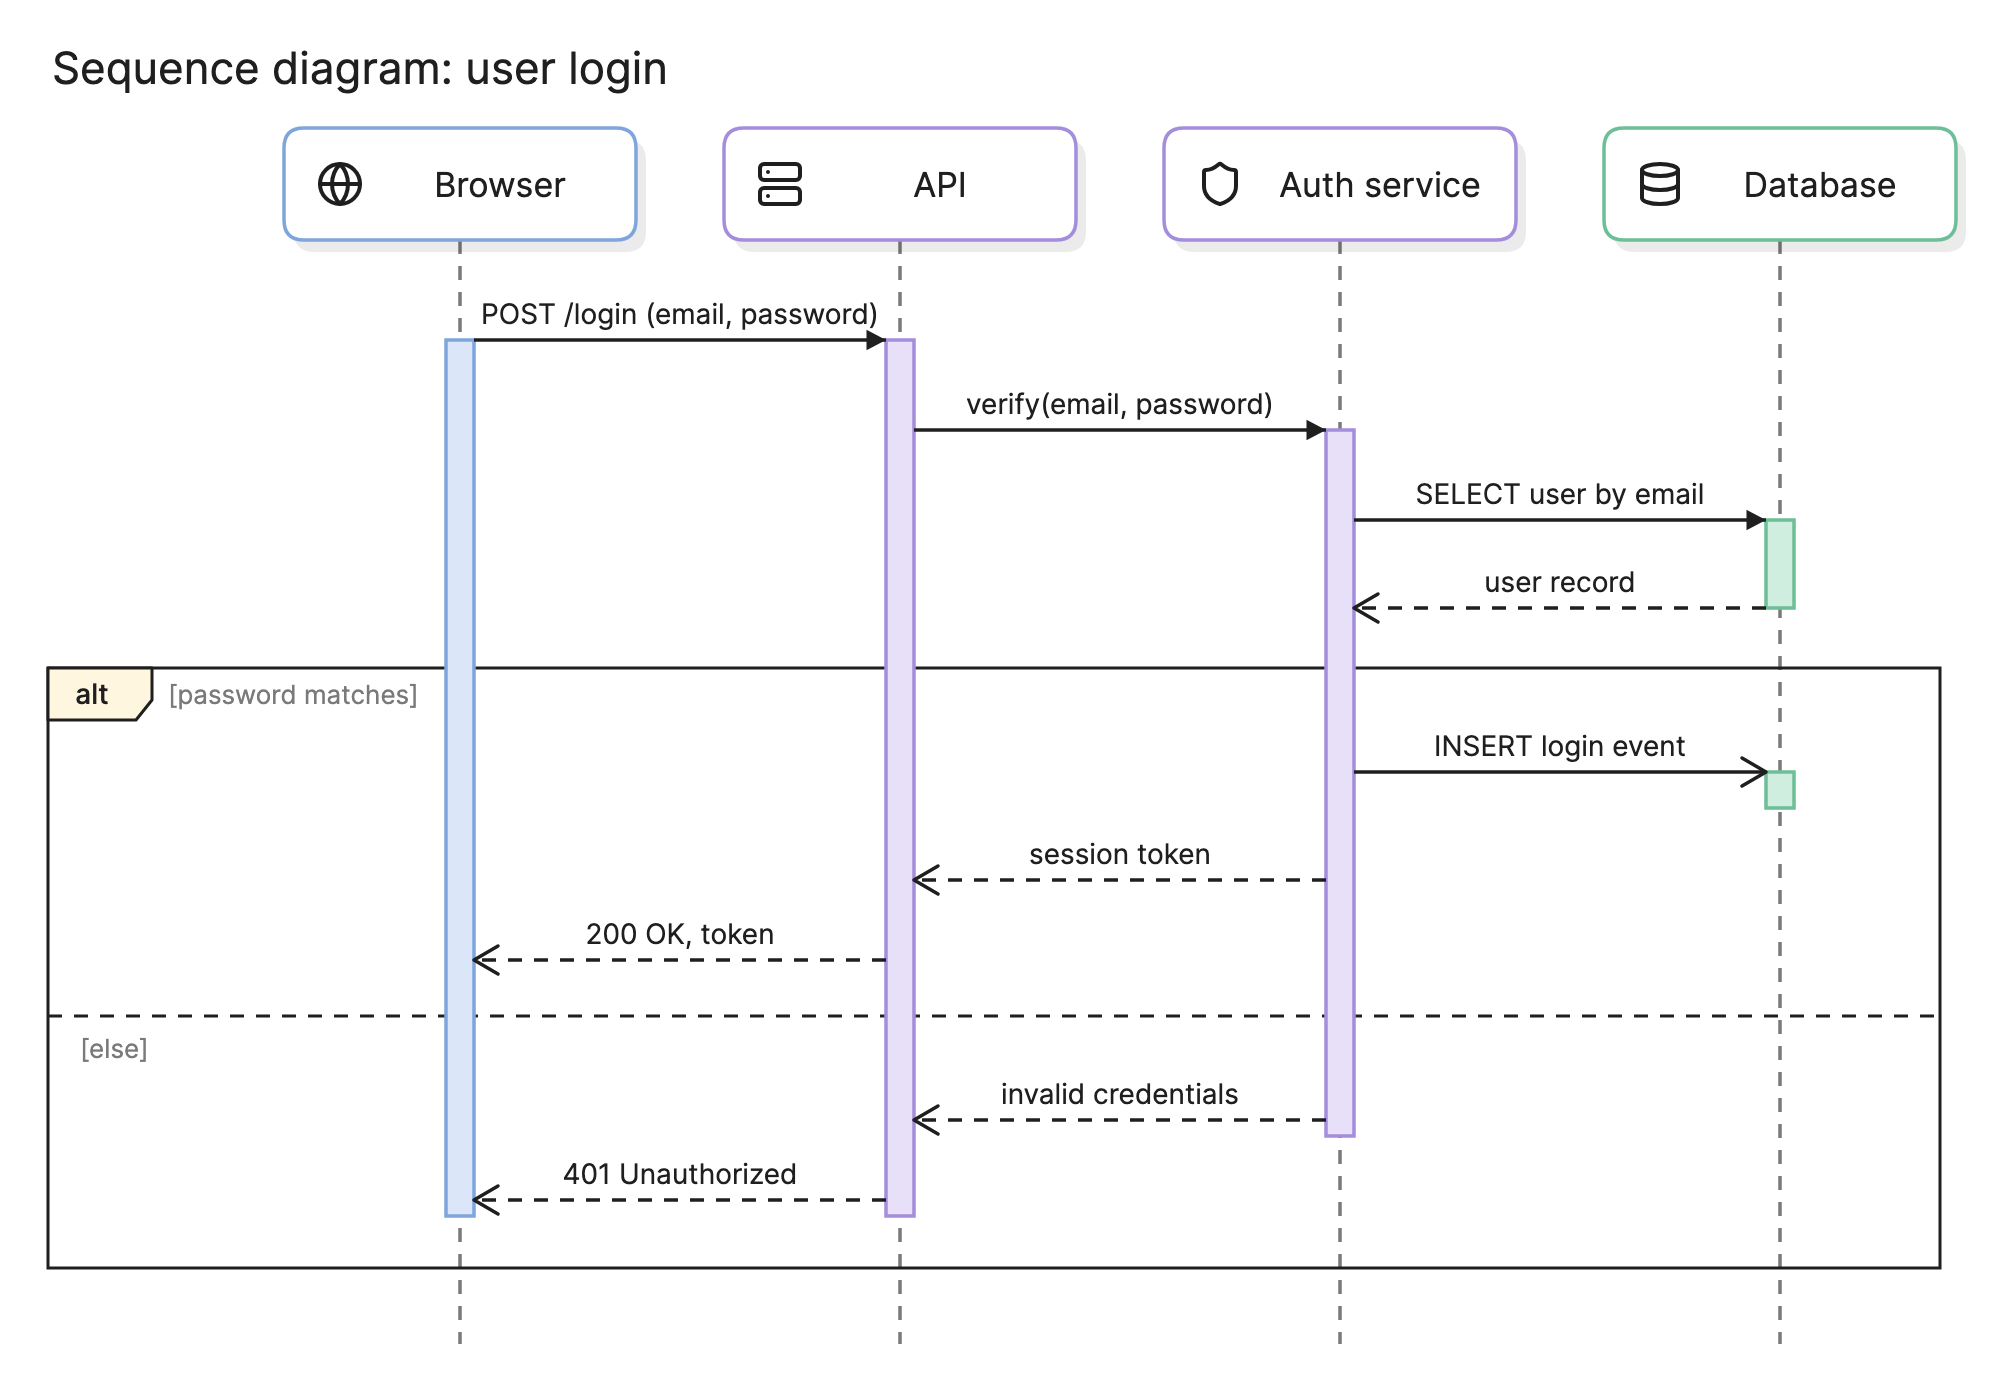
Sequence diagrams are the UML diagram engineers reach for when a flow crosses more than one system. A login, a checkout or a webhook touches a browser, an API, a couple of services and a database, and the diagram shows the whole exchange on one page in the order it happens.
When should you use a sequence diagram?
- Designing an API or integration. Agree on who calls whom, with what, and what comes back, before anyone writes a client.
- Explaining a request end to end. Show how a single user action moves through the services that handle it.
- Debugging a race or a timeout. Laying the calls out in time makes it obvious where a response is awaited and where it is not.
- Documenting an auth flow. OAuth, SSO and session handling are hard to explain in prose and easy to explain as messages.
What are the parts of a sequence diagram?
Lifelines
Each participant is a lifeline: a box with its name at the top and a dashed line running down the page. Participants can be people, systems, services, classes or data stores. In the example above there are four: the browser, the API, the auth service and the database.
Activation bars
The thin rectangles on a lifeline show when that participant is busy. The API’s bar starts when the login request arrives and ends when the response leaves. The database has two short bars, one per query, because it does nothing between them.
Messages
Messages are the arrows between lifelines, and the arrow style says what kind of call it is.
| Message | Line and arrowhead | Meaning |
|---|---|---|
| Synchronous | Solid line, filled arrowhead | The sender waits for a reply |
| Asynchronous | Solid line, open arrowhead | The sender continues without waiting |
| Return | Dashed line, open arrowhead | The reply to an earlier synchronous message |
| Self-message | An arrow that loops back to the same lifeline | The participant calls itself |
A message carries a label, often the method or endpoint and its arguments, such as POST /login (email, password). Return messages are usually labeled with what comes back.
Combined fragments
A fragment is a frame around part of the diagram with an operator in the corner. alt shows alternatives with a guard on each, opt shows an optional block, loop shows repetition and par shows blocks that run at the same time. The login example uses alt to show the two outcomes of a password check.
How do you read a sequence diagram?
Start at the top left and read down. In the login example the browser sends POST /login to the API with a solid, filled arrowhead, so the browser waits. The API calls verify on the auth service in the same way, and the auth service queries the database for the user. The dashed arrow back is the return: the user record.
The alt frame is where the flow splits. In the top section, guarded by [password matches], the auth service inserts a login event into the database with an open arrowhead. That message is asynchronous: the auth service does not wait for the insert to finish, and there is no return arrow. It then returns a session token to the API, which returns 200 OK and the token to the browser.
Below the dashed divider, in the [else] section, the auth service returns “invalid credentials” and the API responds with 401 Unauthorized.
How do you create a sequence diagram?
- Name the scenario. One diagram covers one scenario, such as “user logs in with a password”. Write it as the title.
- List the participants. Put the one that starts the interaction on the left and order the rest roughly by when they first appear.
- Write the messages in order. Start with the happy path from the first request to the final response.
- Mark each message as sync, async or return. This is where most of the meaning lives, so be deliberate.
- Add activation bars. They show which participants are waiting and for how long.
- Add the failure paths. Use
altandoptfragments for errors, timeouts and retries that matter.
What are common sequence diagram mistakes?
- Too many participants. More than six or seven lifelines makes the arrows hard to follow. Group minor participants or draw a second diagram.
- Every call on one diagram. Logging, metrics and caching calls bury the flow. Show them only if they are the point.
- Wrong arrowheads. A filled arrowhead on a message the sender does not wait for tells a different story from the real one.
- Missing returns. If a synchronous call has no return, readers cannot tell what the caller got back.
- No error path. The failure branch is often where the design has gaps. Draw at least the most likely one.
How does a sequence diagram compare with other diagrams?
| Diagram | What it shows | Use it when |
|---|---|---|
| Sequence diagram | Messages between participants, ordered in time | The question is who calls whom, and in what order |
| Communication diagram | The same messages, laid out by the links between participants | The structure of the links matters more than the timing |
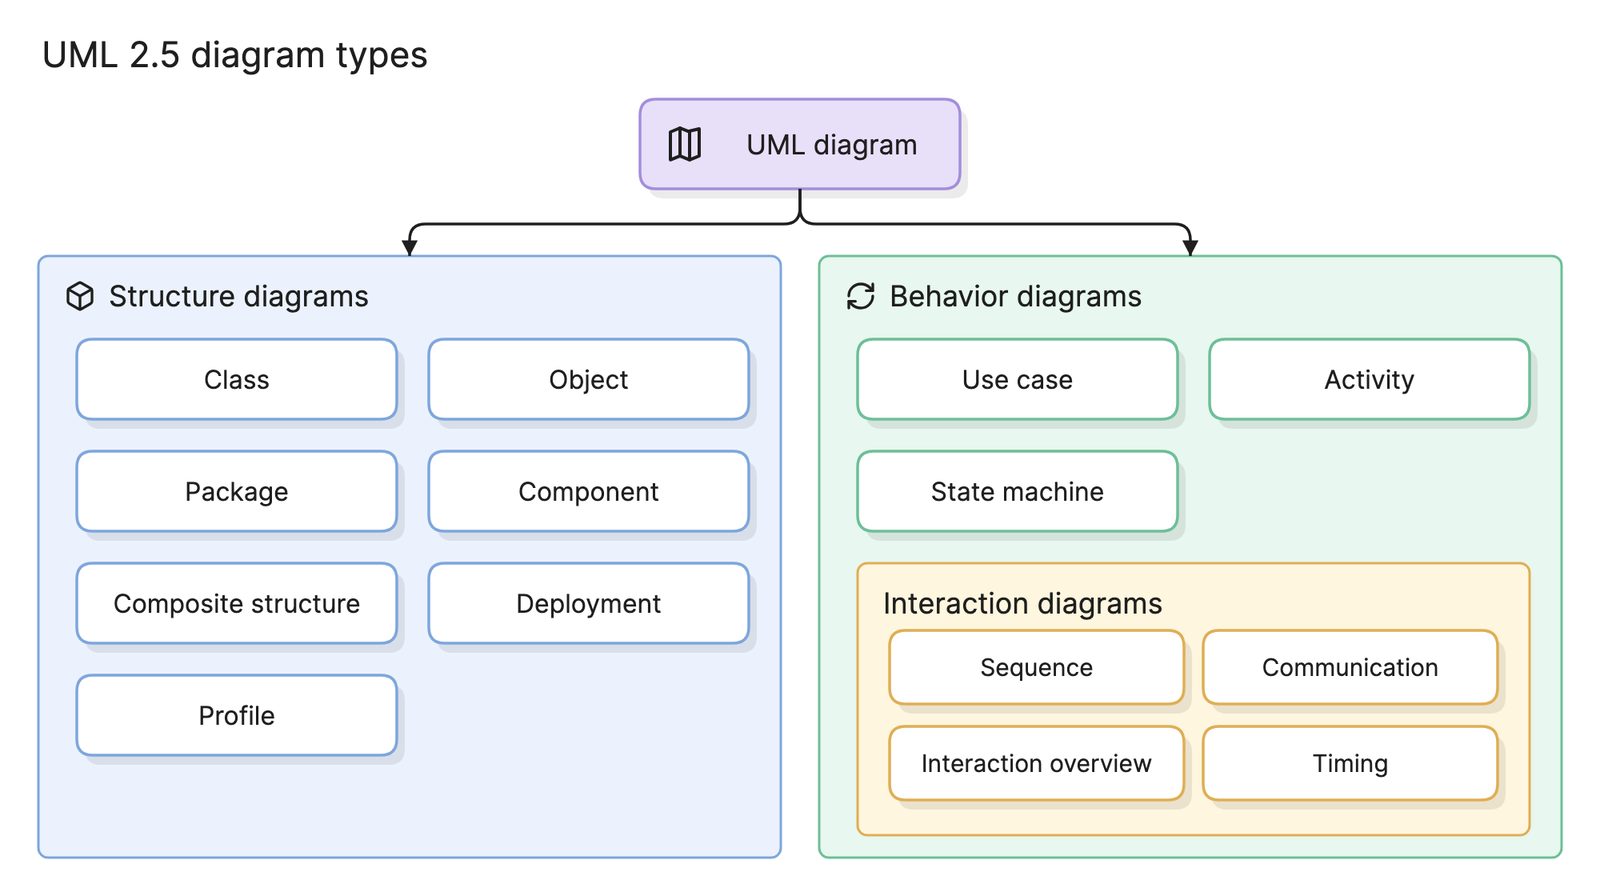
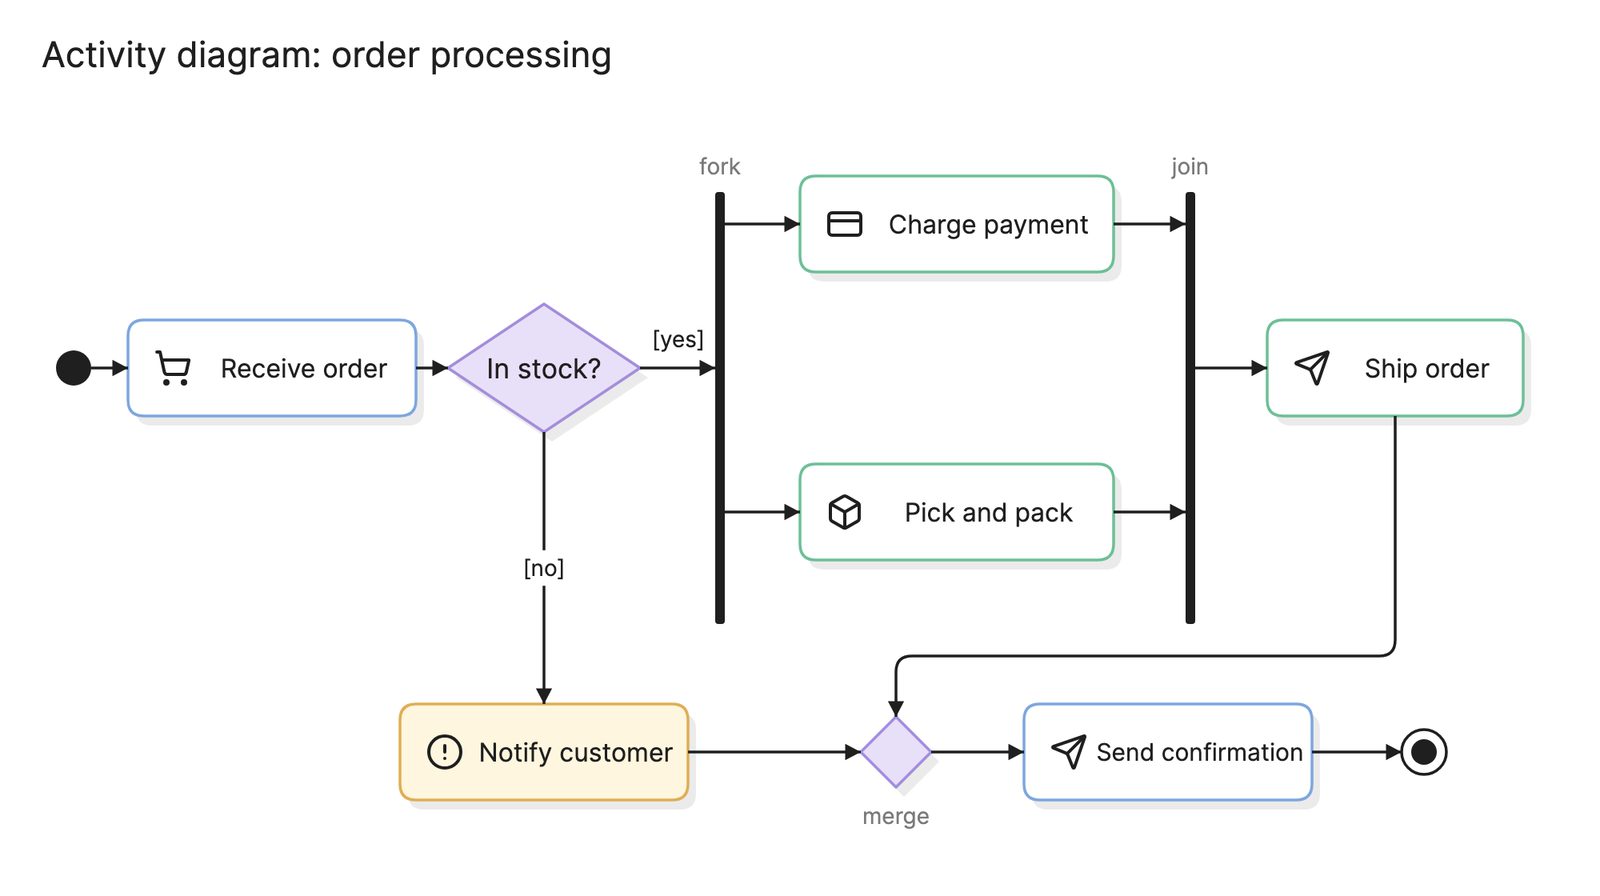
| Activity diagram | The flow of actions, with decisions and parallel paths | The question is what happens, not which component does it |
| Flowchart | Steps and decisions in one process | The audience is not technical, or there is only one actor |
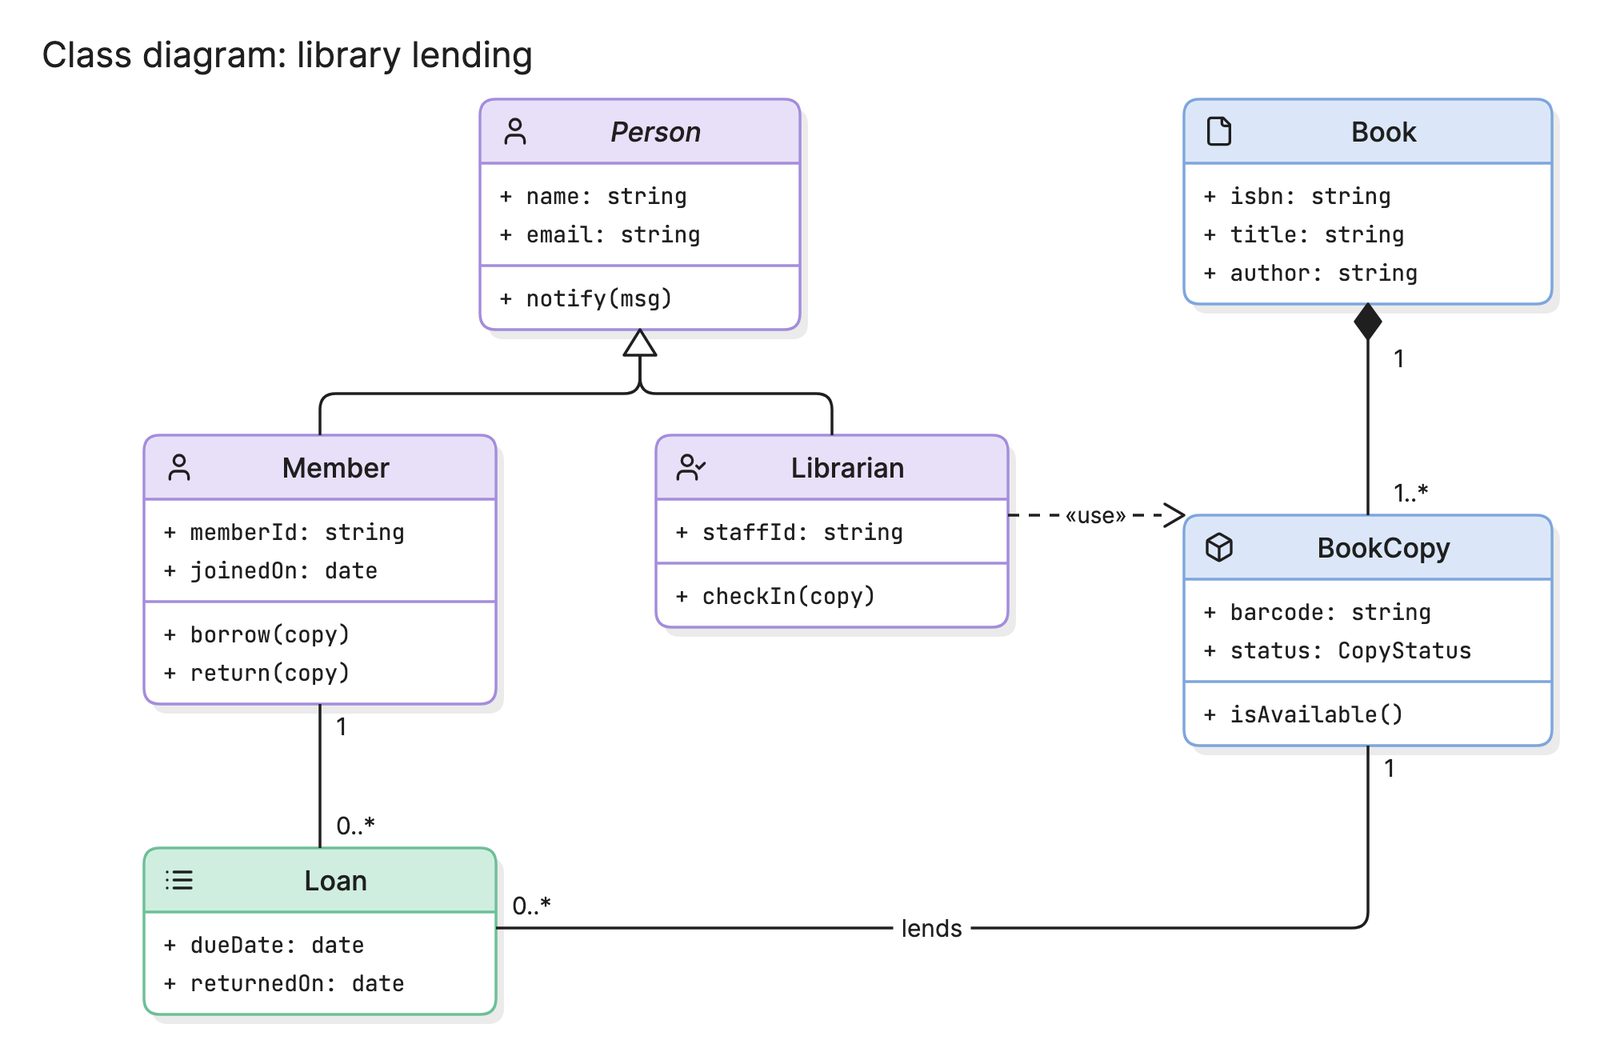
| Class diagram | Static structure of classes | You want to show what exists, not what happens |
What tools can you use to make a sequence diagram?
- Diagram-as-code tools. PlantUML and Mermaid both have a compact sequence syntax with automatic layout, which suits diagrams that live in a repository.
- Drag-and-drop diagramming tools. These give you control over spacing and styling, at the cost of moving every arrow by hand when a step is added.
- AI diagramming tools. Tools like Eraser take a written flow, a code snippet or a log and return a sequence diagram you can keep editing, which is the fastest route when the flow is already described somewhere.
For more on this kind of diagram, see API diagrams.
Frequently asked questions
-
What is the difference between a sequence diagram and a flowchart?
A flowchart shows the steps and decisions in one process, with no sense of who performs each step. A sequence diagram shows several participants and the messages between them, ordered in time. Use a flowchart for logic and a sequence diagram for interactions between systems.
-
What is the difference between a sequence diagram and an activity diagram?
Both are UML behavior diagrams. An activity diagram follows the flow of work, with decisions, parallel paths and optional swimlanes. A sequence diagram follows the messages between specific participants. If the question is "who calls whom, and in what order?", draw a sequence diagram.
-
What is a lifeline in a sequence diagram?
A lifeline is one participant in the interaction: a user, a browser, a service, a class or a database. It is drawn as a box at the top with a dashed line running down the page. Messages are arrows between lifelines, and the vertical position of each arrow gives its place in time.
-
How do you show a loop or a condition in a sequence diagram?
With a combined fragment, which is a labeled frame around part of the diagram.
altshows alternatives separated by a dashed line, each with a guard in square brackets.optshows a block that runs only if its guard is true.loopshows a block that repeats.parshows blocks that run in parallel.