Diagram types
UML diagram
A UML diagram is a visual model of a software system drawn in the Unified Modeling Language, a standard notation for describing structure and behavior.
Teams use UML diagrams because the notation is shared. An engineer in one company can read a class diagram drawn in another without a legend, which makes UML a practical choice for design reviews, documentation and interviews.
When should you use a UML diagram?
- Designing before building. Agree on the classes, services and interactions while they are still cheap to change.
- Explaining an existing system. A few diagrams can replace a long walkthrough of the code for a new team member.
- Writing a design document. Diagrams of structure and behavior give reviewers something concrete to question.
- Working with a precise notation. When “a box with a line” is too vague, UML gives every symbol one meaning.
- Generating code or models. Some tools turn a class diagram into code skeletons, or draw one from the code.
What are the types of UML diagram?
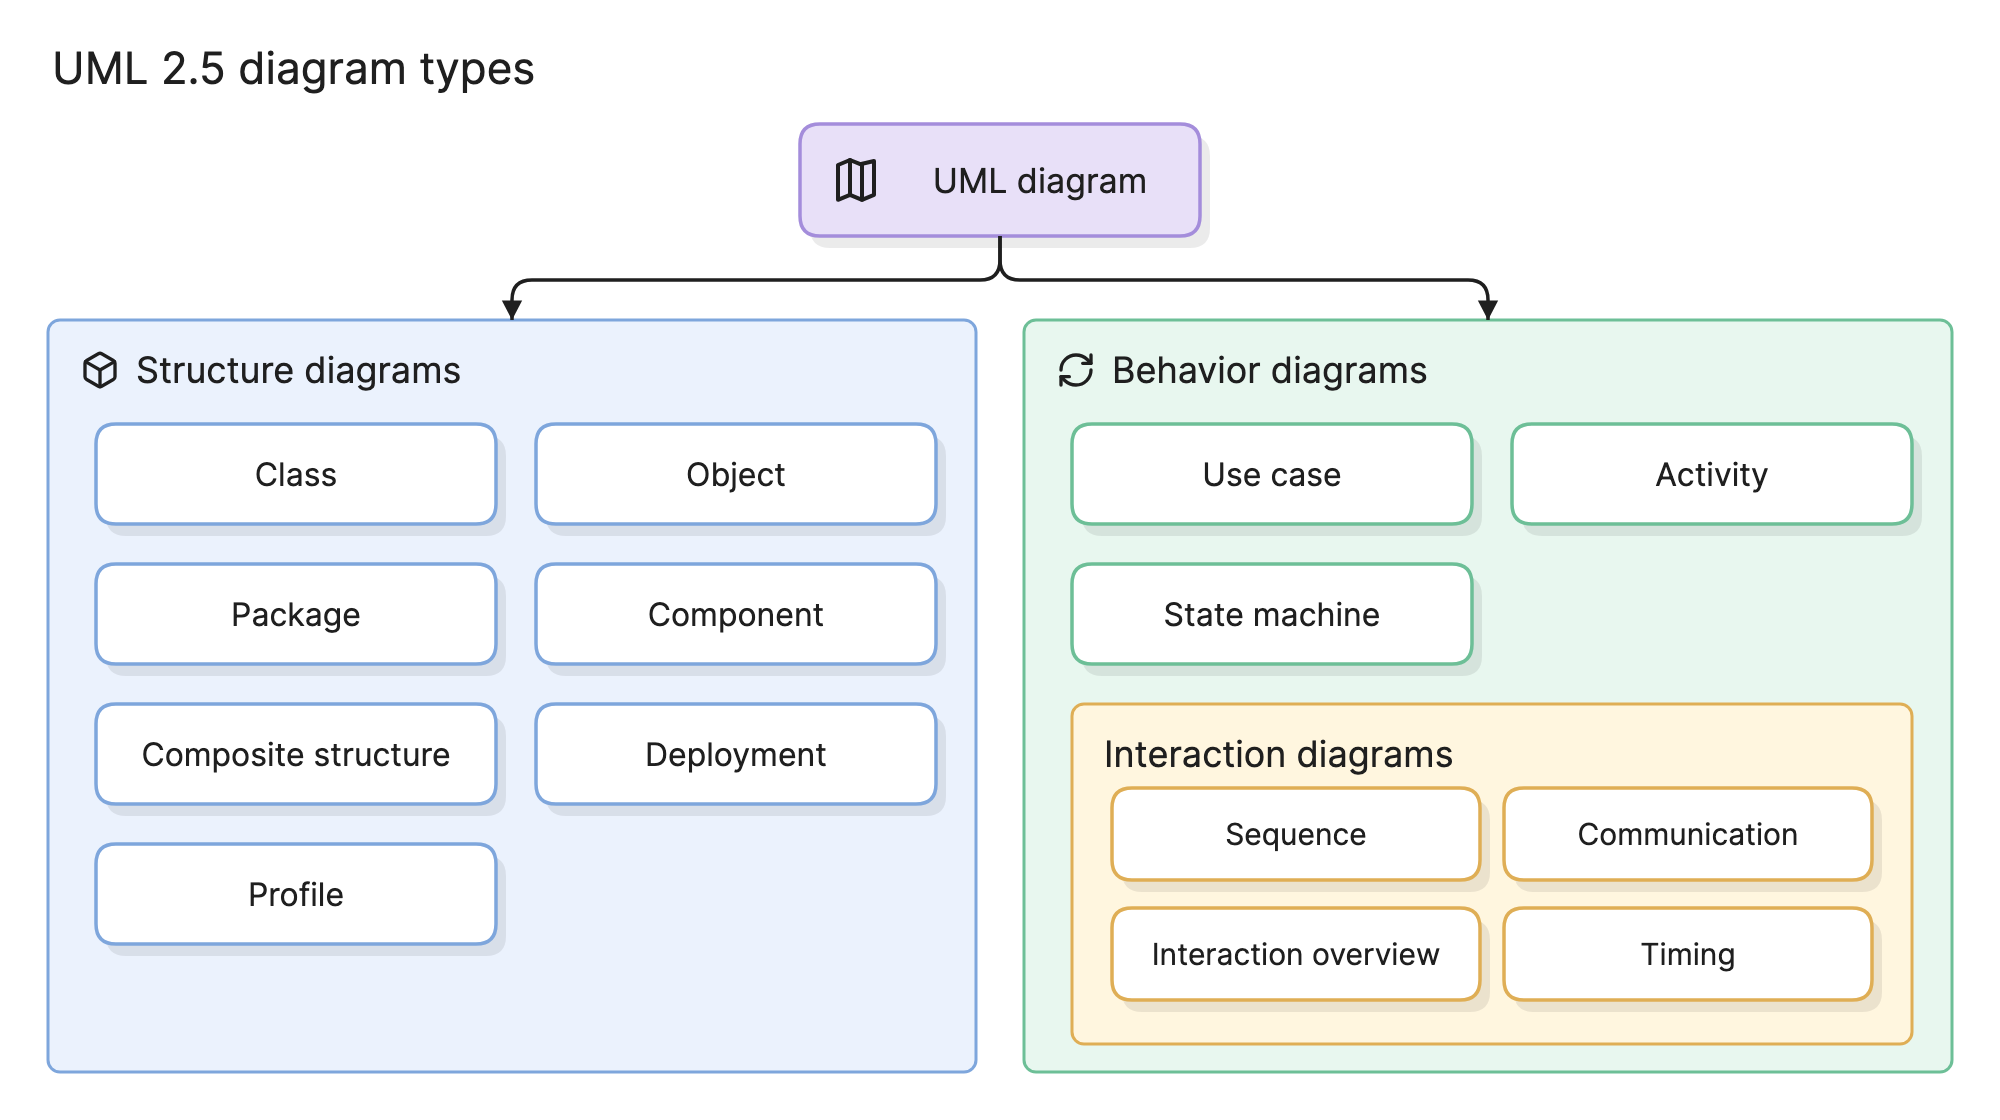
UML 2.5 defines 14 diagram types in two families. Structure diagrams show what a system is made of. Behavior diagrams show what it does over time.
Structure diagrams
| Diagram | What it shows |
|---|---|
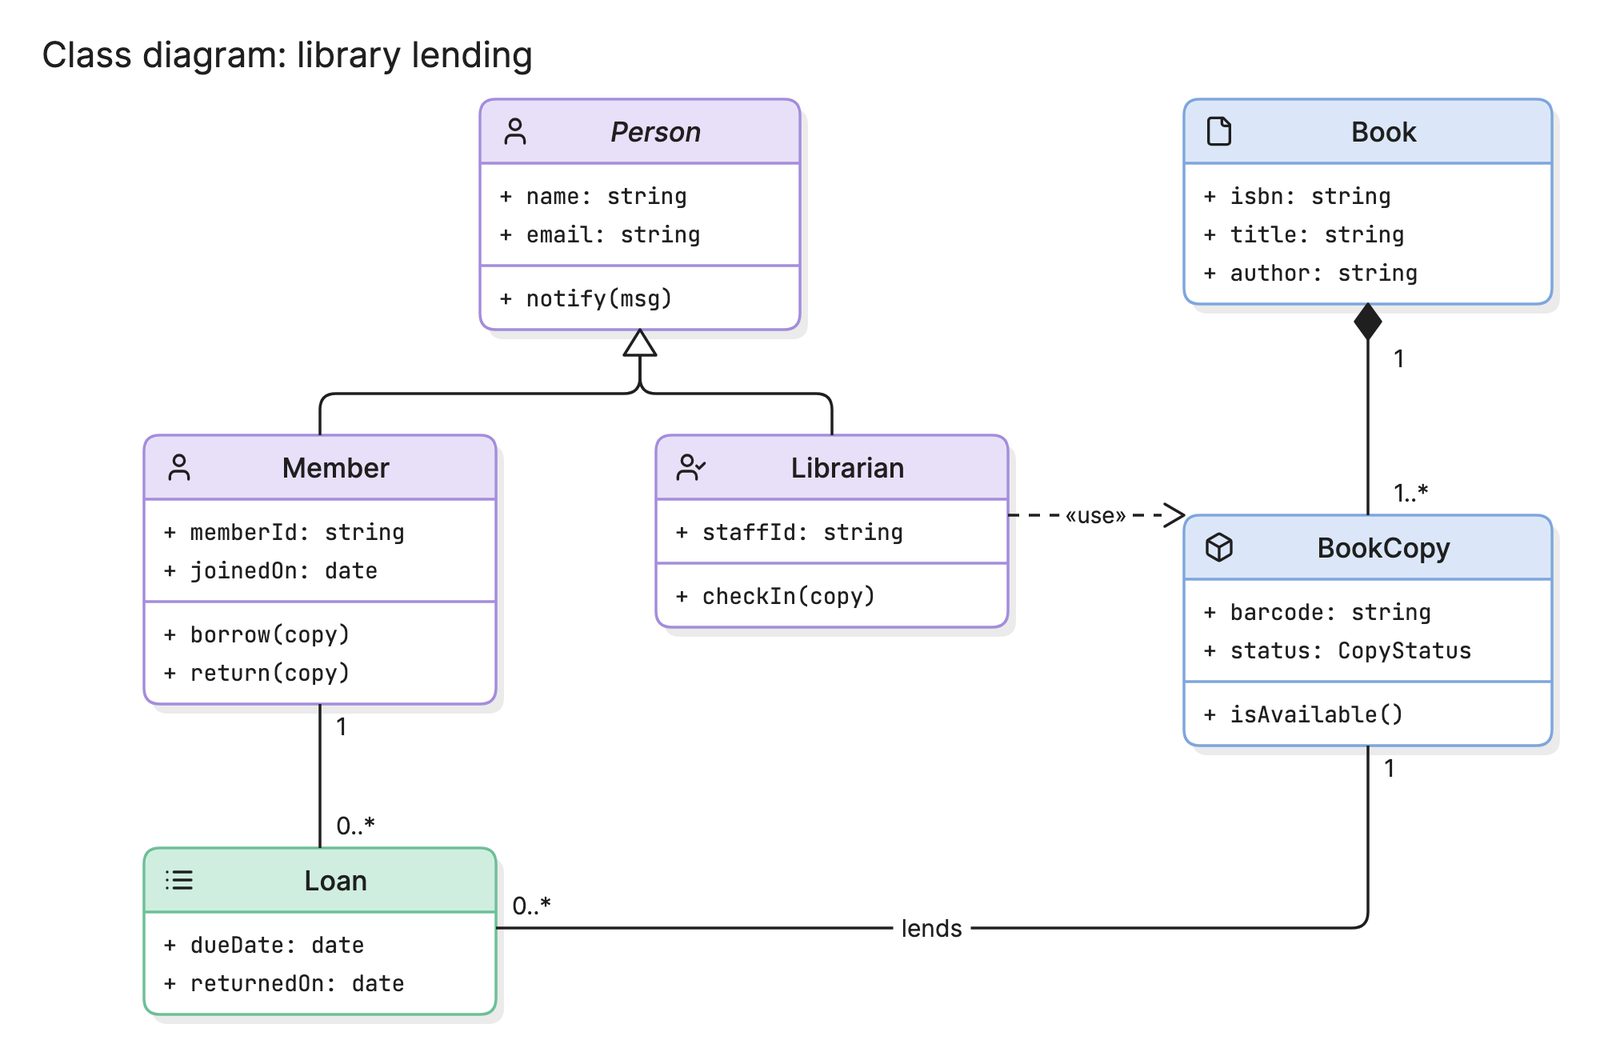
| Class diagram | Classes, their attributes and operations, and the relationships between them |
| Object diagram | A snapshot of specific objects and their values at one moment |
| Package diagram | How classes are grouped into packages or namespaces, and the dependencies between groups |
| Component diagram | The components of a system and the interfaces they provide and require |
| Composite structure diagram | The internal parts of a class or component and how they connect |
| Deployment diagram | Where software runs: the nodes, devices and execution environments |
| Profile diagram | Custom stereotypes that extend UML for a particular domain |
Behavior diagrams
| Diagram | What it shows |
|---|---|
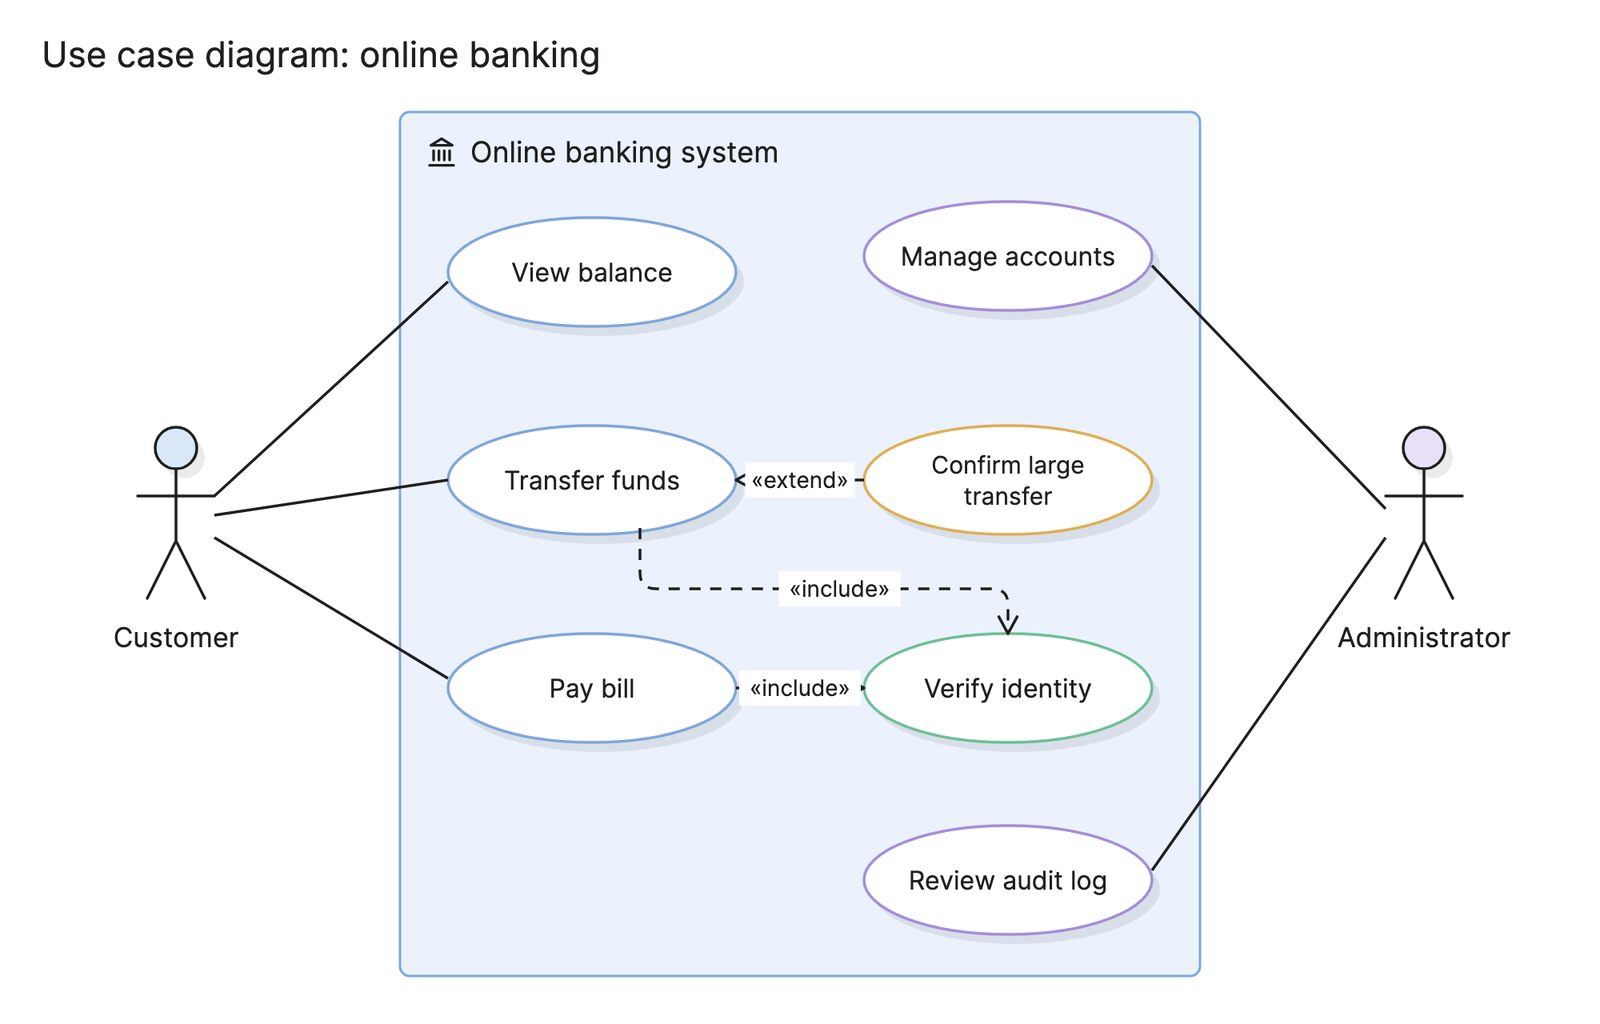
| Use case diagram | What the system does for each kind of user, and where the system boundary sits |
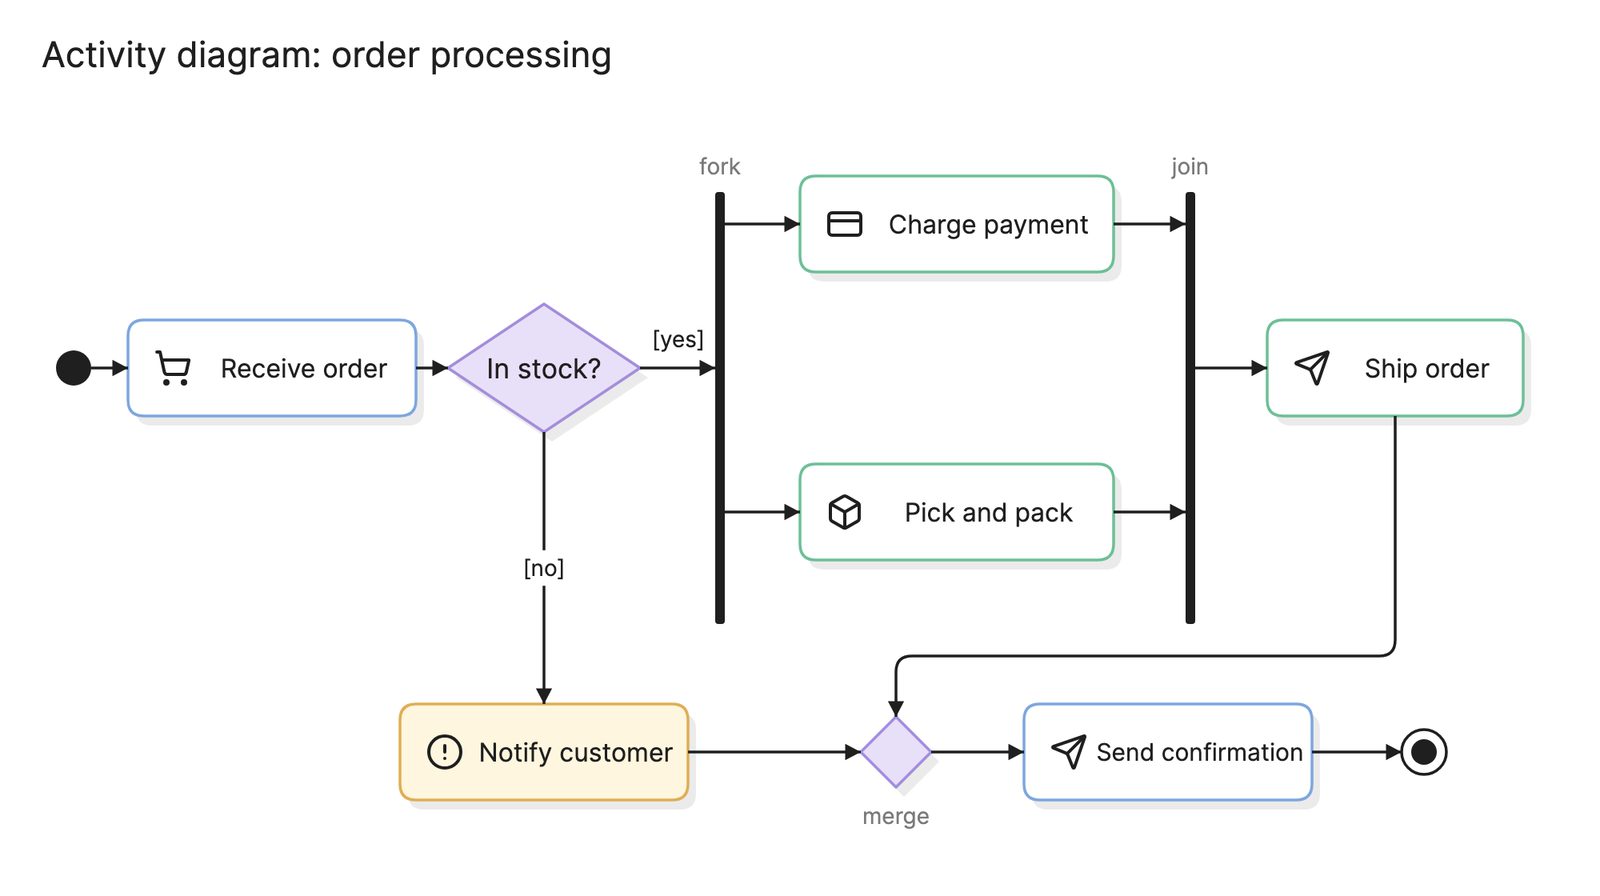
| Activity diagram | The flow of actions in a process, with decisions, parallel paths and swimlanes |
| State machine diagram | The states one object can be in and the events that move it between them |
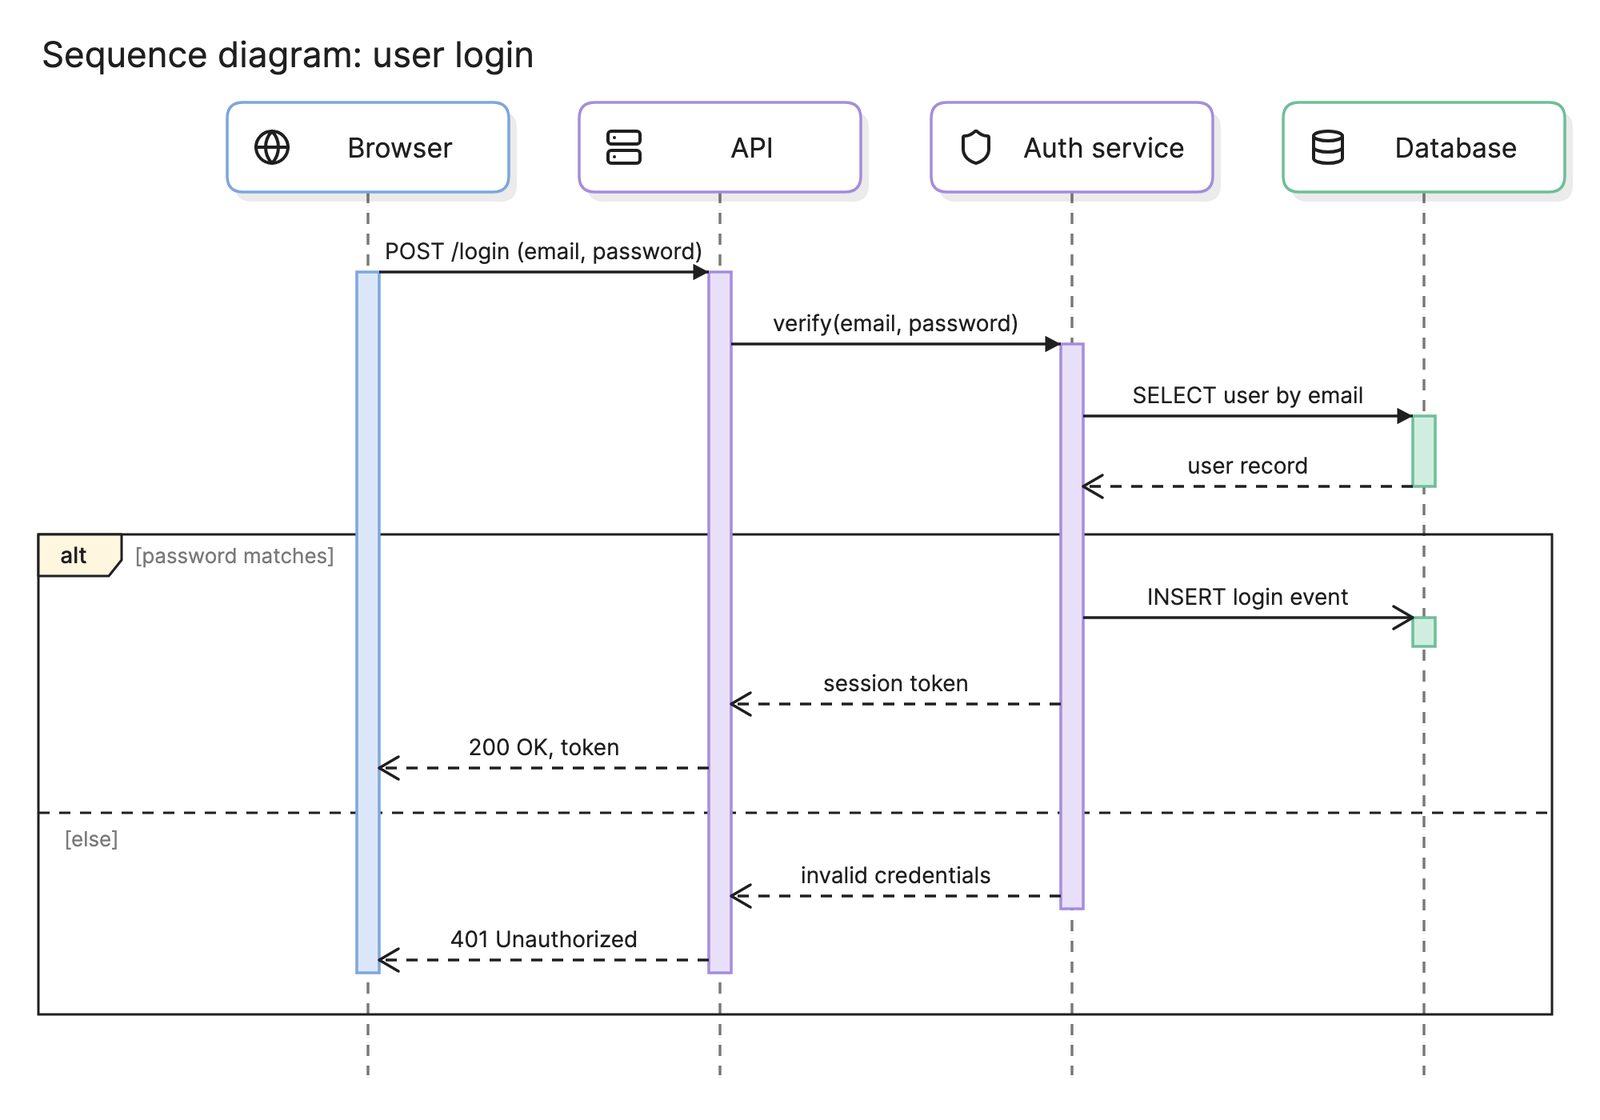
| Sequence diagram | Messages between objects or services, ordered in time down the page |
| Communication diagram | The same interactions as a sequence diagram, laid out by the links between objects instead of by time |
| Interaction overview diagram | An activity diagram whose nodes are themselves interaction diagrams |
| Timing diagram | How the state of an object changes over a timeline, often used for real-time systems |
The last four are called interaction diagrams because they all describe messages between parts of a system. In practice the sequence diagram is the one almost everyone uses, and the other three are rare.
Most teams rely on four or five types and ignore the rest: class diagrams for the model, sequence diagrams for a request end to end, use case diagrams for scope, activity diagrams for processes and state machine diagrams for anything with a lifecycle. Component and deployment diagrams appear in architecture documents, though many teams now draw those as architecture diagrams or with the C4 model instead.
How do you read a UML diagram?
Start by working out which type you are looking at, because the same shape means different things in different diagrams. A rectangle is a class in a class diagram, a node in a deployment diagram and an action in an activity diagram. If the diagram has a timeline running down the page, it is an interaction diagram; if the boxes have compartments, it is a class diagram; if it has stick figures, it is a use case diagram.
Then read the lines, because UML puts most of its meaning in the line ends. A hollow triangle means inheritance, a filled diamond means composition and a dashed line with an open arrowhead means a dependency. The term pages linked above cover each notation in detail.
How do you create a UML diagram?
- Decide the question. “What are the main classes?” needs a class diagram. “What happens when a user logs in?” needs a sequence diagram. One diagram answers one question.
- Pick the diagram type to match. Use the tables above, and resist drawing every type for one system.
- Collect the elements. Pull class names from the code, actors from the requirements or steps from the people who run the process.
- Draw the elements, then the relationships. Place the boxes first and keep the lines short and uncrossed where you can.
- Use the standard notation. A correct arrowhead saves a sentence of explanation.
- Review it with someone who did not draw it. If they read something different from what you meant, fix the diagram, not the reader.
What are common UML diagram mistakes?
- Modeling everything. A complete UML model of a real system is enormous and goes stale within weeks. Draw the parts that are hard to understand from the code.
- Mixing diagram types. Putting actors in a class diagram or lifelines in an activity diagram leaves readers unsure what the symbols mean.
- Using the wrong arrowhead. Inheritance, dependency and association look alike from a distance but mean different things.
- No owner. A diagram nobody maintains is wrong soon after it is drawn. Keep it in the repository, ideally as diagram-as-code, so it changes with the system.
How does UML compare with other diagrams?
| Diagram | Standard? | Best for |
|---|---|---|
| UML diagram | Yes, defined by the Object Management Group | Software structure and behavior with precise meaning |
| Flowchart | Loosely, from ISO 5807 | Simple step-by-step logic for any audience |
| Entity relationship diagram | Several notations, none universal | Database tables and the relationships between them |
| C4 model | A convention, not a standard | Software architecture at four levels of zoom |
| BPMN | Yes, also from the Object Management Group | Business processes that need to be precise or executable |
What tools can you use to make a UML diagram?
- Diagram-as-code tools. PlantUML and Mermaid both have text syntaxes for the common UML types, and the source lives next to the code. The layout is automatic, which is fast but sometimes awkward.
- Drag-and-drop diagramming tools. These give you the full UML shape library and control over the layout. They suit polished diagrams for documents and slides.
- AI diagramming tools. Tools like Eraser take a description or a code snippet and return a UML diagram you can keep editing, either on the canvas or as PlantUML or Mermaid code.
For more on this kind of diagram, see design docs.
Frequently asked questions
-
What does UML stand for?
UML stands for Unified Modeling Language. It was created in the mid-1990s by Grady Booch, Ivar Jacobson and James Rumbaugh, who merged their three competing methods into one notation. The Object Management Group has maintained it as a standard since 1997, and the current version is UML 2.5.1.
-
Is UML still used?
Yes, but selectively. Few teams model a whole system in UML the way the original methodology intended. Most use a handful of diagram types informally, especially class diagrams, sequence diagrams and state diagrams, because the notation is widely understood and the tools are good.
-
What is the difference between a UML diagram and a flowchart?
A flowchart is a general-purpose diagram of steps and decisions with no formal standard behind it. UML is a defined language with 14 diagram types, each with its own symbols and rules. The UML activity diagram is the closest thing to a flowchart, and it adds parallel flows and swimlanes.
-
Which UML diagram should I learn first?
Start with the class diagram and the sequence diagram. Between them they cover the two questions most design discussions come down to: what are the parts of the system, and how do they talk to each other at runtime. Use case and activity diagrams are the next most useful.