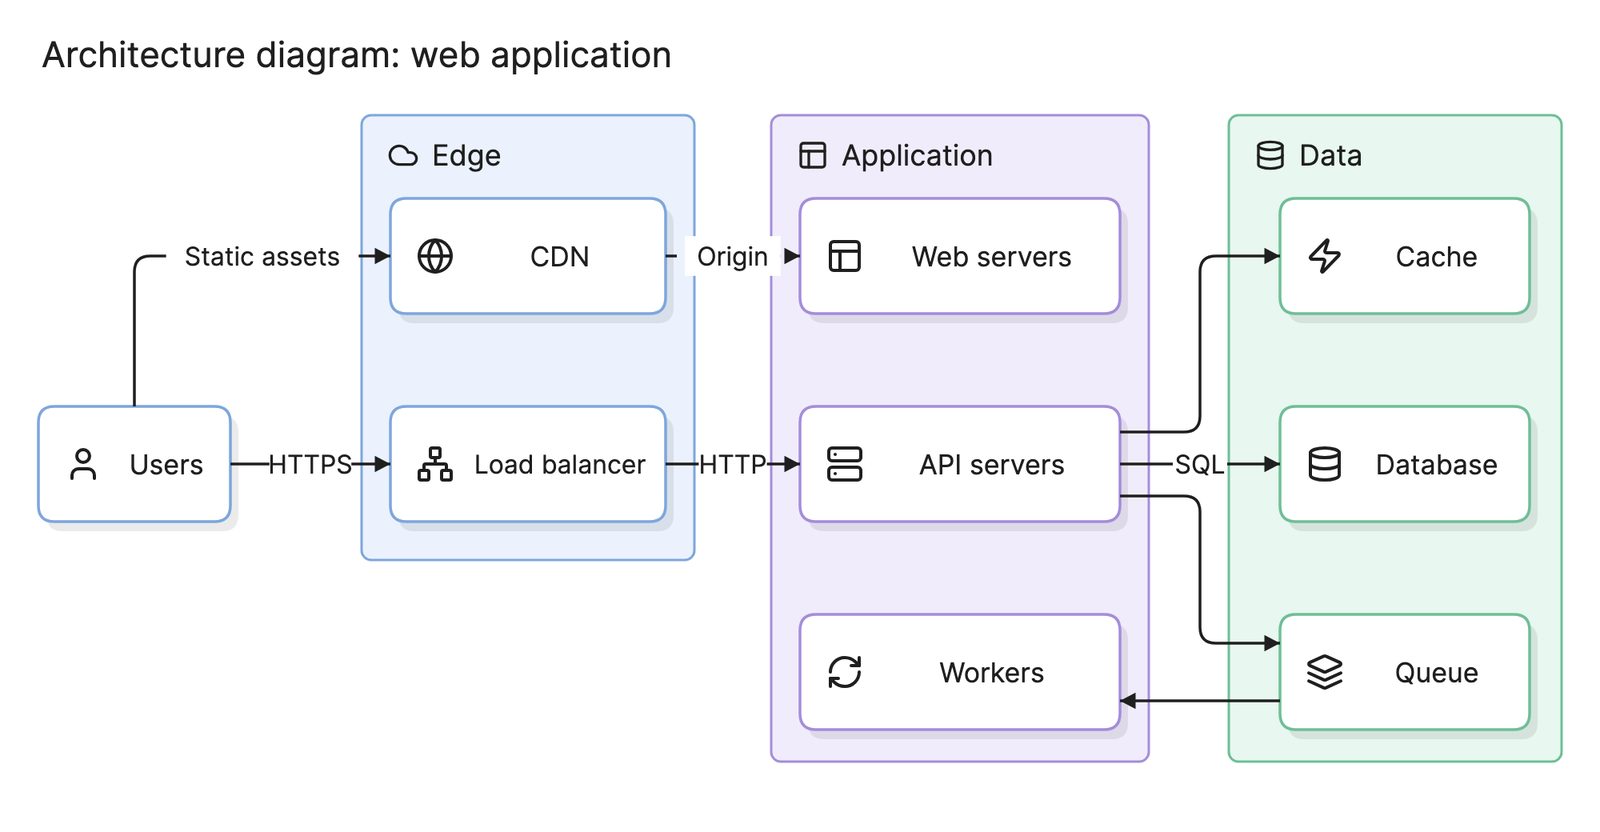
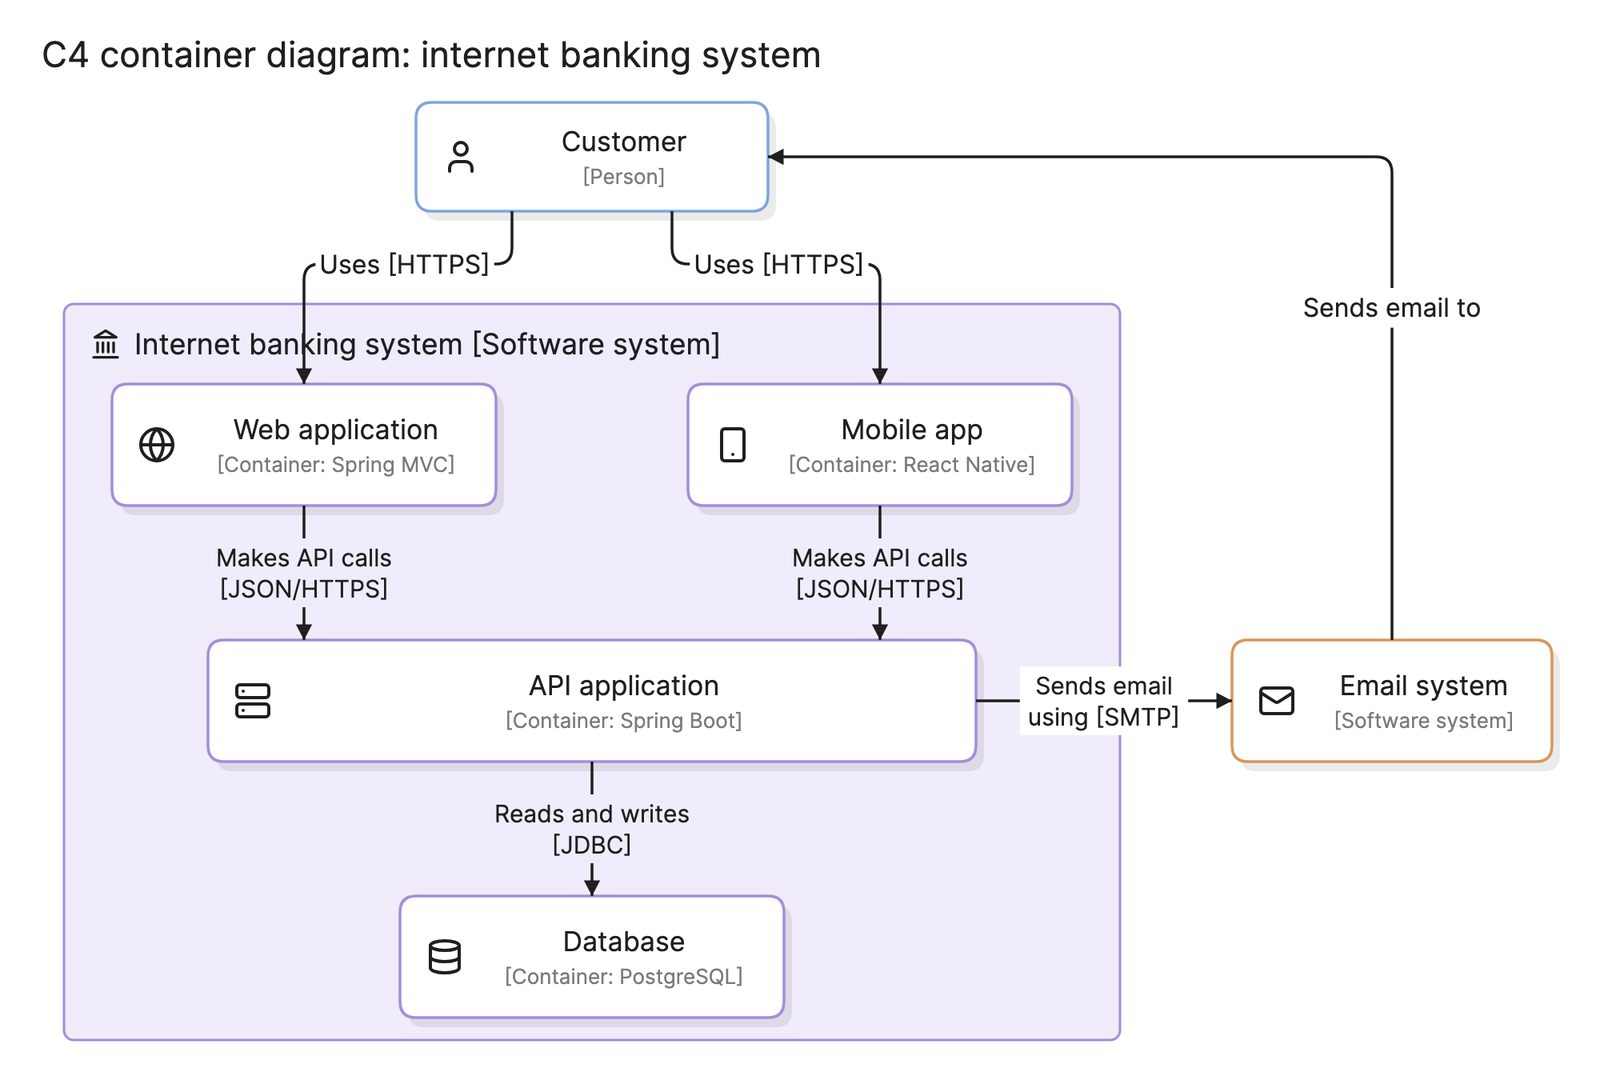
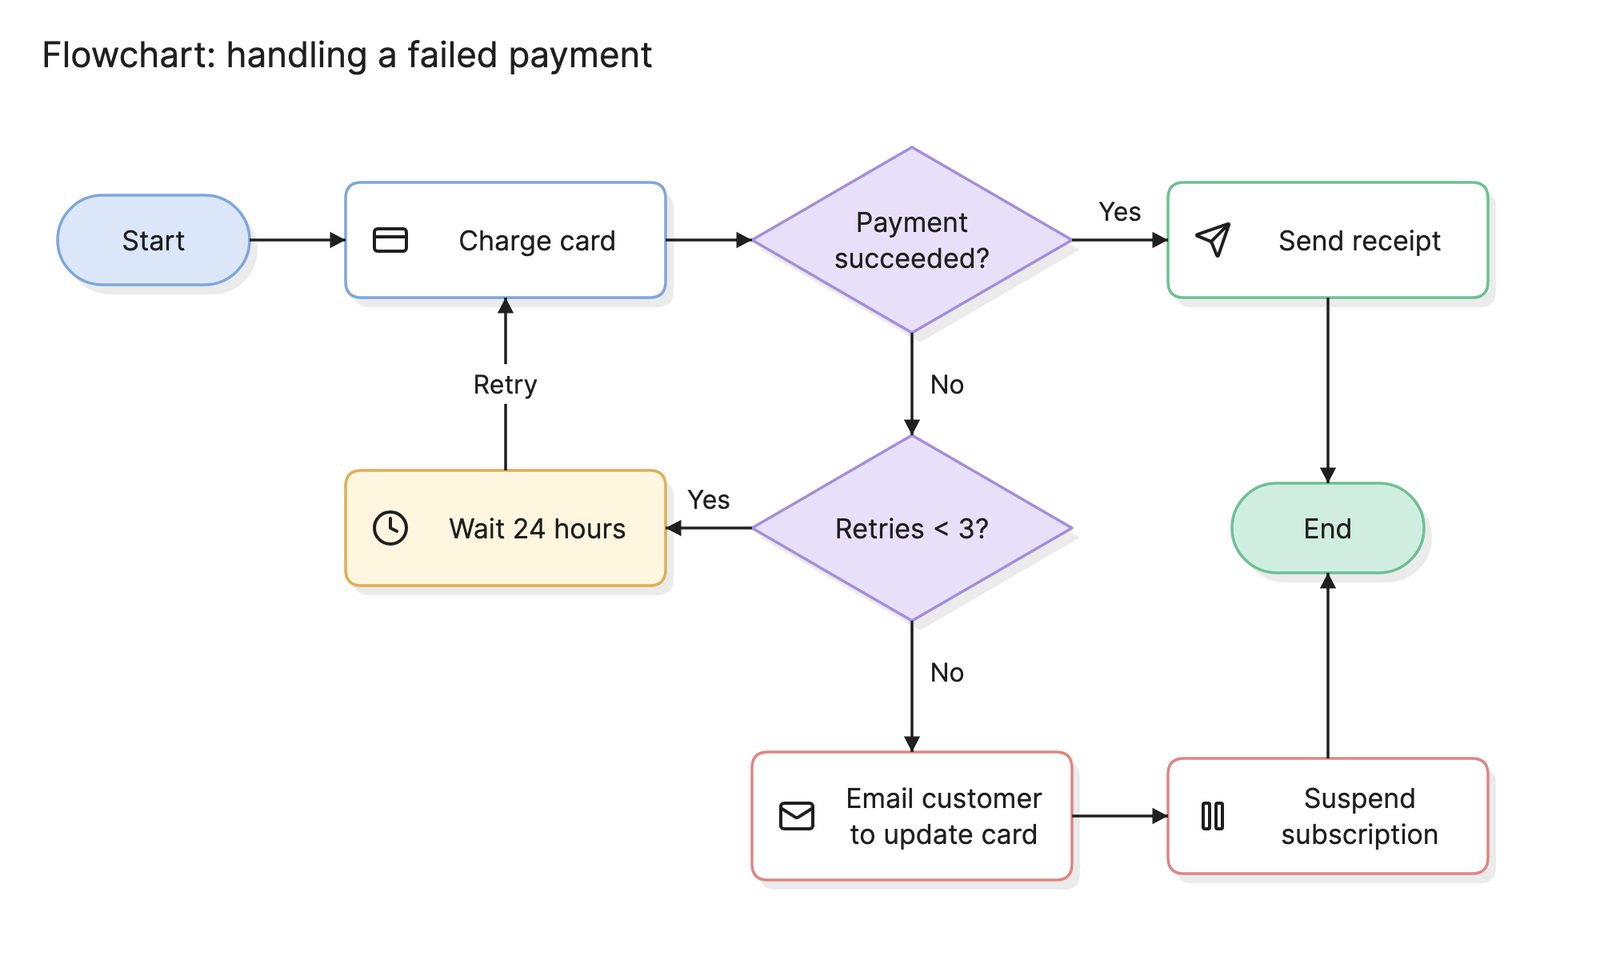
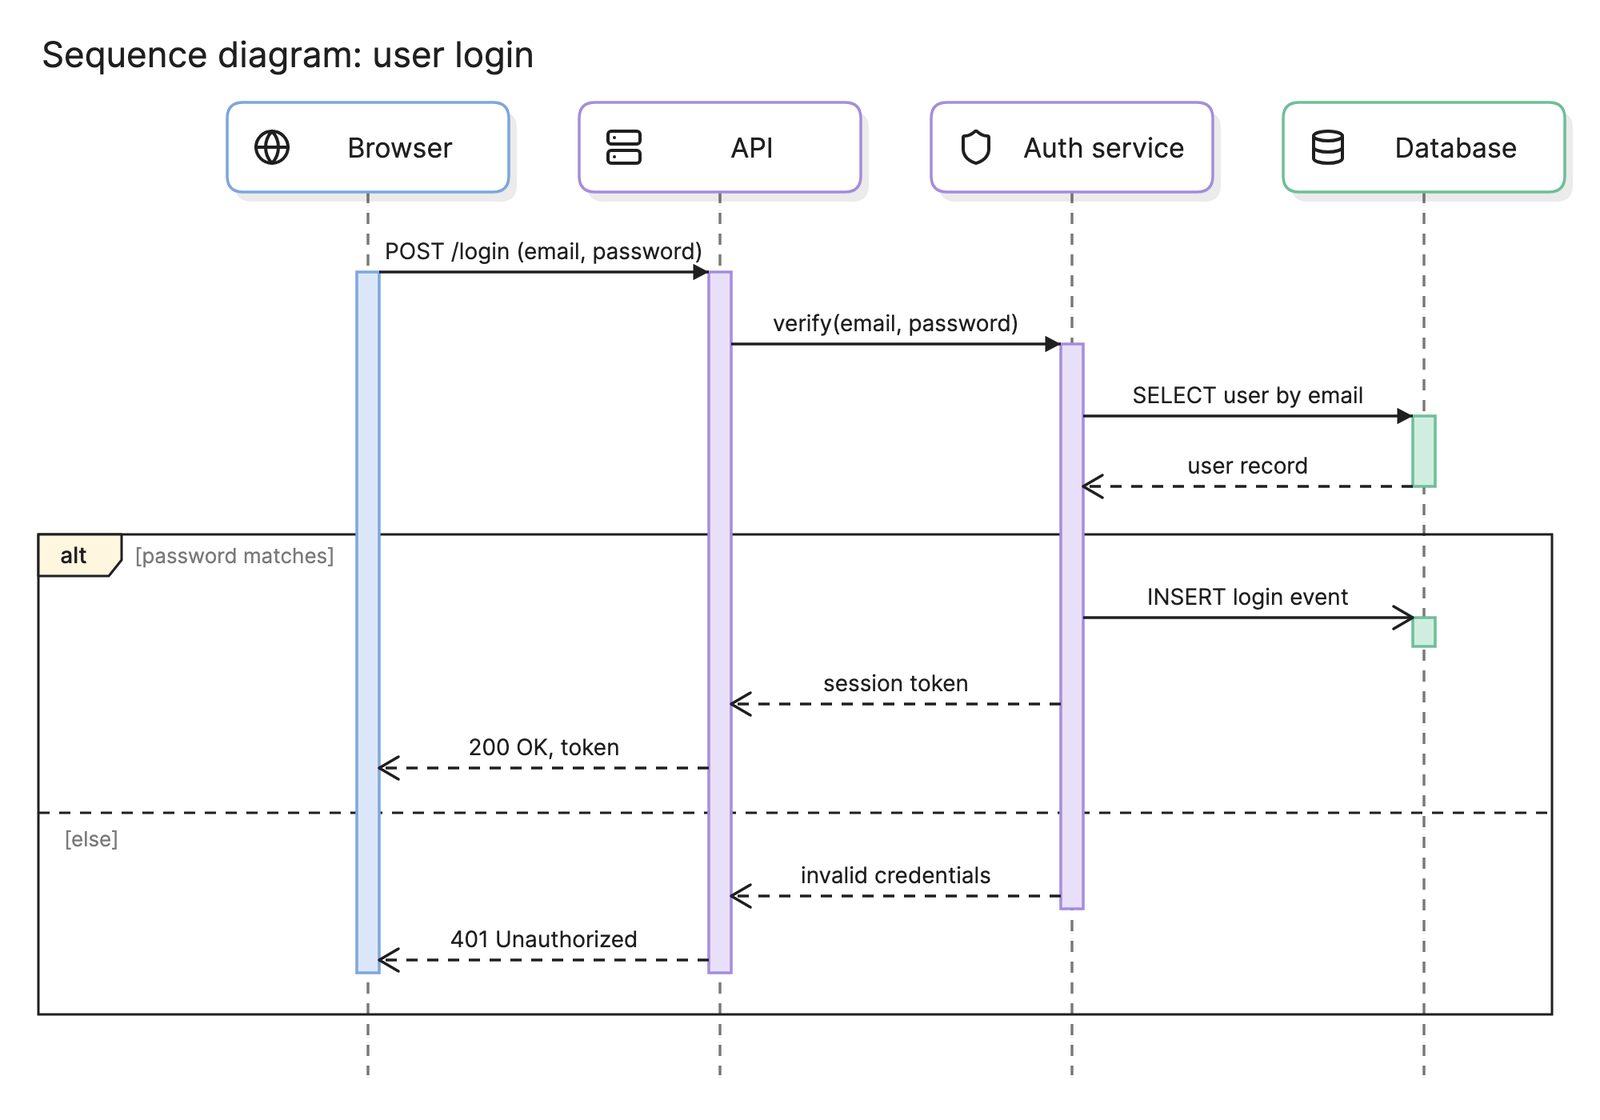
Diagram types
Diagram as code
Diagram as code is the practice of describing a diagram in plain text so that a tool renders it, and the text can be versioned, reviewed and reused like code.
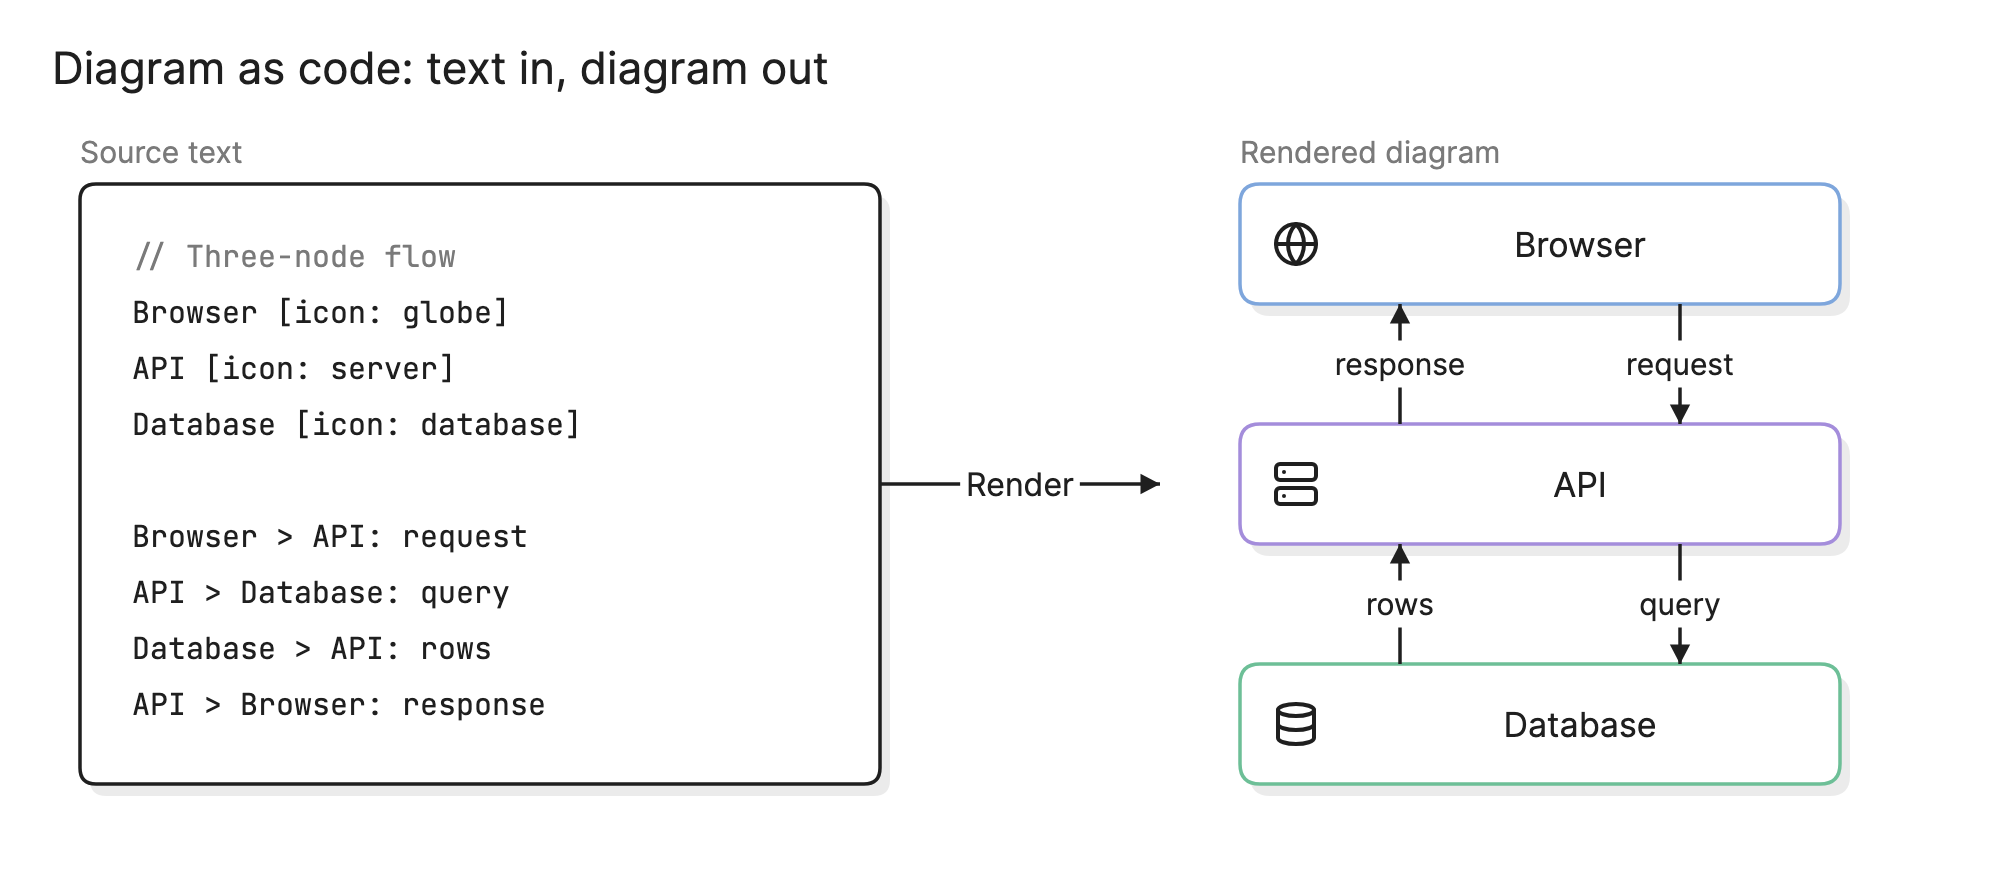
Engineers adopt diagram as code because a diagram that lives in a repository gets the same treatment as everything else there: it is diffed, reviewed, versioned and kept next to the code it describes. A picture in a shared drive gets none of that, which is why it is usually out of date.
When should you use diagram as code?
- Documenting software. Architecture, sequence and data model diagrams that should change when the code changes.
- Pull request reviews. A text diff shows exactly what moved, which a screenshot cannot.
- Generated diagrams. When a script can produce the diagram from a schema, an infrastructure file or a dependency list.
- Docs that build. READMEs and documentation sites that render the diagram at build time.
How does diagram as code work?
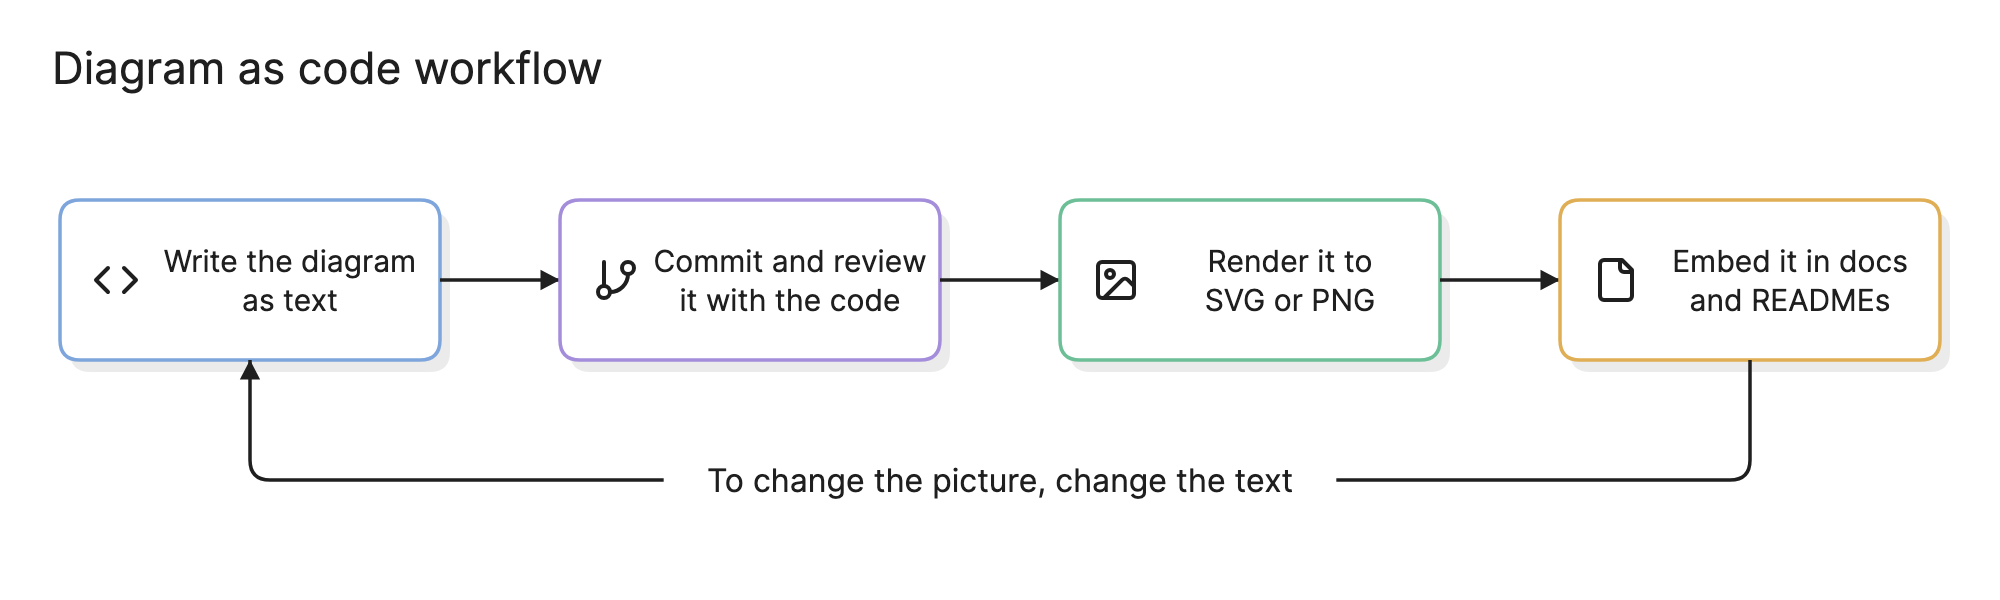
You write the diagram in a text language that declares the nodes and the connections between them, and a tool lays it out and renders it as SVG or PNG. The layout is automatic, so you describe what is in the diagram rather than where each shape sits. That is the trade: you lose pixel control and gain a source file that can be diffed, reviewed and generated.
The text is committed with the code and reviewed in the same pull request, then rendered by a build step or an editor plugin and embedded wherever it is needed. To change the picture, you change the text.
What languages can you write diagrams in?
| Language | Style | Strong at | Where it renders |
|---|---|---|---|
| Mermaid | Short, Markdown-friendly | Flowcharts, sequence diagrams, ERDs, Gantt charts | GitHub, GitLab, Notion, Obsidian, many docs tools |
| PlantUML | Verbose, UML-oriented | Every UML diagram type, plus C4 through an extension | IDE plugins, a Java renderer, many wikis |
| D2 | Modern, declarative | Architecture and system diagrams with a polished look | Its own CLI and playground |
| Graphviz (DOT) | Low-level, graph-oriented | Dependency graphs and any node-and-edge layout | A CLI and libraries in most languages |
| Eraser syntax | Short, per diagram type | Cloud architecture, sequence, ER and flow diagrams with icons | Eraser’s editor and API |
Pick the language by where the diagram needs to appear. If it must render inside GitHub or a wiki, Mermaid is the safe choice. If you draw full UML diagrams, PlantUML covers more of the notation. For architecture diagrams with cloud icons and groups, D2 and Eraser’s syntax need less text.
How do you read a diagram-as-code example?
Read the text at the top of this page from the top down. The first block declares three nodes, each with an icon: a browser, an API and a database. The second block declares the connections. Browser > API: request means draw an arrow from the browser to the API labeled “request”, and the remaining lines add the query to the database and the two responses coming back.
The rendered diagram on the right contains exactly that and nothing else. The tool chose the vertical layout, the spacing and the arrow routes. If you wanted a cache between the API and the database, you would add one node line and two connection lines, and the layout would adjust.
How do you create a diagram as code?
- Choose a language for where it will render. Mermaid for Markdown and wikis, PlantUML for UML, D2 or Eraser syntax for architecture.
- Declare the nodes first. Name each one and give it a type or icon before you draw any connections.
- Add the connections with labels. A line without a label tells the reader very little.
- Group related nodes. Most languages have a group or subgraph construct for services, environments or boundaries.
- Render it and look. Fix tangled edges by reordering declarations or adding direction hints rather than by fighting the layout engine.
- Commit it next to the code. Put the source in the repository and render it in the docs build, so the diagram is reviewed with the changes it describes.
What are common diagram-as-code mistakes?
- Trying to control the layout. If a diagram needs exact positions, it is probably a drag-and-drop diagram.
- One giant file. Split by system or by level, as the C4 model does, so each diagram answers one question.
- Committing the image instead of the source. The PNG is a build artifact. Store the text and generate the picture.
- No labels on edges. Automatic layout makes unlabeled arrows even harder to follow than in a hand-drawn diagram.
How does diagram as code compare with other approaches?
| Approach | How you make the diagram | Strengths | Weaknesses |
|---|---|---|---|
| Diagram as code | Write text, a tool renders it | Versioned, reviewable, generatable, consistent style | Limited layout control, a syntax to learn |
| Drag-and-drop | Place and connect shapes by hand | Full control, easy for anyone to start | Hard to diff, drifts from the code, slow to update |
| Generated from source | A tool reads code, a schema or infrastructure and draws it | Always accurate for what exists | Often cluttered, no room for intent or omission |
| AI-assisted | Describe the diagram in plain language | Fast first draft, no syntax to learn | Needs checking, works best when it produces editable text |
What tools can you use to make diagrams as code?
- Language toolchains. Mermaid, PlantUML, D2 and Graphviz each ship a renderer, a CLI and in most cases an online playground, which is all you need to get started.
- Editor and platform integrations. VS Code, GitHub, GitLab, Confluence and Notion render one or more of these languages inline, so the diagram is previewed where it is written.
- AI diagramming tools. Tools like Eraser turn a description into diagram code you can keep editing, and include a Mermaid editor and a PlantUML editor for teams that already use those languages. For a comparison of the options, see the best diagram-as-code tools.
Frequently asked questions
-
What is the difference between diagram as code and Mermaid?
Diagram as code is the general practice of writing diagrams as text. Mermaid is one language for doing it, popular because GitHub, GitLab and many wikis render it inline. PlantUML, D2, Graphviz and Eraser's syntax are other languages that serve the same purpose with different strengths.
-
Can you convert an existing diagram to code?
Not reliably from an image, since a picture has no structure a tool can read. Some tools import other text formats, and AI tools can draft text from a description or a screenshot, but expect to check the result. It is usually faster to write a small diagram again than to recover it from a bitmap.
-
Does diagram as code work for architecture diagrams?
Yes, and it is one of the most common uses. An architecture diagram written as text can be reviewed in the same pull request as the change it describes, and structured approaches such as the C4 model fit text formats especially well.
-
What are the downsides of diagram as code?
You give up precise control of the layout, since the tool places the shapes. Large diagrams can come out tangled, and some notations are awkward to express in text. Non-technical colleagues may also prefer to drag shapes rather than learn a syntax, which is why many tools now offer both.