Diagram types
Architecture diagram
An architecture diagram is a visual overview of a software system that shows its main components, how they connect and where each one runs.
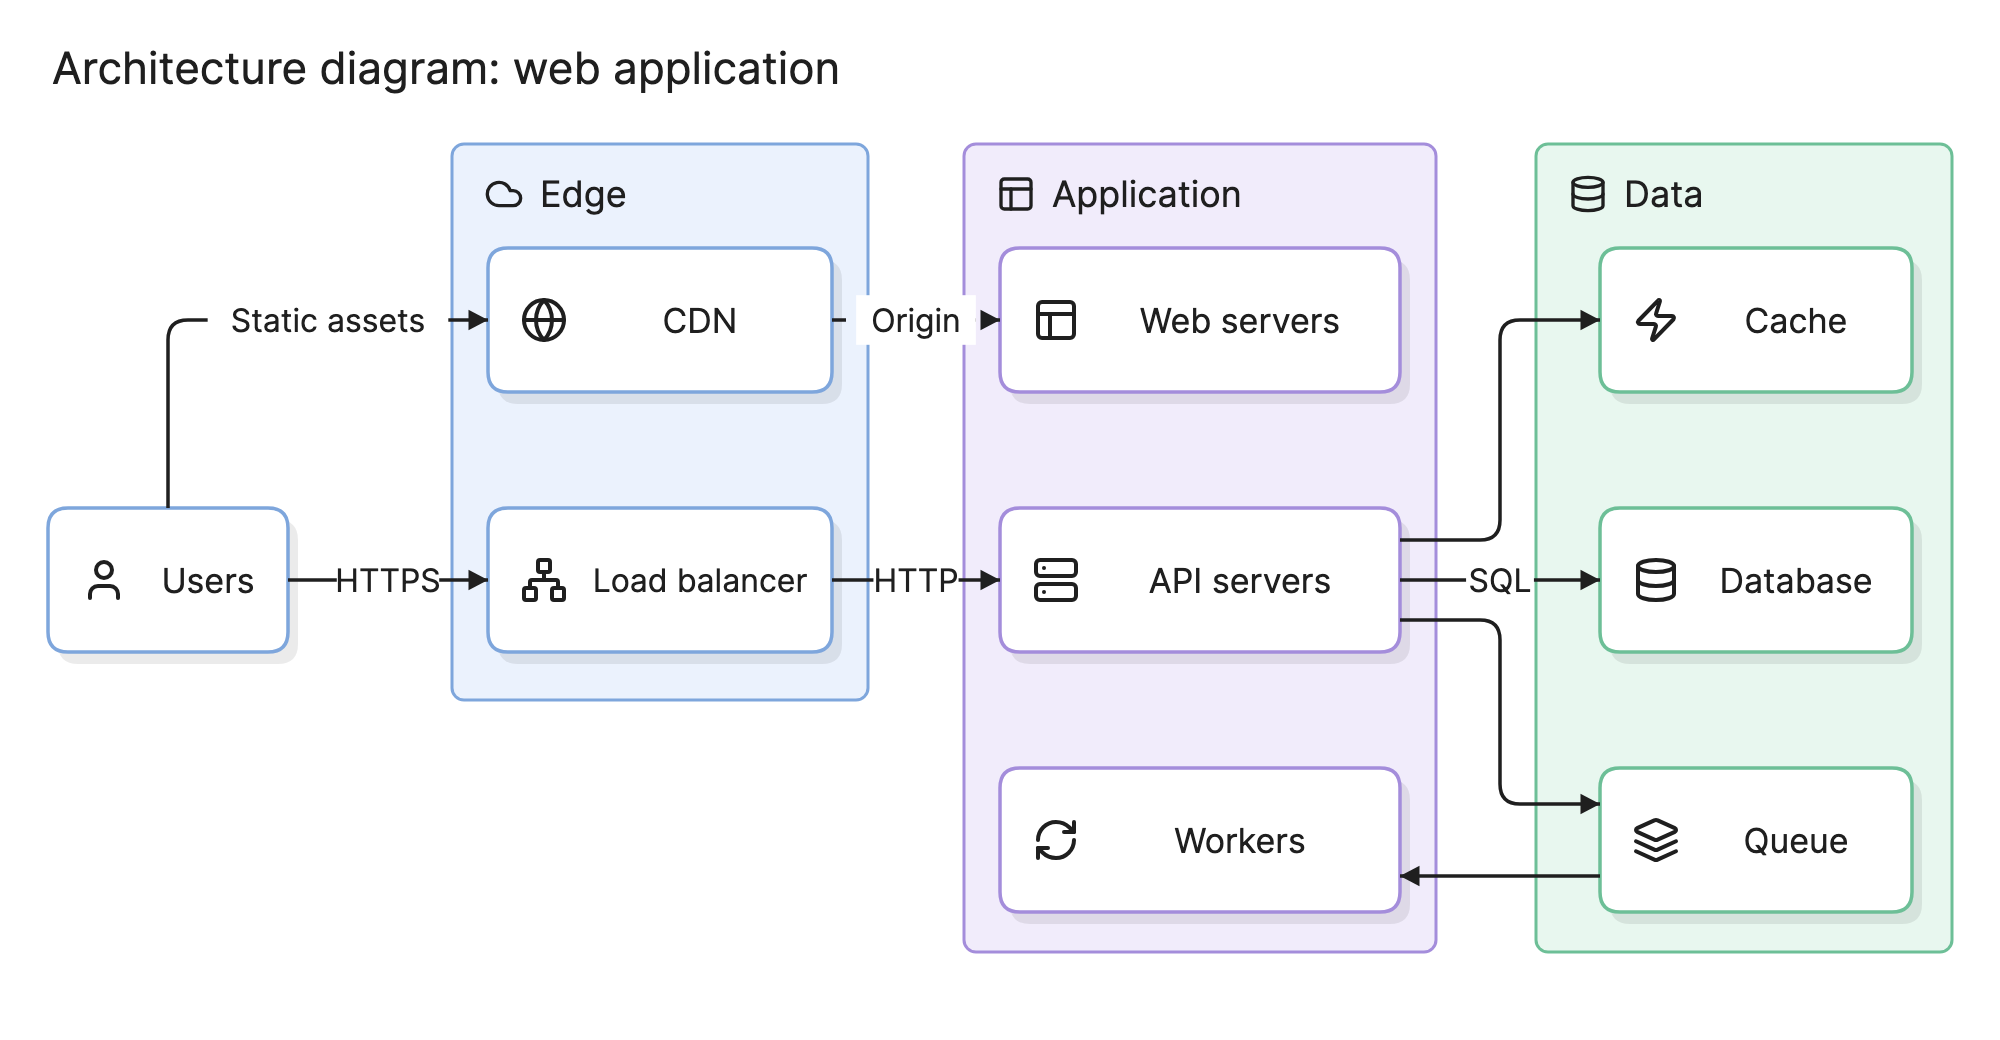
Teams draw architecture diagrams to agree on a design before building it and to explain a system that already exists. A good one shows a new engineer how a request moves through the system in a minute.
When should you use an architecture diagram?
- Design reviews. Put the proposed structure in front of other engineers while changing it still costs nothing.
- Design documents. Most RFCs open with one, because readers want the shape of the system before the details.
- Onboarding. Give new team members a map of the services, data stores and external systems they will work with.
- Incident reviews. Trace where a failure started and which components it reached.
- Security and migration planning. Show where data crosses a boundary, or compare the current system with the target.
What are the parts of an architecture diagram?
Most architecture diagrams are built from the same five elements.
- Components. The boxes: services, applications, databases, queues and other runtime units. Name each as a reader would, such as “API servers” rather than “Tier 2”.
- Connections. The arrows. The direction shows who starts the conversation. Label the protocol or the data when that is the point.
- Groups. Tinted regions that collect components by tier, network, cloud account, team or trust boundary. In the example above, the groups are tiers: Edge, Application and Data.
- External elements. The users and third-party systems outside your boundary, drawn so it is clear they are not yours.
- Annotations. Provider icons, version numbers, instance counts and short notes.
What are the types of architecture diagram?
The term covers several diagrams drawn at different levels. Pick the level by who will read it.
| Type | What it shows | Typical reader |
|---|---|---|
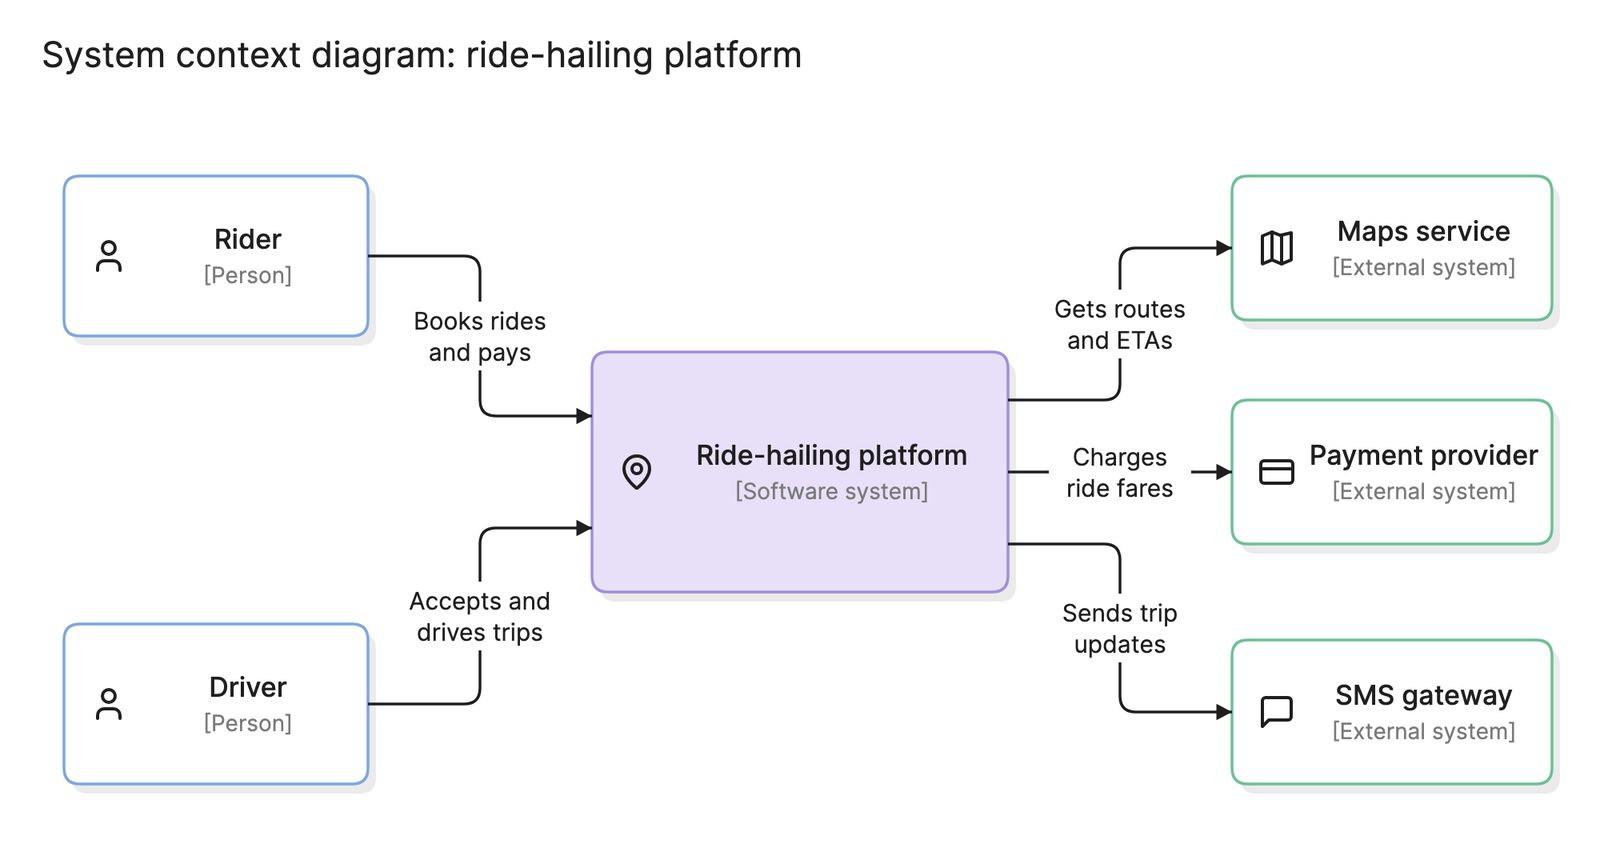
| System architecture | The whole system as a handful of boxes, plus its users and external systems | Executives, product managers, new engineers |
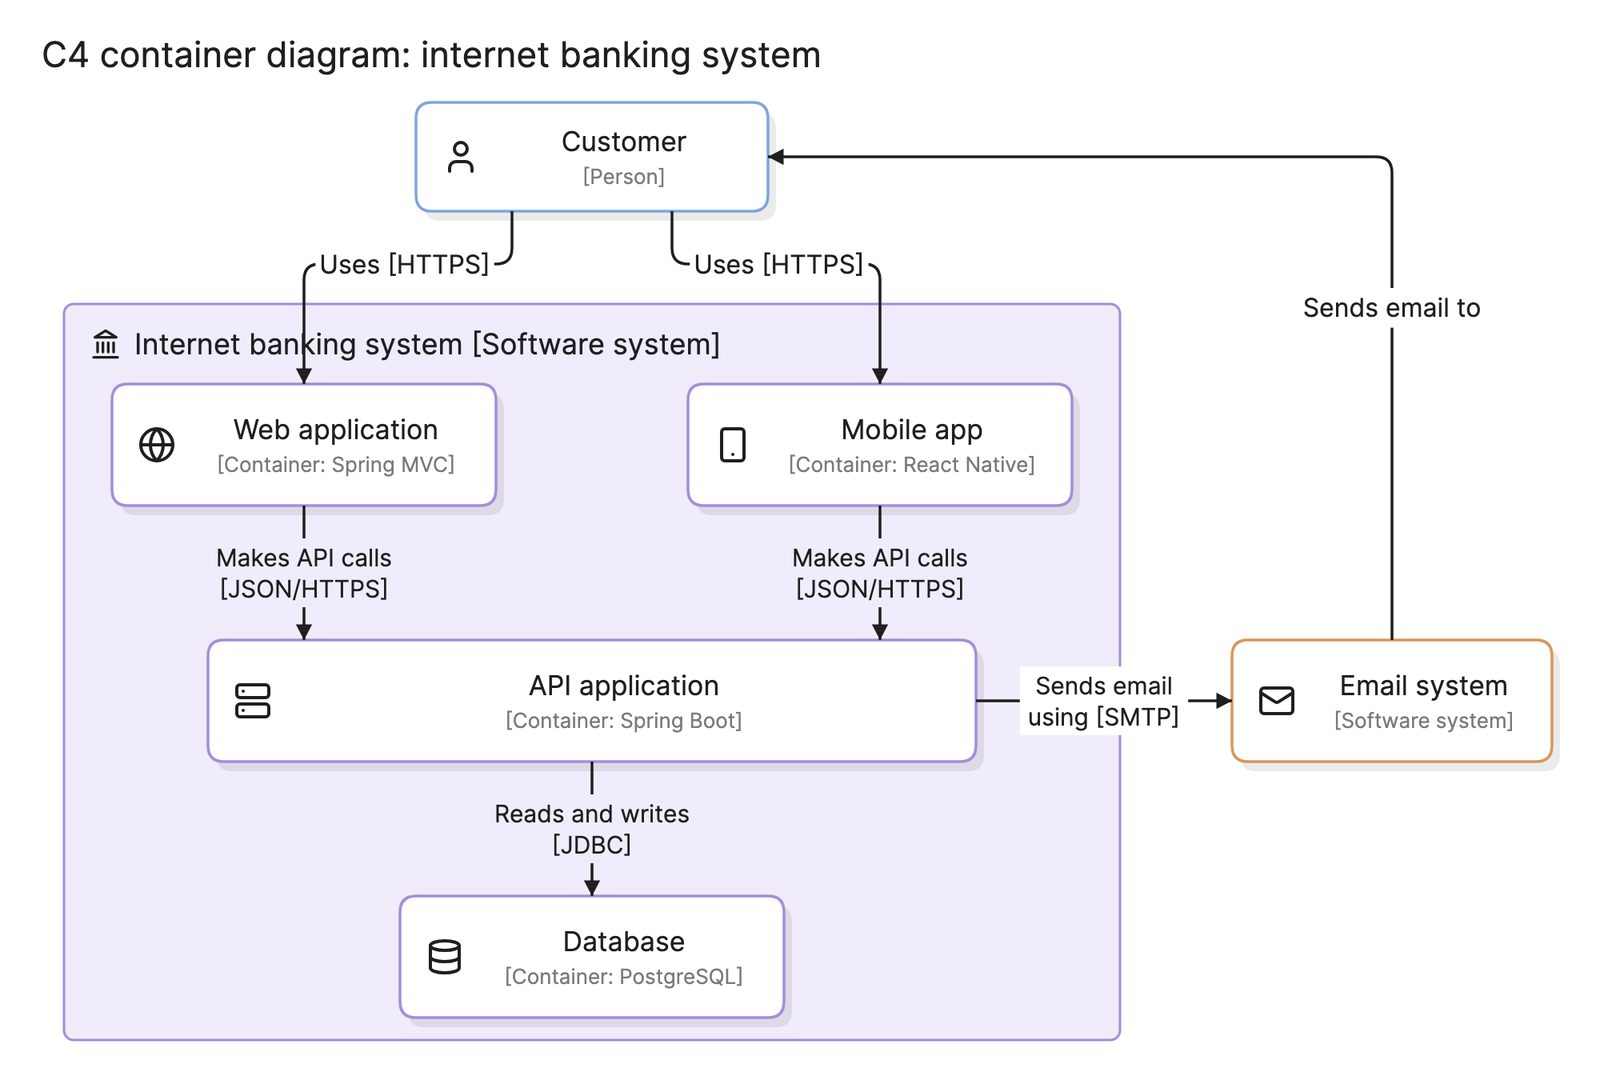
| Application architecture | The services, databases and queues inside one system, and how they interact | Engineers on the team |
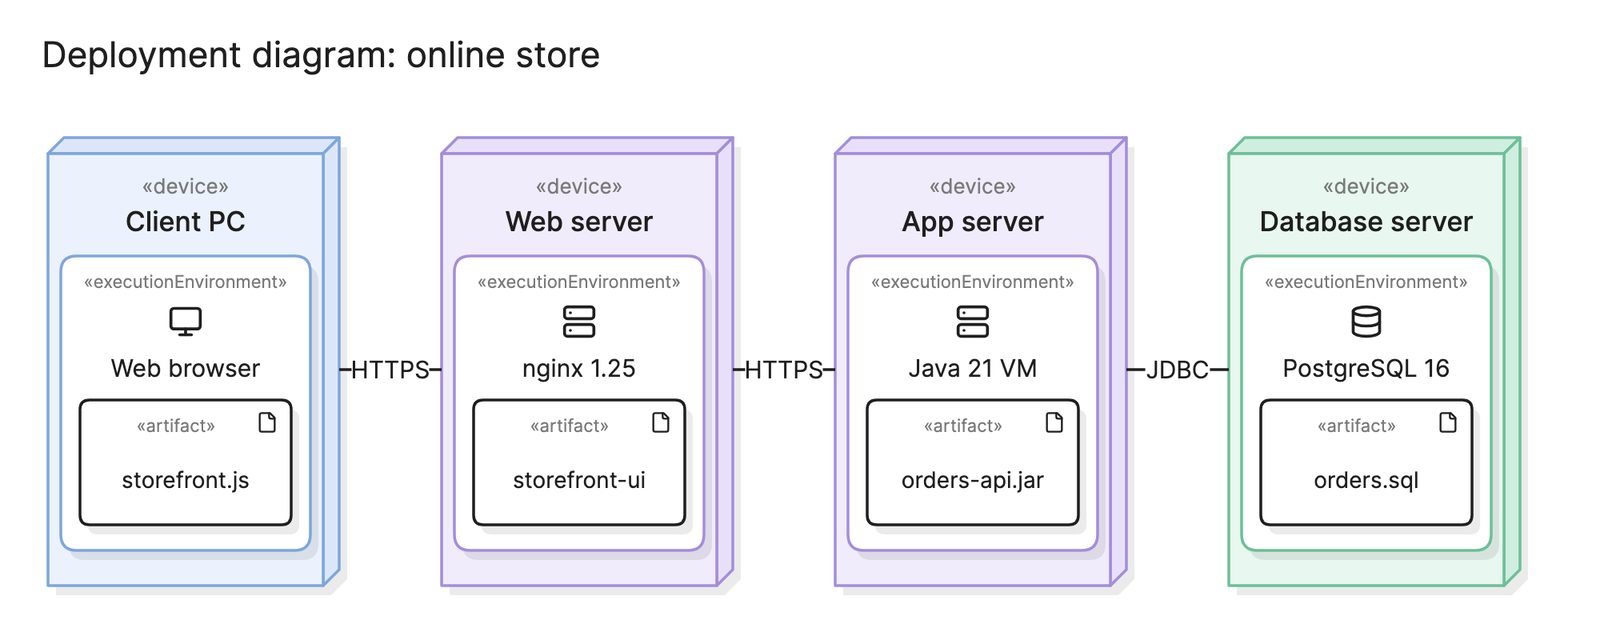
| Deployment diagram | Which software runs on which hardware or environment | Operations, security reviewers |
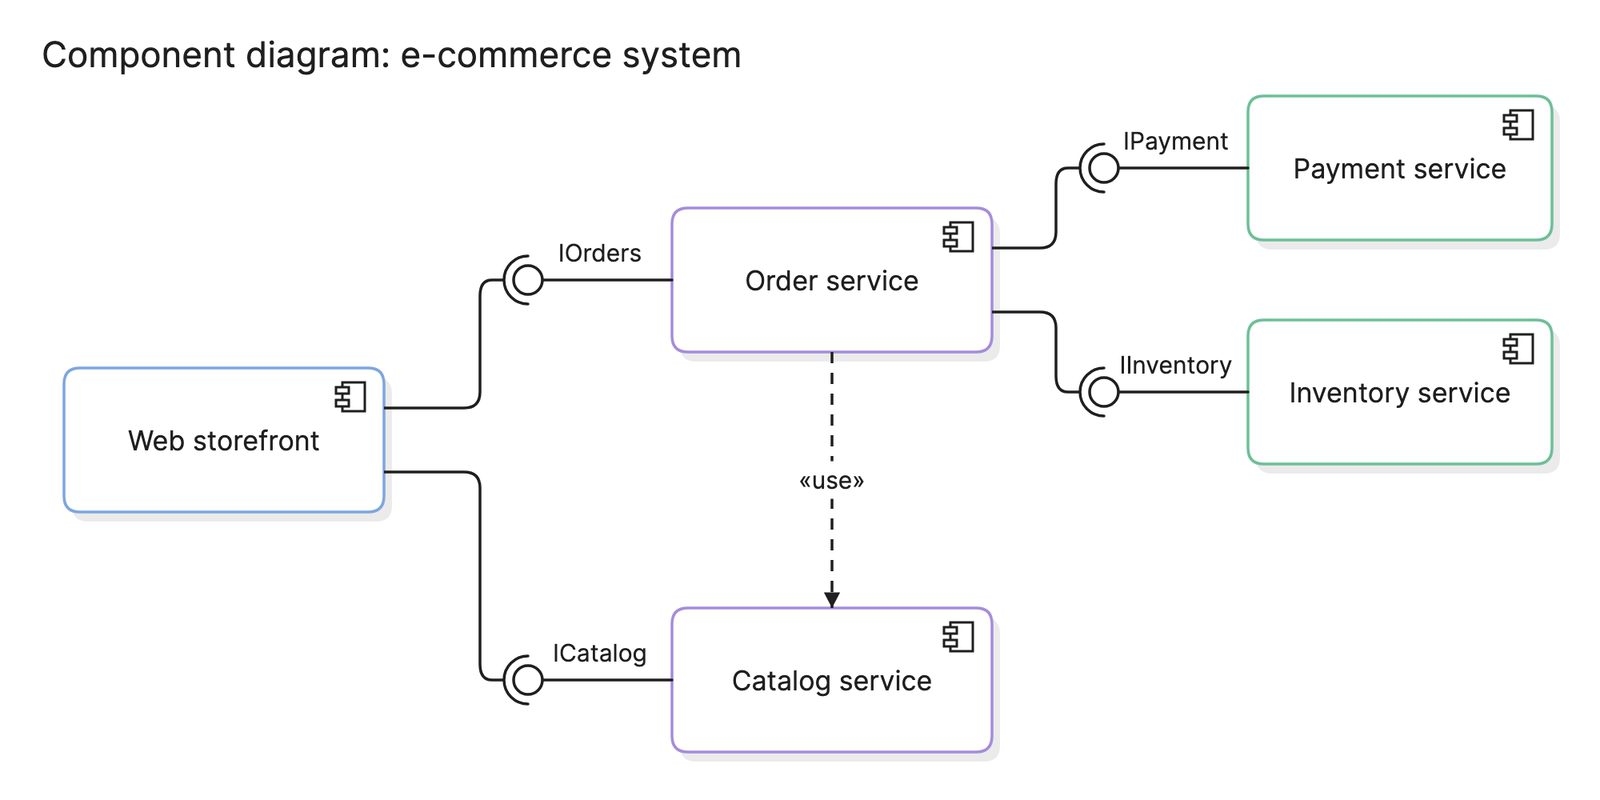
| Component diagram | The internal parts of one application and the interfaces between them | Engineers working inside that application |
The C4 model formalizes this into four nested levels. Its context diagram matches the system level above and its container diagram matches the application level.
How do you read an architecture diagram?
Start from the user and follow the arrows. In the web application example at the top of this page, users reach two things: a CDN for static assets and a load balancer for everything else. The load balancer spreads requests across the API servers, where the application logic runs. The dashed arrow from the CDN to the web servers shows that the CDN only goes back to the origin when a file is not cached.
The API servers talk to three things in the Data tier. They check the cache before the database, read and write the database over SQL and publish slow jobs to a queue. Workers pick those jobs up, which keeps the API servers free to answer requests. Reading it this way raises the right questions: what happens if the queue fills up, and can the system run without the cache?
How do you create an architecture diagram?
- Decide the question. Write down who will read the diagram and what they need to learn. That sets the level of detail.
- List the components. Name every service, store, queue and external system that matters at that level, and no others.
- Draw the connections. Add an arrow for each interaction, from the caller to the callee. Label the protocol or data where it answers a question.
- Group and separate. Draw boundaries for tiers, networks or teams, and keep external systems visibly outside.
- Lay it out for reading. Put users on the left or top and let the flow run one way across the page.
- Check it against reality. Walk through a real request with someone who runs the system, then keep the diagram with the code and update it when the design changes.
What are common architecture diagram mistakes?
- Mixing levels. A Kubernetes pod next to “the billing system” confuses readers, because the two boxes are not the same kind of thing.
- Unlabeled arrows. An arrow between two services could mean HTTP, a shared database or a nightly export. If it matters, say which.
- Too many boxes. Past 20 or so components, nobody reads it. Split by subsystem or by level.
- No boundaries. Without groups, a reader cannot tell what is yours, what is in the cloud account and what belongs to a vendor.
- Drawing the intended design. If the diagram shows the system you wish you had, mark it as the target state and draw the current state too.
How does an architecture diagram compare with other diagrams?
| Diagram | What it shows | Use it to answer |
|---|---|---|
| Architecture diagram | The components of a system and how they connect | How is this system put together? |
| Context diagram | One system and the people and systems around it | What does this system interact with? |
| Deployment diagram | Software mapped to the hardware or environments it runs on | Where does each part run? |
What tools can you use to make an architecture diagram?
- Drag-and-drop diagramming tools. These give full control over layout and ship with cloud provider icon sets, but every change is manual, so diagrams drift from the system over time.
- Diagram-as-code tools. Writing the diagram as text puts it in version control next to the code it describes, so one pull request can update both. See the best diagram-as-code tools for a comparison.
- AI diagramming tools. Tools like Eraser turn a plain-English description, a design doc or infrastructure code into an architecture diagram you can keep editing, which is the fastest way to get a first draft of a system that already exists.
For more on this kind of diagram, see architecture diagrams.
Frequently asked questions
-
What is the difference between an architecture diagram and a network diagram?
An architecture diagram shows the parts of a software system and how they depend on each other. A network diagram shows the physical or virtual network: routers, switches, subnets, firewalls and the links between them. The two overlap in cloud environments, where a VPC or subnet often appears on both.
-
What is the difference between an architecture diagram and a C4 diagram?
The C4 model is one way to organize architecture diagrams. It defines four levels, from a context diagram of the whole system down to code, and a fixed set of element types. A plain architecture diagram has no such rules, which makes it quicker to draw and easier to misread.
-
What should an architecture diagram include?
Include every component that matters to the question the diagram answers, the connections between them, the protocols or data on those connections where it helps and the boundaries that separate tiers, networks or teams. Leave out anything a reader would have to ignore to see the point, and add a title that says what the diagram covers.
-
How detailed should an architecture diagram be?
Detailed enough to answer one question and no more. A diagram for a design review can show every service and queue. A diagram for an executive summary should show five to ten boxes. If one diagram needs to do both jobs, draw two and link them, as the C4 model does with its levels.