Diagram types
Context diagram
A context diagram shows one system as a single box, with the people and external systems around it and the flows between them, but nothing of its inside.
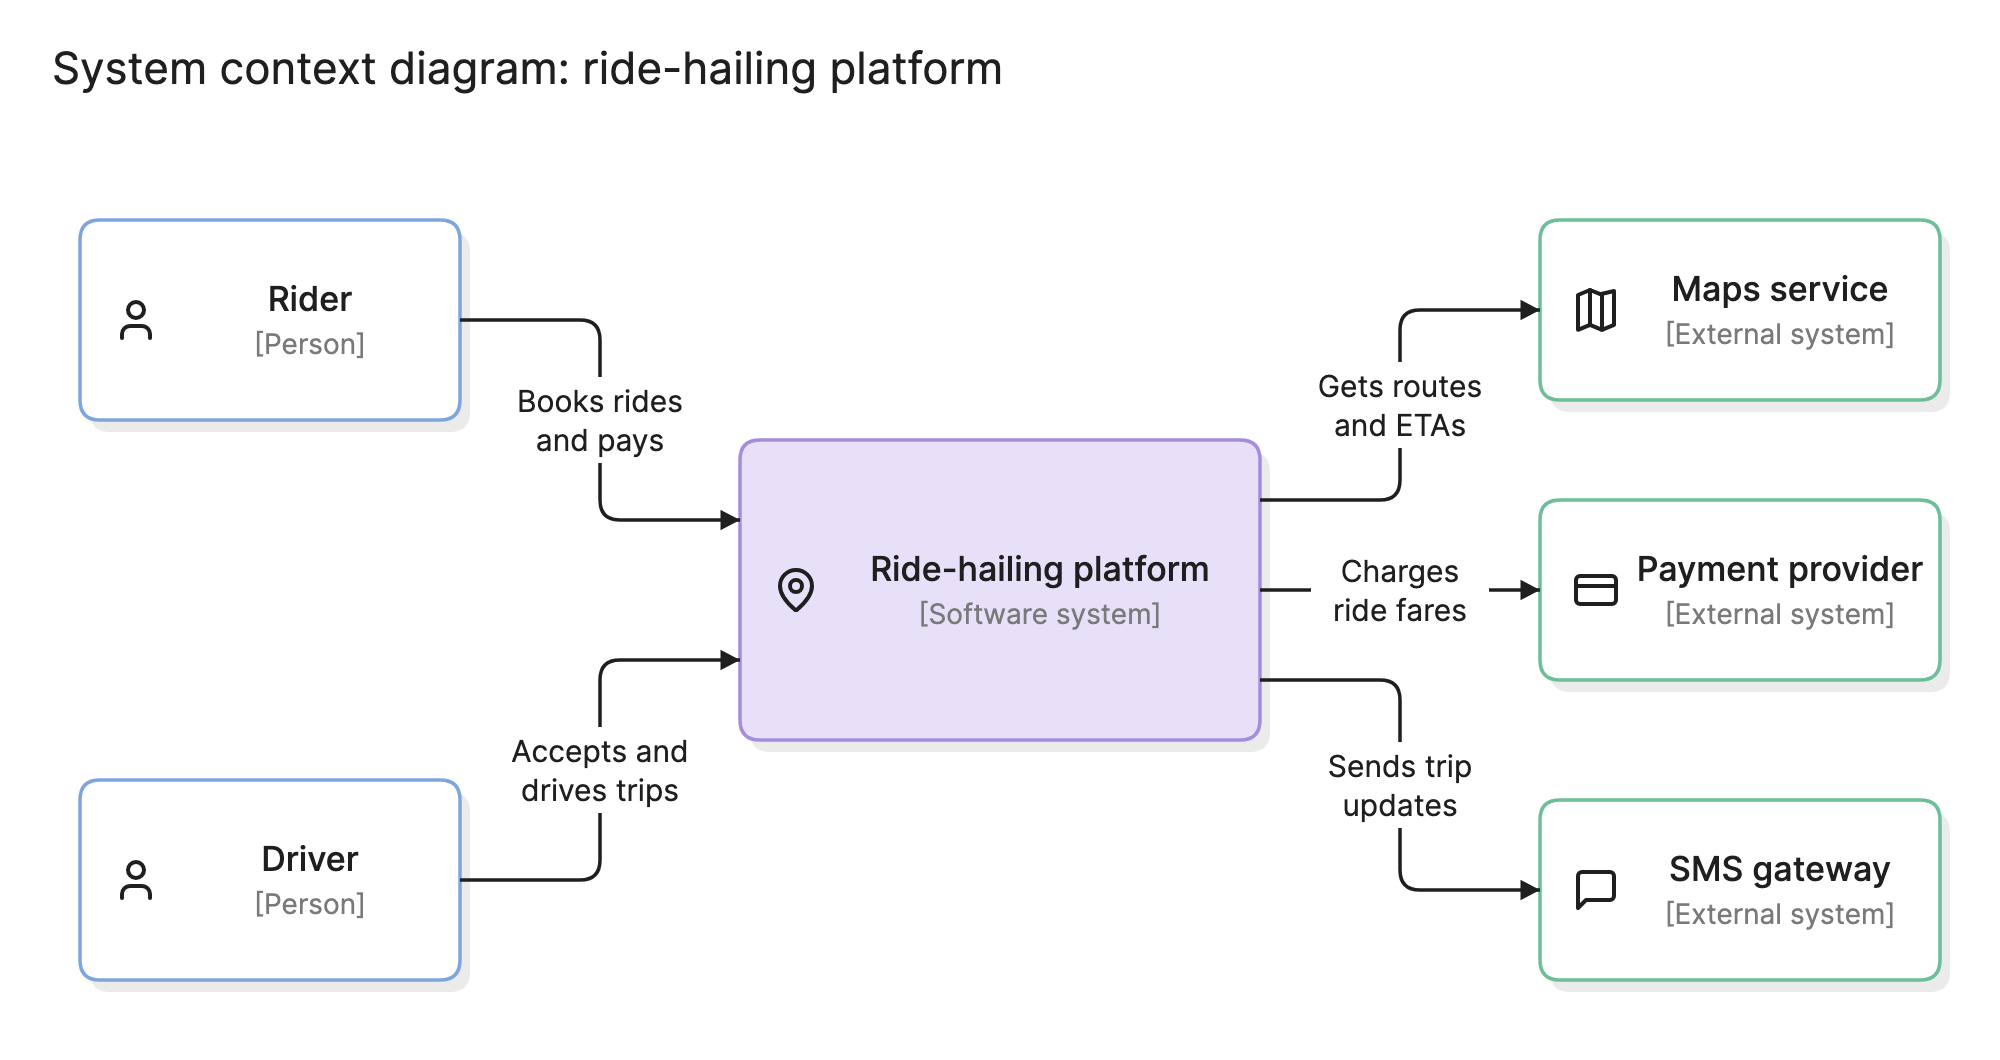
Teams draw a context diagram first because it settles the question every other diagram depends on: what is inside the system and what is outside it. It is also the one diagram people outside engineering can read without help.
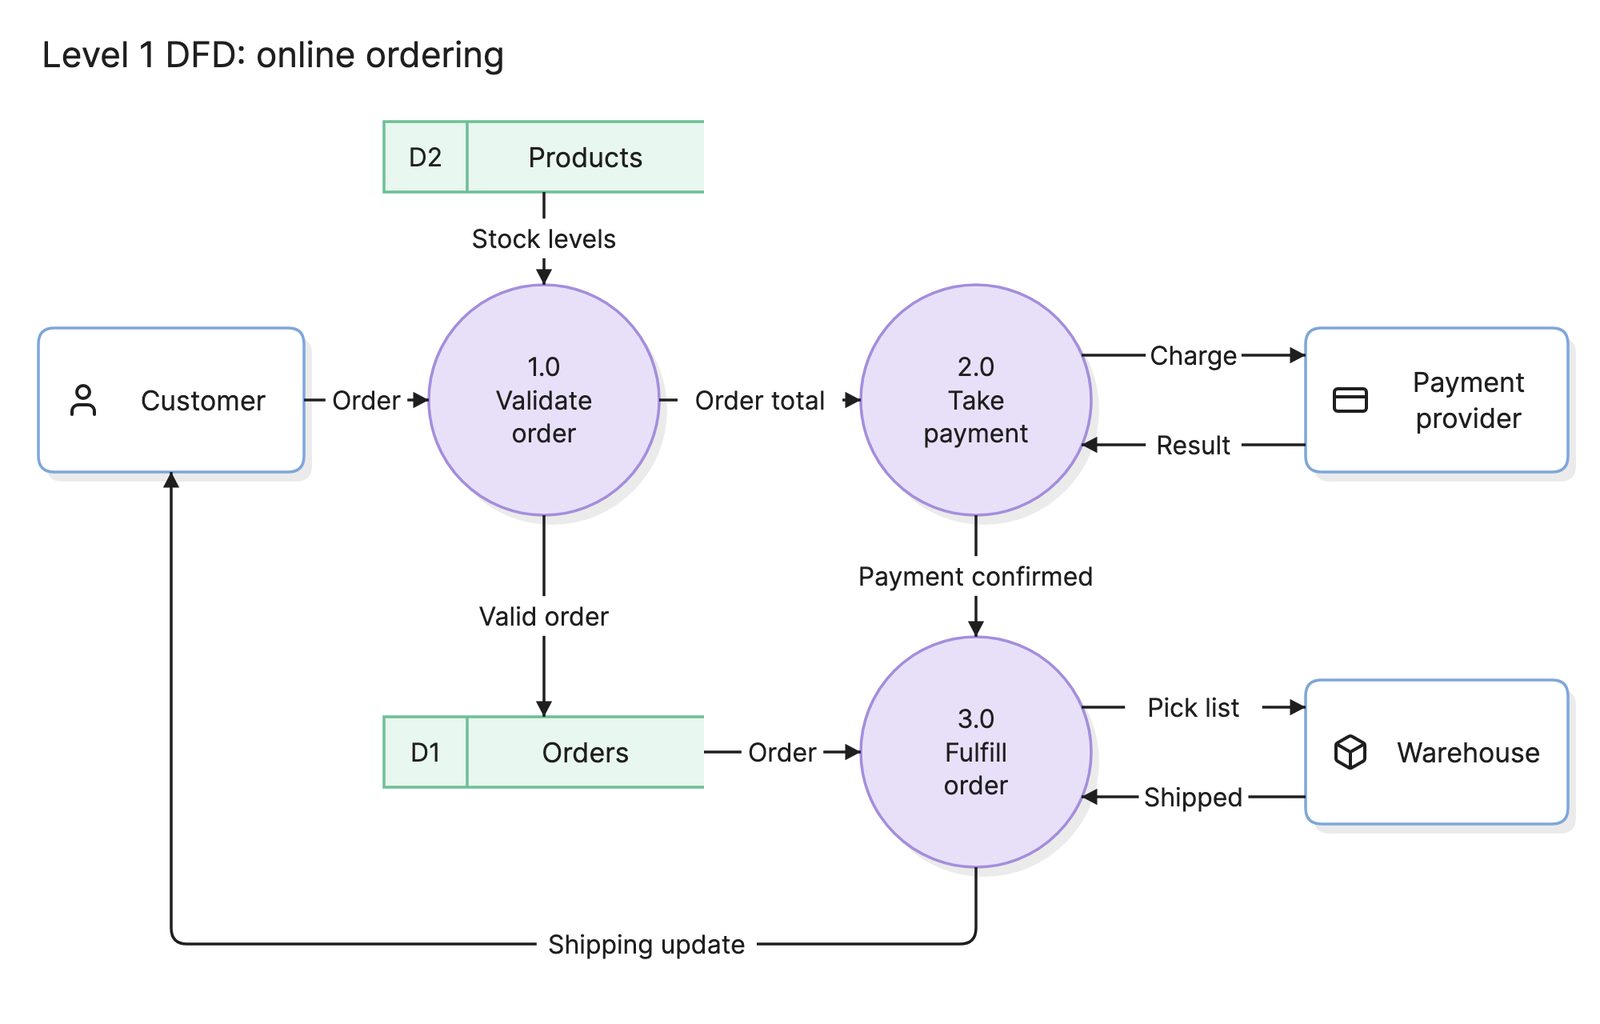
The term has two homes. In structured analysis it is the level 0 data flow diagram, with the system drawn as a single process. In the C4 model it is the first of four levels, drawn with boxes for people and systems. Both show the same thing, and this page covers both.
When should you use a context diagram?
- Agreeing on scope. Before requirements or a design, put the boundary on paper so everyone knows what is in and what is out.
- Starting a design document. Readers want to know what the system talks to before they learn how it works.
- Security and compliance reviews. Every arrow crossing the boundary is an integration to review and a place data can leak.
- Explaining a system to non-engineers. With one box for the system and no technology inside it, a context diagram is readable by anyone.
What are the parts of a context diagram?
- The system. One box or circle in the middle, named for what it is, such as “Ride-hailing platform”. Its inside is deliberately empty.
- People. The roles who use the system, such as riders and drivers. C4 labels them [Person], and a DFD treats them as external entities.
- External systems. Software the system depends on but does not own: a payment provider, a maps service, an SMS gateway. C4 labels them [External system].
- Flows. Arrows between the system and each outside element. In a DFD each arrow is a named piece of data. In C4 each arrow is a short sentence describing the interaction, such as “Charges ride fares”.
What are the types of context diagram?
Level 0 data flow diagram
The system is one circle, the external entities are boxes and each arrow is a named data flow, such as “Order details”. It comes from structured analysis and leads to a level 1 DFD that opens the circle up. The data flow diagram page shows one.
C4 system context diagram
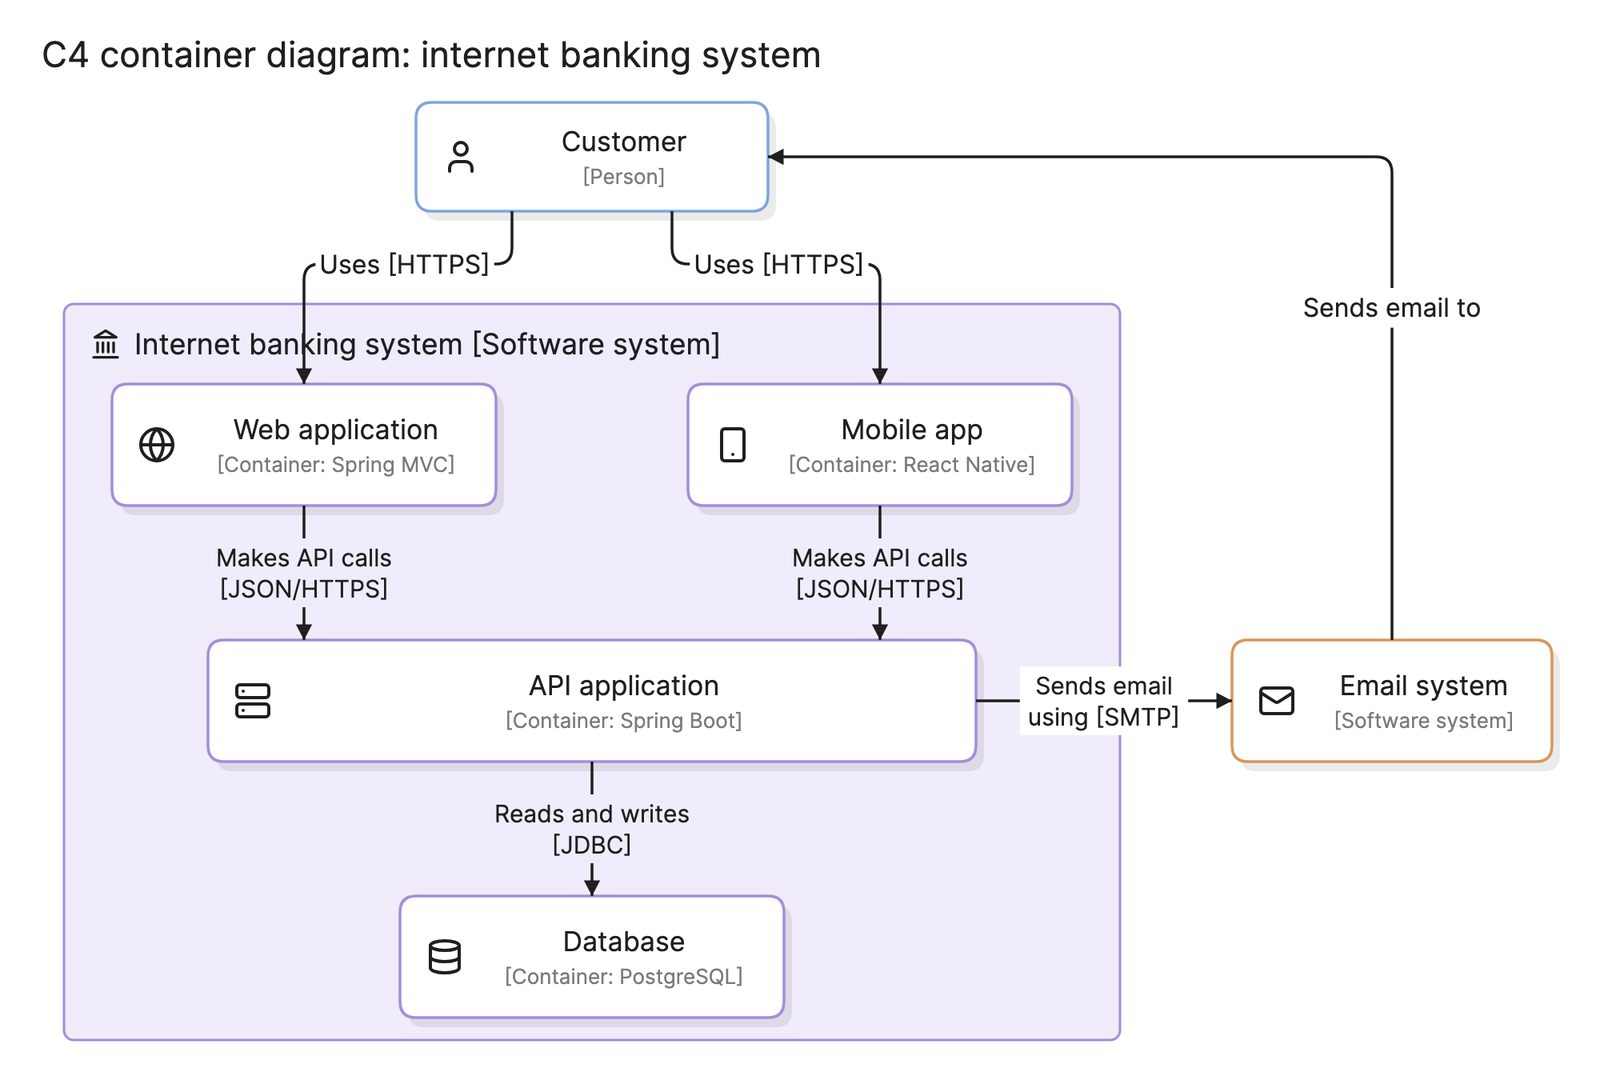
The system, the people and the external systems are all boxes, each with a bracketed type, and the arrows carry a sentence rather than a data name. The ride-hailing example on this page is this kind. It leads to a C4 container diagram, which opens the system into applications and data stores.
How do you read a context diagram?
Start with the people. In the ride-hailing example at the top of this page, two kinds of person use the platform. Riders book rides and pay, and drivers accept and drive trips. Both arrows point into the system, because the people start the interaction.
On the right are the external systems the platform depends on. It gets routes and ETAs from a maps service, charges ride fares through a payment provider and sends trip updates through an SMS gateway. All three arrows point out, because the platform starts those conversations. That already tells a reviewer where the risks are: an outage at any of the three providers affects riders, and card data passes to the payment provider. What the diagram does not say is how the platform works inside, which is the point. That belongs on a container diagram or an architecture diagram.
How do you create a context diagram?
- Name the system. Write the system in the middle as one box, with a name the business would use.
- List the people. Add every role that uses the system directly, not individual users and not internal services.
- List the external systems. Add every system yours sends data to or receives data from, including ones owned by other teams in the same company.
- Draw and label the flows. One arrow per interaction, pointing from whoever starts it, with a short label that says what passes or what the interaction does.
- Check the boundary. If any box describes something inside your system, merge it into the center. If an external system has no arrow, it does not belong.
- Review it with stakeholders. This is where scope disagreements show up cheaply.
What are common context diagram mistakes?
- Opening the box. Drawing databases or services inside the central system turns it into a container or architecture diagram and loses the point.
- Unlabeled flows. An arrow without a label does not say what crosses the boundary, which is the question security and integration reviews ask.
- Missing external systems. Identity providers, email services and analytics tools are easy to forget.
- Mixing people and systems. A “Mobile app” is not a person. The rider is the person, and the app is inside the system.
- Too much detail. More than about ten outside elements means the boundary is probably in the wrong place.
How does a context diagram compare with other diagrams?
| Diagram | What it shows | Use it to answer |
|---|---|---|
| Context diagram | One system and everything around it | What does this system interact with? |
| Data flow diagram | Processes, stores and data flows inside the system | Where does this data go? |
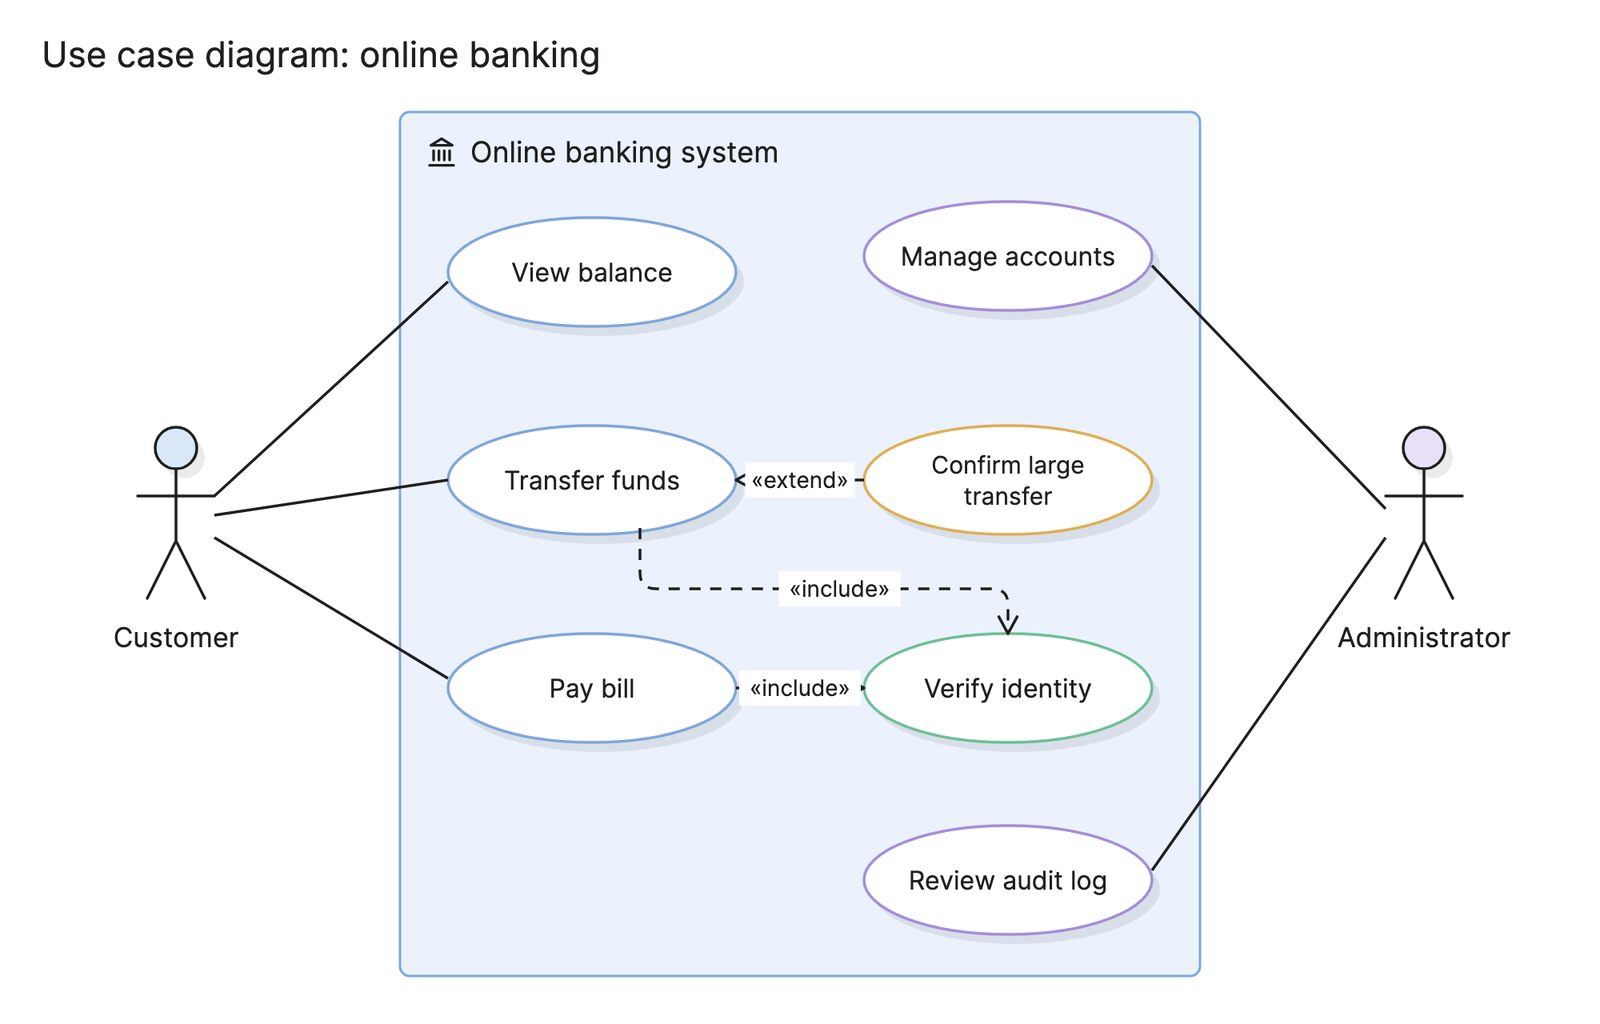
| Use case diagram | Actors and the goals they achieve with the system | What can each user do? |
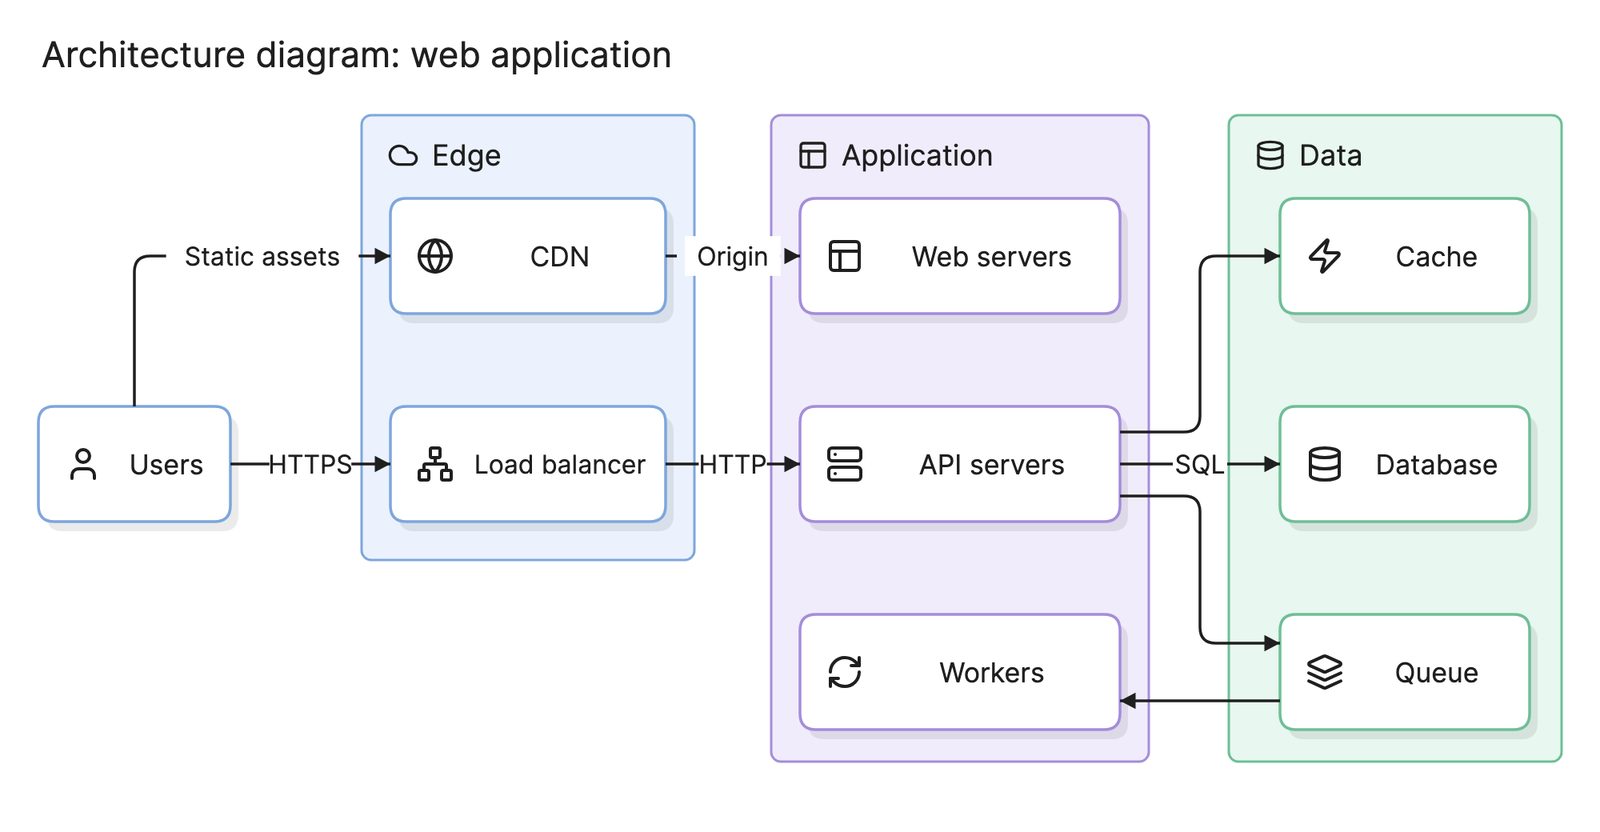
| Architecture diagram | The components inside the system and how they connect | How is the system put together? |
What tools can you use to make a context diagram?
- Whiteboards. A context diagram has few elements, so a sketch in a scoping meeting is often enough, if someone redraws it afterwards.
- Drag-and-drop diagramming tools. Most include DFD shapes and C4 templates, and the diagram is small enough that manual layout is no burden.
- AI diagramming tools. Tools like Eraser turn a short description of a system and its integrations into a context diagram you can keep editing, and can go on to the C4 container level from the same source.
For more on this kind of diagram, see architecture diagrams.
Frequently asked questions
-
What is the difference between a context diagram and a data flow diagram?
A context diagram is the top level of a data flow diagram, known as level 0, where the whole system is one process. Lower DFD levels open that process up into sub-processes and data stores. The same idea appears in the C4 model as its first level, drawn with boxes instead of circles.
-
What is a C4 context diagram?
It is the first of the four levels in the C4 model. It shows the software system as one box, the people who use it and the other systems it depends on, with a sentence on each arrow. The next level, the container diagram, opens the system into its applications and data stores.
-
What should a context diagram include?
The system itself, every type of user, every external system it exchanges data with and a labeled flow for each exchange. It should not include internal components, databases or technology choices, which belong on the next level down. If the diagram has more than one box for your own system, it is no longer a context diagram.
-
Who uses context diagrams?
Business analysts draw them at the start of requirements work to agree on scope. Architects draw them as the first page of a design, usually following the C4 model. Security teams use them to find every external connection that needs review, and product managers use them to explain a system to people outside engineering.