Diagram types
Deployment diagram
A deployment diagram is a UML diagram that shows where software runs: hardware and environments as nodes, the artifacts on them and the links between them.
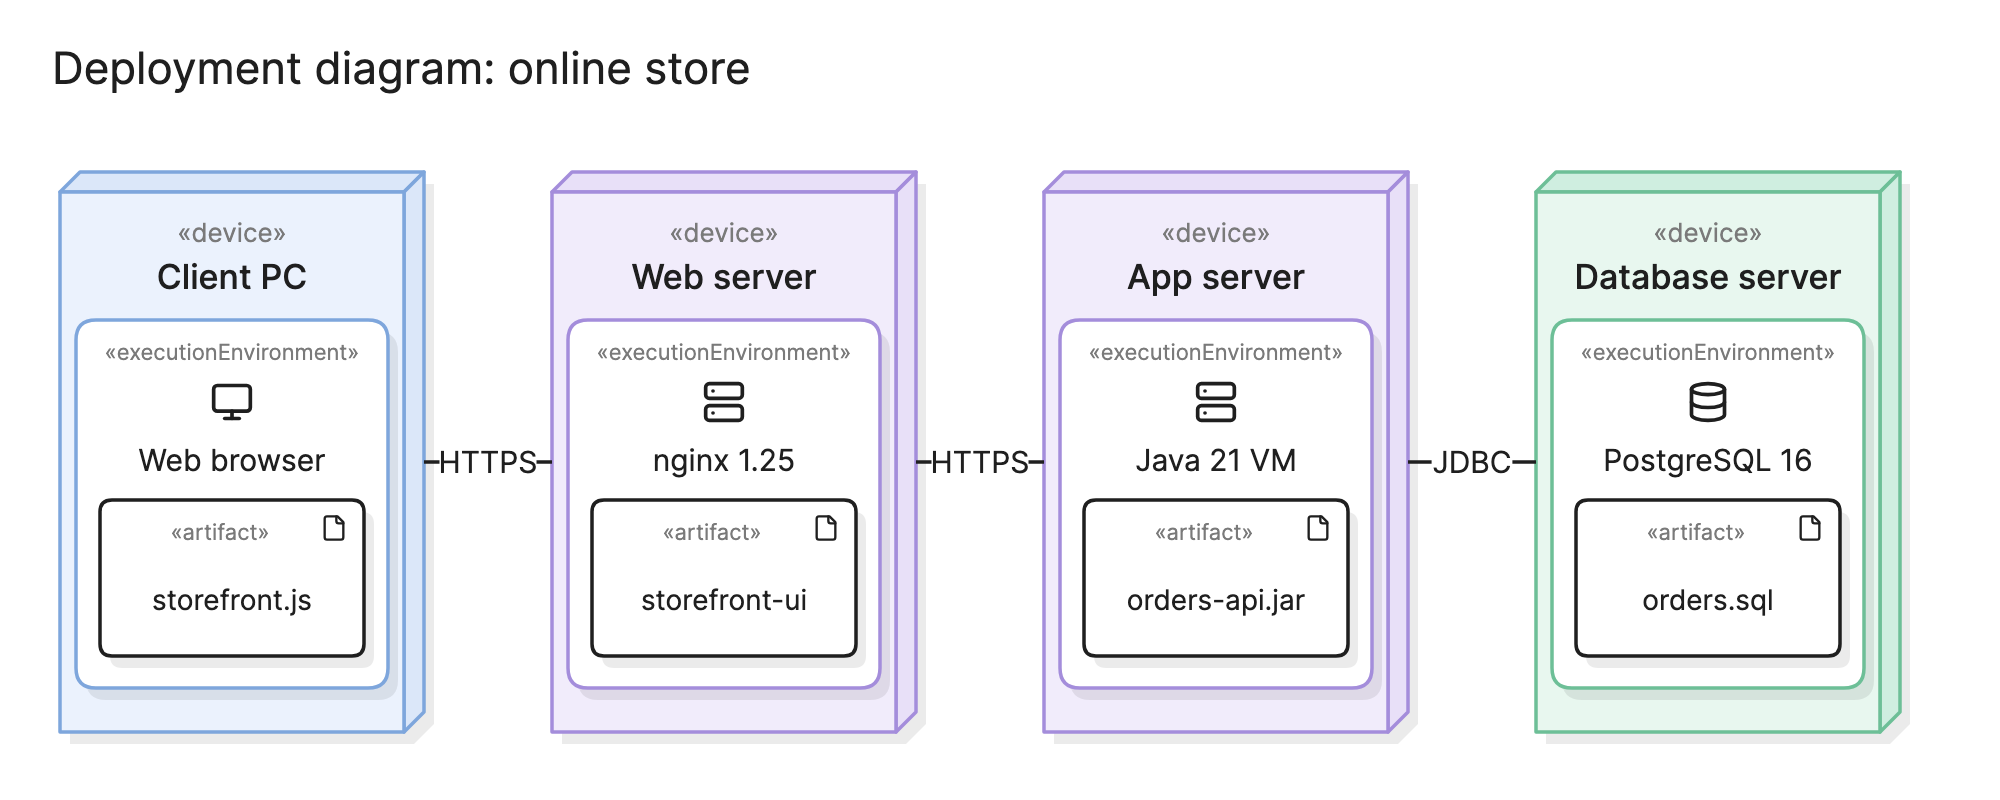
Teams draw deployment diagrams to answer a question that component and class diagrams cannot: where does each piece of software actually run? That matters when planning environments, reviewing security and working out what a failed server takes down with it.
When should you use a deployment diagram?
- Planning an environment. Decide which servers, containers or cloud instances you need and what goes on each before provisioning anything.
- Release planning. Show which artifact goes where, so the deployment steps match the design.
- Security reviews. Reviewers need to see which hosts talk to which, over what protocol and where data crosses a network boundary.
- Capacity and failure analysis. See which artifacts share a node, so you know what a single failure affects.
- Documenting a distributed system. Give operations engineers one picture of the nodes they manage and what runs on them.
What symbols does a deployment diagram use?
Deployment diagrams come from the UML standard, so the notation is fixed.
- Node. A box drawn with a little depth, like a block, representing something that can host software. Nodes are named and usually carry a stereotype.
- «device». A node that is hardware, physical or virtual: a server, a laptop, a phone or a cloud instance.
- «executionEnvironment». A node that is a software platform running on a device: a Java VM, a web browser, an application server or a database engine. It is drawn nested inside the device.
- Artifact. A rectangle with the stereotype «artifact» or a small document icon, representing a deployable file such as
orders-api.jar. It sits inside the node that hosts it. - Communication path. A solid line between nodes showing that they communicate, usually labeled with the protocol, such as HTTPS or JDBC. It is an association, so it has no arrowhead.
What are the types of deployment diagram?
Descriptor level
Shows the kinds of nodes and artifacts, such as “App server” and “orders-api.jar”, without saying how many there are. The online store example is at this level.
Instance level
Shows specific named instances, such as app-01 and app-02, with the exact artifact versions on each. Use it for a real environment, such as production, when the count and the names matter.
Specification with multiplicities
A descriptor-level diagram with counts on the nodes, such as 1..* on the app server, to show that it scales out. This is the common middle ground.
How do you read a deployment diagram?
Read from the client to the data. In the online store example at the top of this page, the leftmost node is a «device» called Client PC. Inside it is an «executionEnvironment», the web browser, and inside that the artifact that runs there, storefront.js. The nesting tells you the browser is what executes the script, and the PC is what runs the browser.
Follow the communication path labeled HTTPS to the web server, where nginx serves the storefront-ui artifact. A second HTTPS path leads to the app server, where a Java VM runs orders-api.jar. The last path, labeled JDBC, reaches the database server, where PostgreSQL holds the orders.sql schema. Reading the labels in order gives you every protocol a request crosses, which is what a firewall rule needs.
How do you create a deployment diagram?
- List the artifacts. Start from the build outputs: the binaries, images, bundles and schema files that actually get deployed.
- List the nodes. Name the devices that will run them, and the execution environments on each device.
- Place the artifacts. Put each artifact inside the environment that runs it. If an artifact runs in several places, show it in each.
- Draw the communication paths. Connect nodes that talk to each other, and label each line with the protocol.
- Add counts and versions where they matter. Multiplicities show what scales out, and version numbers in the names show what is deployed now.
- Check it against the real environment. Compare the diagram with the infrastructure code or the hosting console, and fix the differences.
What are common deployment diagram mistakes?
- Mixing logical and physical. A node called “Order service” is a component, not a node. Name nodes for the hardware or platform and put the service inside as an artifact.
- Missing the execution environment. “App server” alone hides whether the JAR runs on a JVM, inside a container or both.
- Unlabeled paths. A line between two nodes without a protocol does not help a reviewer or an operator.
- One diagram for every environment. Development, staging and production usually differ. Draw them separately, or draw one descriptor diagram and note the differences.
- Going stale. Infrastructure changes often. Keep the diagram next to the infrastructure code and update both together.
How does a deployment diagram compare with other diagrams?
| Diagram | What it shows | Use it to answer |
|---|---|---|
| Deployment diagram | Artifacts on the nodes that run them, with communication paths | Where does each piece of software run? |
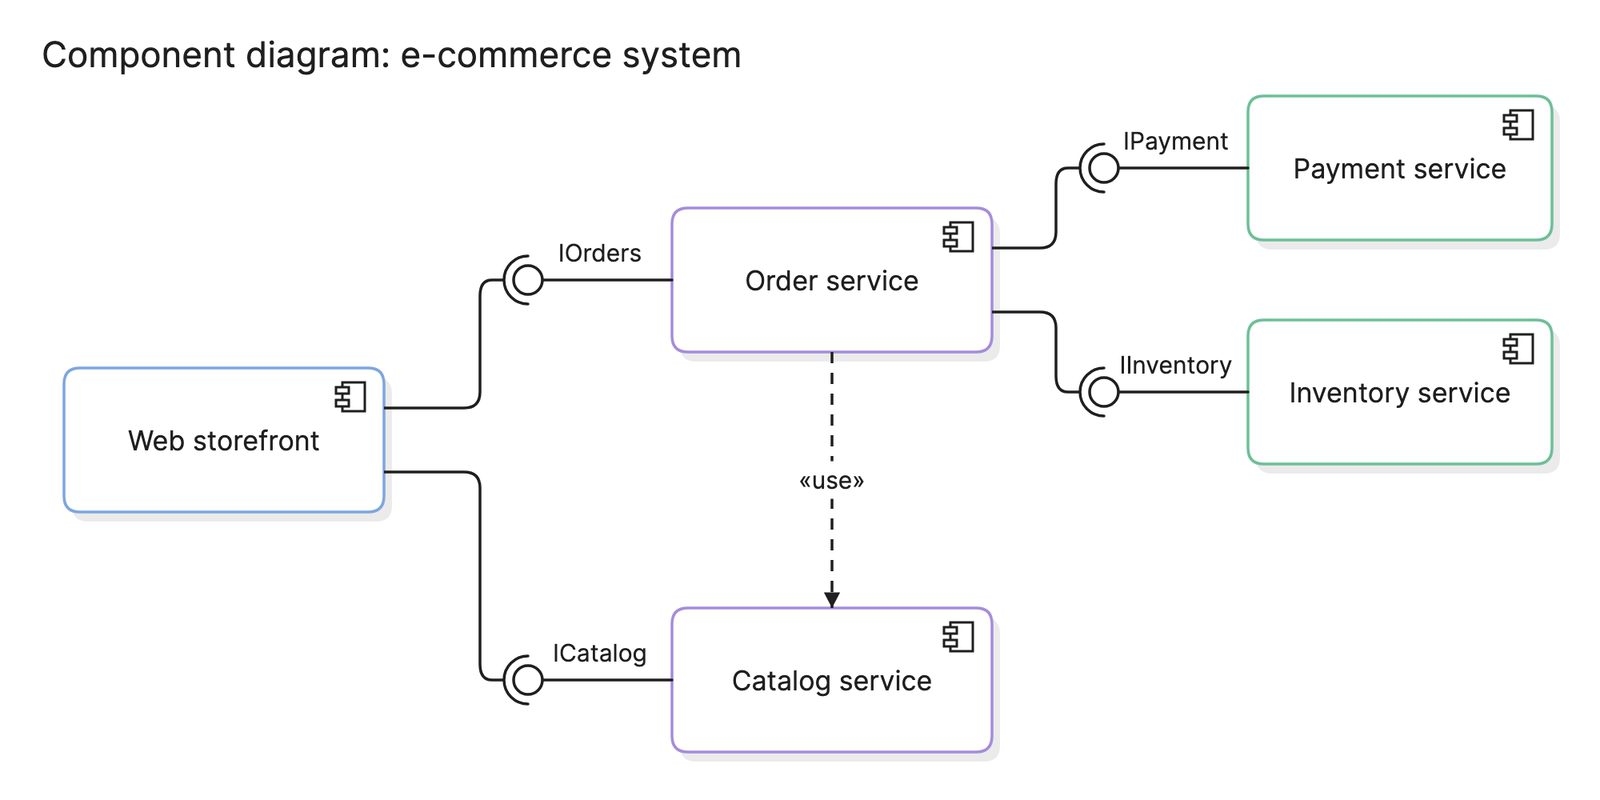
| Component diagram | The parts of the software and the interfaces between them | What are the parts, and what do they promise each other? |
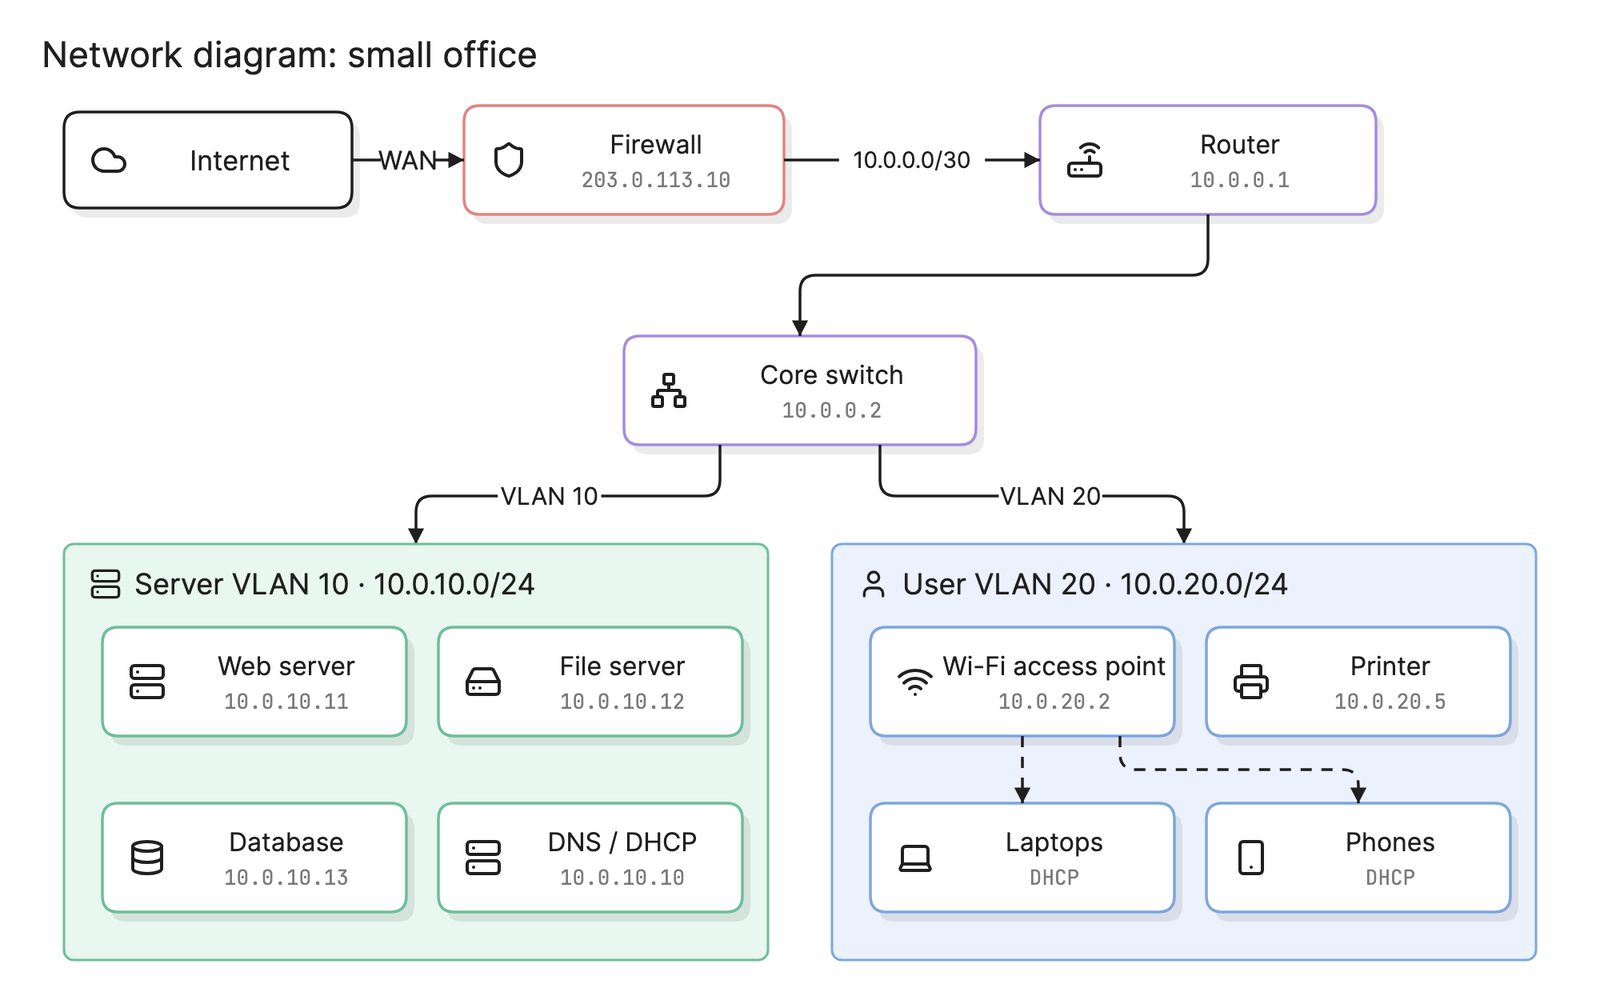
| Network diagram | Routers, switches, subnets and links | How is the network built? |
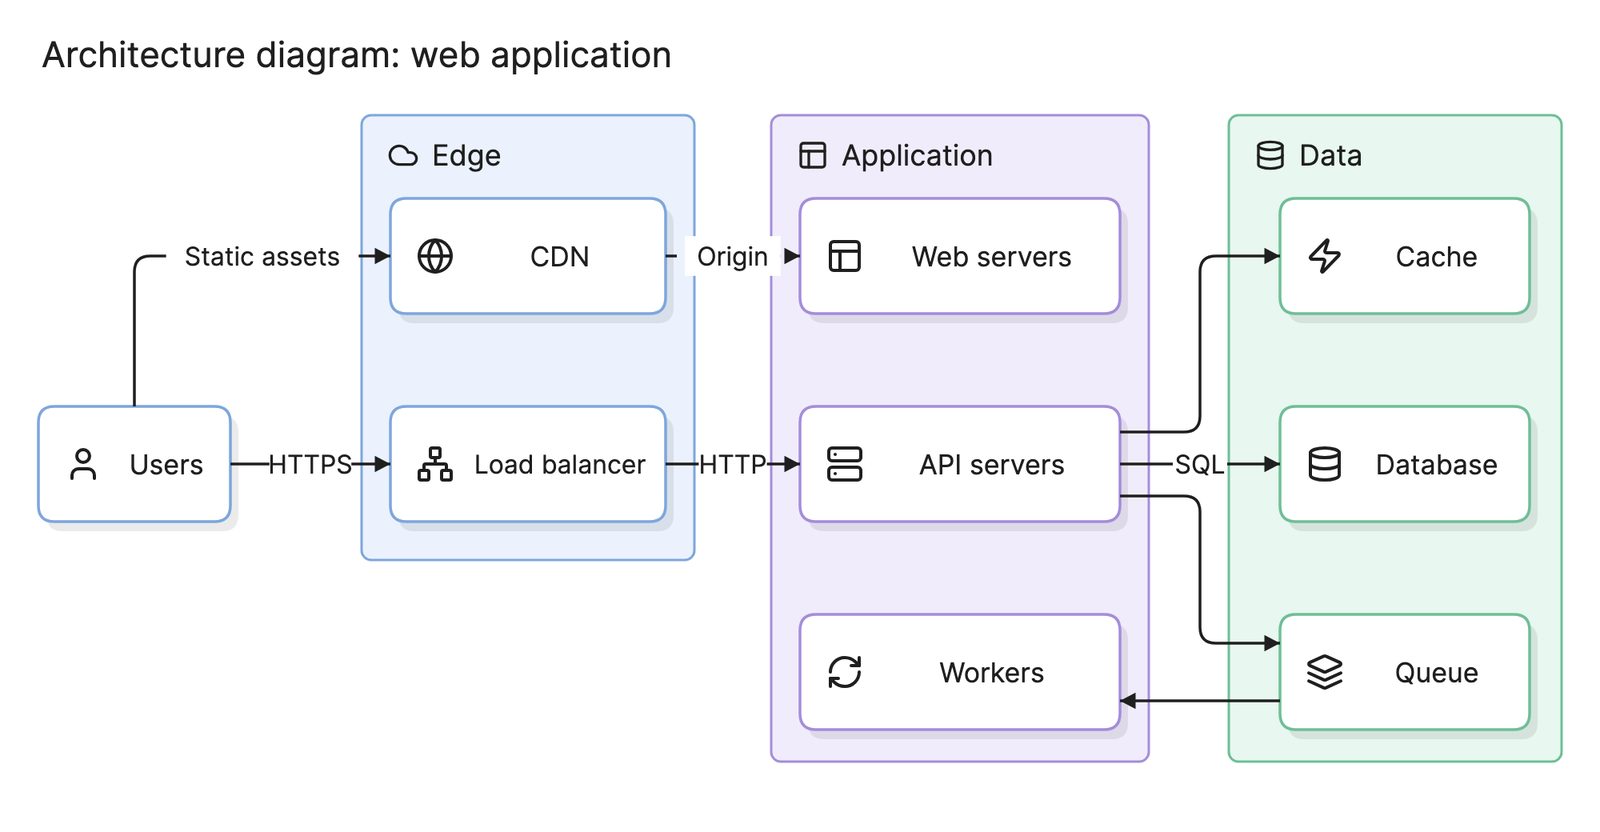
| Architecture diagram | Services and connections, in no fixed notation | How is the system put together overall? |
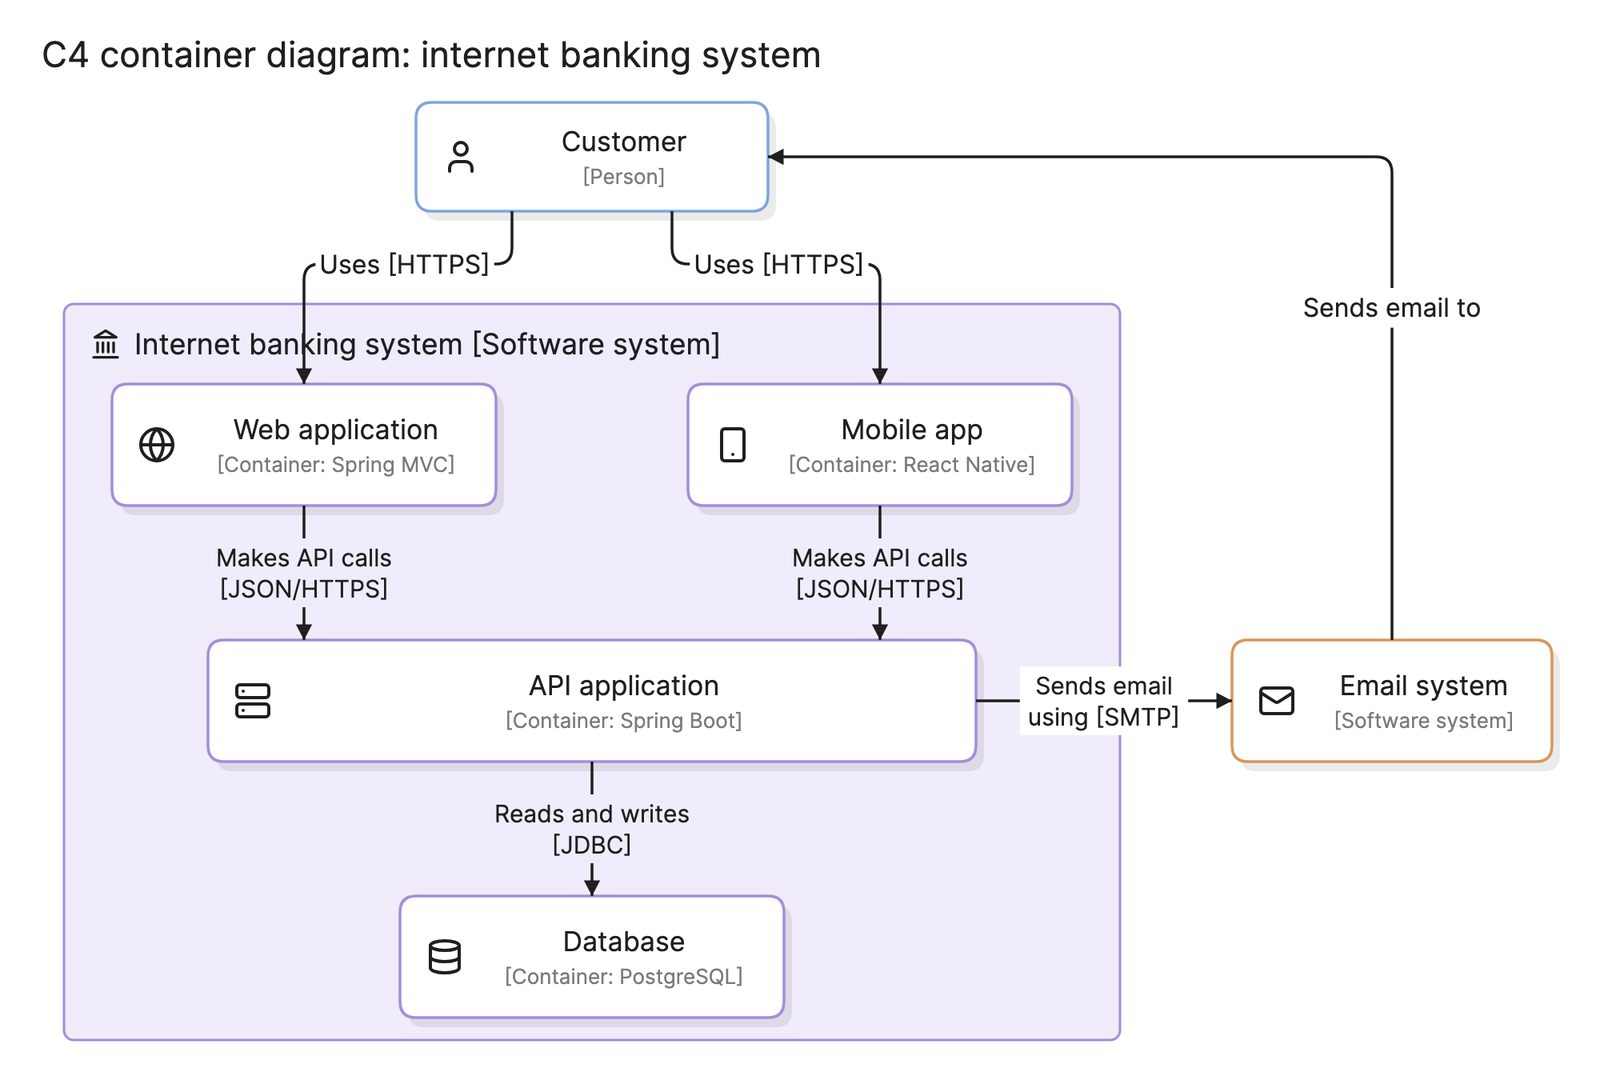
The C4 model has its own deployment diagram, which maps C4 containers onto deployment nodes. It serves the same purpose with C4’s simpler notation.
What tools can you use to make a deployment diagram?
- UML modeling tools. These provide the exact notation, including stereotypes and multiplicities, and link nodes back to the components in the same model. They suit formal projects.
- Drag-and-drop diagramming tools. Most include UML shape libraries with the 3D node and artifact shapes. They are quick to start with, but every environment change is a manual edit.
- AI diagramming tools. Tools like Eraser turn infrastructure code, a hosting inventory or a plain-English description into a deployment diagram you can keep editing, which suits environments that already exist and change often.
For more on this kind of diagram, see architecture diagrams.
Frequently asked questions
-
What is the difference between a deployment diagram and a component diagram?
A component diagram shows how the software is divided into parts and the interfaces between them, with no hardware in sight. A deployment diagram shows where the built artifacts run. The same component can appear as an artifact on several nodes in a deployment diagram.
-
What is the difference between a deployment diagram and an architecture diagram?
A deployment diagram is a UML diagram with a fixed notation for nodes, artifacts and communication paths. An architecture diagram is a looser term for any picture of a system's structure, often drawn with cloud icons and no formal rules. Many cloud architecture diagrams are deployment diagrams in everything but notation.
-
What is a node in a deployment diagram?
A node is anything that can host software. UML gives it two stereotypes: «device» for physical or virtual hardware, such as a server or a phone, and «executionEnvironment» for the software platform that runs inside it, such as a Java VM, a web browser or a database server. Environments are drawn nested inside devices.
-
What is an artifact in a deployment diagram?
An artifact is a physical piece of software that gets deployed: a JAR file, a container image, a script, a schema file or a compiled binary. It is drawn as a rectangle with the stereotype «artifact» or a small document icon, and it sits inside the node that hosts it.