Diagram types
Network diagram
A network diagram is a map of a computer network that shows its devices, such as routers, switches, firewalls and servers, and the links between them.
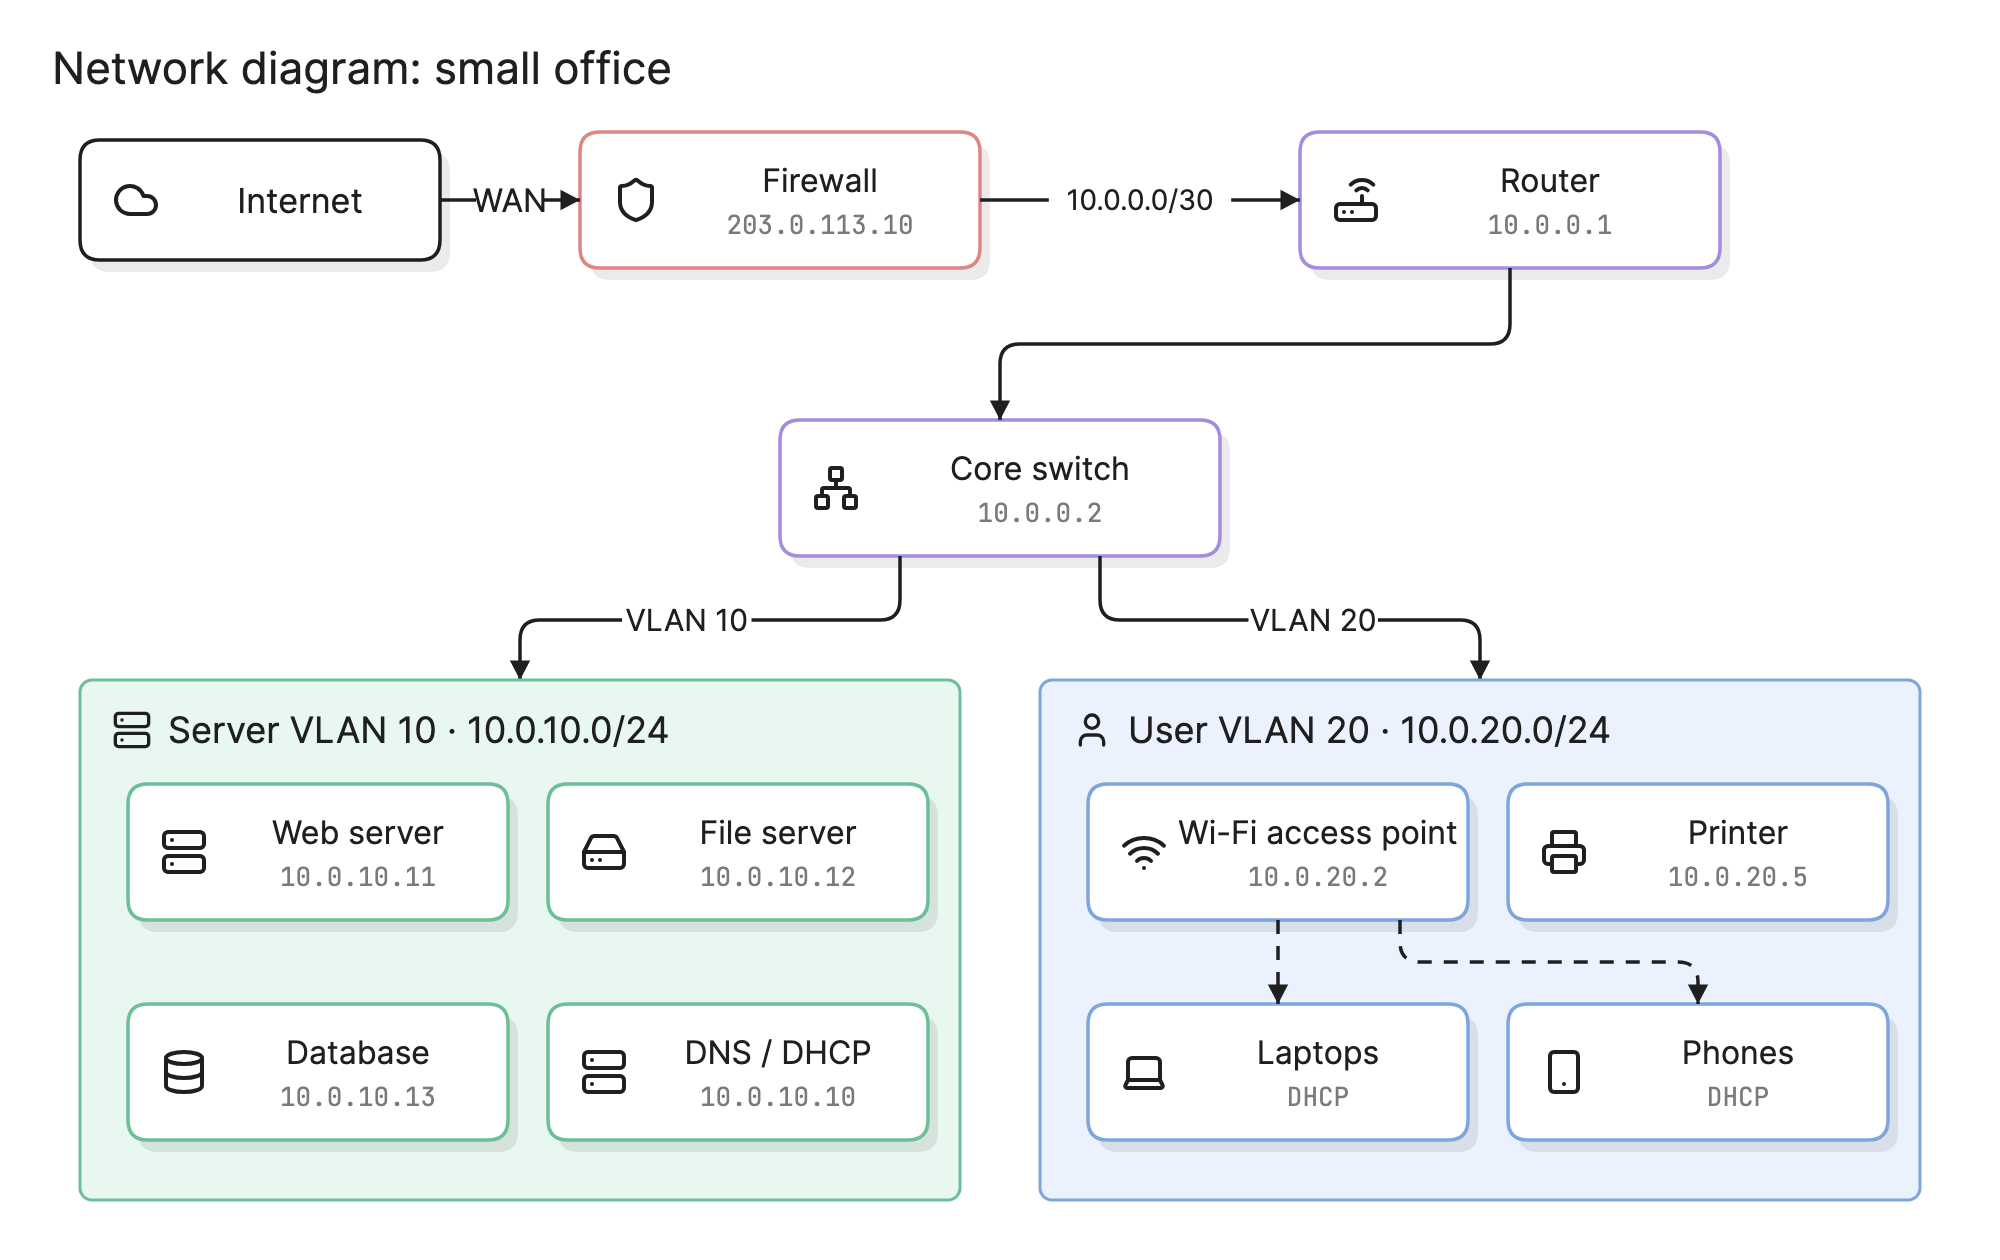
A network diagram is usually the first thing an engineer reaches for during an outage and the first thing an auditor asks for during a review. It turns a list of devices and addresses into something a team can point at and reason about together.
When should you use a network diagram?
- Troubleshooting. Trace the path between two hosts and find the device or boundary where it stops.
- Planning a change. See what a new subnet, firewall rule or site link will touch before you make it.
- Security reviews. Show where the boundaries are, what sits in each zone and how the zones connect.
- Compliance. Standards such as PCI DSS ask for a current diagram that shows segmentation and data flows.
What are the parts of a network diagram?
- Devices. Routers, switches, firewalls, load balancers, access points, servers and endpoints, each with a labeled icon. Important devices also get a hostname and address.
- Links. Lines between devices. A solid line is a wired or logical connection and a dashed line is usually wireless, a VPN or a backup path. A label can carry the link speed or interface.
- Subnets and zones. Tinted regions that group devices by VLAN, site or security zone, with the subnet in CIDR notation.
- Addresses. IP ranges on the groups, and fixed addresses on the devices that matter, such as the gateway, DNS and servers.
- Boundaries. The edge of the network, such as the internet, a partner link or a cloud provider, drawn as a cloud or an external node.
What are the types of network diagram?
Logical network diagram
A logical diagram shows how the network works: subnets, VLANs, routing, addressing and the boundaries between zones. Two devices in the same rack can be far apart on a logical diagram if they sit on different VLANs. The small office example at the top of this page is logical, which is why it shows subnets and addresses but not cables or ports.
Physical network diagram
A physical diagram shows what is installed and where: racks, patch panels, ports, cable runs and the model of each device. It answers questions like “which port is this server on?” and “what do we lose if that switch fails?”.
| Type | Shows | Best for |
|---|---|---|
| Logical | Subnets, VLANs, IP ranges, routing, firewall zones | Design, security review, troubleshooting connectivity |
| Physical | Racks, ports, cables, device models, locations | Installation, hardware replacement, cabling work |
How do you read a network diagram?
Start at the edge and follow the traffic inward. In the example above, the internet connects to the firewall, which holds the public address. The firewall passes traffic to the router over a small point-to-point subnet, 10.0.0.0/30, and the router hands everything to the core switch.
From the switch, the network splits into two VLANs. VLAN 10 is the server VLAN on 10.0.10.0/24, where the web server, file server, database and the DNS and DHCP server have fixed addresses. VLAN 20 is the user VLAN on 10.0.20.0/24, where laptops and phones get addresses from DHCP through the Wi-Fi access point.
Reading it that way answers practical questions. A laptop that cannot reach the file server has to cross from VLAN 20 to VLAN 10, so the problem is on the switch or router, not the firewall.
How do you create a network diagram?
- Decide what it is for. A security review needs zones and rules, while a cabling job needs ports and racks. Pick logical or physical, not both on one page.
- Inventory the devices. Pull from a CMDB, a discovery tool or a device export rather than from memory.
- Draw the backbone first. Place the internet edge, firewall, routers and core switches, then add the segments that hang off them.
- Group by subnet or zone. Put each VLAN, site or security zone in its own region and label it with the CIDR range.
- Add the addresses that matter. Gateways, DNS, servers and anything else with a fixed address. Leave DHCP clients as a single group.
- Walk a packet through it. Pick a real path, such as a user reaching a server, and check that every hop on the diagram exists in the network.
What are common network diagram mistakes?
- Mixing logical and physical. A diagram that shows VLANs and cable runs at once is hard to read and hard to keep accurate.
- Drawing every endpoint. Fifty identical laptops add nothing. Show one group with a count.
- Missing the boundaries. If the internet, VPN tunnels and partner links are not on the diagram, nobody can review the attack surface.
- Letting it drift. Update the diagram as part of each network change, or it quietly becomes fiction.
How does a network diagram compare with other diagrams?
| Diagram | What it shows | Use it to answer |
|---|---|---|
| Network diagram | Devices, links, subnets and zones | How does traffic get from here to there? |
| Architecture diagram | A software system’s services and how they interact | How is this application built? |
| Deployment diagram | Which software runs on which hardware or environment | Where does this component run? |
| Data flow diagram | How data moves between processes and stores | Where does this data come from and go? |
What tools can you use to make a network diagram?
- Network management and discovery tools. These scan the network and draw what they find, which is accurate but usually cluttered.
- Drag-and-drop diagramming tools. These give you full control and vendor icon libraries, but every network change means a change by hand.
- AI diagramming tools. Tools like Eraser turn a description or a device list into a first draft of a network diagram that you can keep editing as text, so it can be versioned next to your configuration.
For more on this kind of diagram, see network diagrams.
Frequently asked questions
-
What is the difference between a logical and a physical network diagram?
A logical network diagram shows how traffic flows: subnets, VLANs, IP addresses, routing and firewall boundaries. A physical network diagram shows the hardware and where it lives: racks, ports, cables and which device plugs into which. Most teams keep one of each, because the questions they answer are different.
-
What is the difference between a network diagram and an architecture diagram?
A network diagram describes the network itself, meaning the devices, links and addresses that carry traffic. An architecture diagram describes a software system and its services, and treats the network as a detail. The two overlap in cloud environments, where VPCs and subnets appear on both.
-
What symbols does a network diagram use?
There is no single standard. Most diagrams use an icon per device type, such as a cloud for the internet, a shield or brick wall for a firewall and stacked rectangles for a switch or server, with lines for links. Cloud providers publish their own icon sets, and many tools include them.
-
How often should a network diagram be updated?
Every time the network changes, which means tying updates to your change process rather than to a calendar. A diagram that lags the network by a few changes is still useful for orientation, but one that is a year old will mislead whoever uses it to troubleshoot an outage.