Diagram types
Component diagram
A component diagram is a UML diagram that shows the components of a software system, the interfaces each provides or requires and how they are wired together.
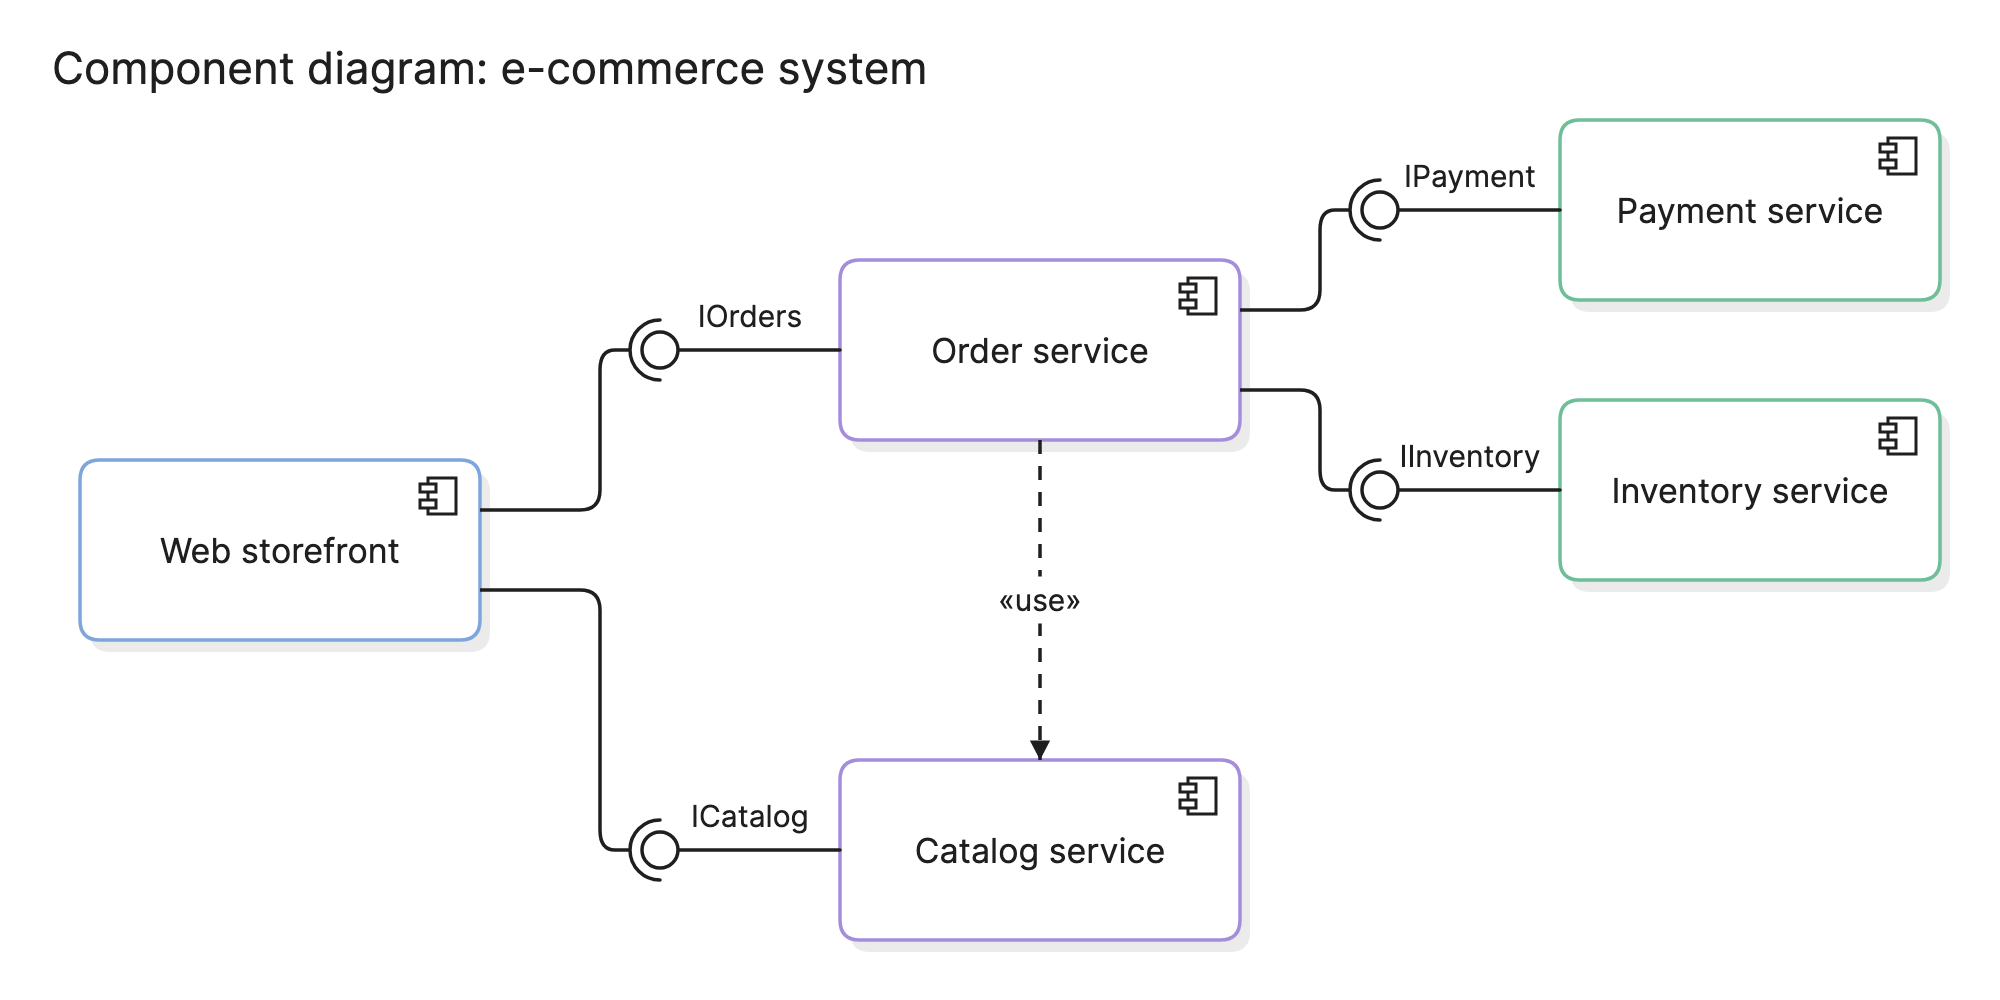
Teams use component diagrams to decide where the seams in a system go: which parts can be built, tested and replaced on their own, and what each one promises to the rest. That makes them useful long before any code exists, and again when a monolith is being split into services.
When should you use a component diagram?
- Designing a modular system. Decide what the components are and which interfaces connect them before the structure is locked in by code.
- Splitting a monolith. Draw the components you intend to extract and the interfaces they will need, then compare that with the dependencies the code actually has.
- Integrating third-party software. Show which interfaces an external library or service provides and which of your components depend on them.
- Documenting an existing codebase. Give new engineers the units of the system and the contracts between them, without class-level detail.
What symbols does a component diagram use?
A component diagram uses a small set of UML symbols. The example above uses all of them except the port.
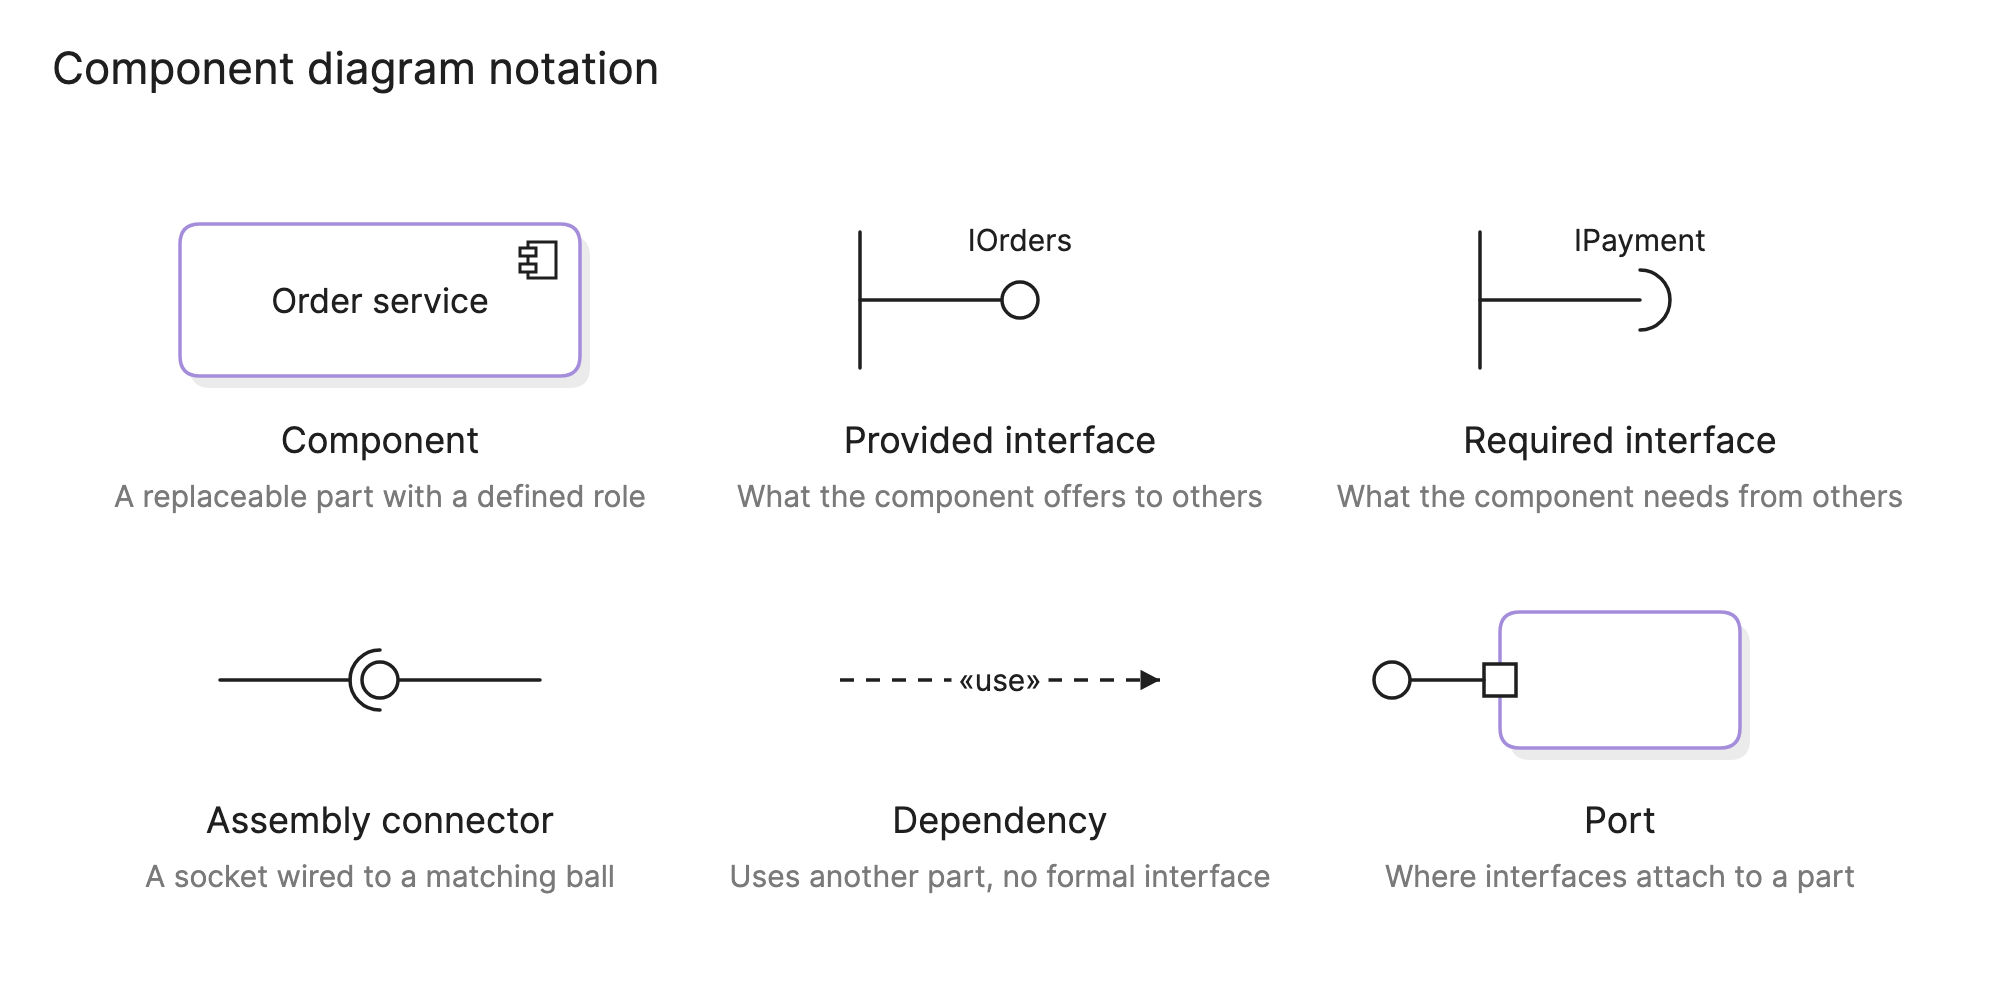
- Component. A rectangle with the component glyph in one corner, named for what it does, such as “Order service”. The stereotype «component» can replace the glyph.
- Provided interface. A ball on a stick, the lollipop. It names a contract the component offers, such as
IOrders. - Required interface. A half circle on a stick, the socket. It names a contract the component needs another component to provide.
- Assembly connector. A socket drawn around a ball. It wires a required interface to the provided interface that satisfies it.
- Dependency. A dashed arrow, often with the stereotype «use». It says one component needs another without naming a formal interface.
- Port. A small square on a component’s edge where one or more interfaces attach, used when a component has several distinct interaction points.
How do you read a component diagram?
Start with the component that faces the user and follow its sockets. In the e-commerce example at the top of this page, the web storefront requires two interfaces, IOrders and ICatalog. Each socket wraps a ball, so you can see which component provides each one: the order service and the catalog service.
The order service has sockets of its own. It needs IPayment from the payment service and IInventory from the inventory service, which tells you that placing an order touches both. The dashed «use» arrow to the catalog service is different. The order service reads catalog data, but through no defined interface, which is the kind of dependency that becomes a problem when the catalog service changes.
Reading it this way answers a practical question: if the payment provider changes, only the component behind IPayment has to change, as long as the interface stays the same.
What are the types of component diagram?
Logical
Shows the components as designed, with their interfaces, regardless of how they are built or packaged. The e-commerce example is a logical component diagram.
Physical
Shows the components as built artifacts, such as JAR files, DLLs or container images, with the dependencies between them. This is close to a deployment diagram and is often combined with one.
Nested
Shows the components inside a larger component, with ports on the outer boundary delegating to inner interfaces. Use it when a subsystem is complex enough to need its own diagram.
How do you create a component diagram?
- Choose the boundary. Decide which system or subsystem the diagram covers, and treat everything else as external.
- Identify the components. Group related classes, modules or services into units that could be built and replaced on their own.
- Name the interfaces. For each component, list what it provides and what it requires. Give each interface a name that describes the contract, not the technology.
- Wire them up. Connect each socket to the ball that satisfies it, and use dashed dependencies only where no interface exists.
- Review the dependencies. Look for cycles, for components with too many sockets and for dependencies with no interface, since those are the first places a change will hurt.
What are common component diagram mistakes?
- Drawing classes as components. A component should be a deployable or replaceable unit, not a single class. If the diagram has 50 boxes, it is probably a class diagram.
- Skipping the interfaces. A component diagram with only dashed arrows shows dependencies but not contracts, which is the main thing it is for.
- Naming interfaces after technology.
IOrdersdescribes a contract.OrdersRestClientdescribes an implementation and will be wrong once it changes. - Hiding cyclic dependencies. If two components require each other, draw it. The cycle is the finding.
How does a component diagram compare with other diagrams?
| Diagram | What it shows | Use it to answer |
|---|---|---|
| Component diagram | The units of a system and the interfaces between them | What are the parts, and what do they promise each other? |
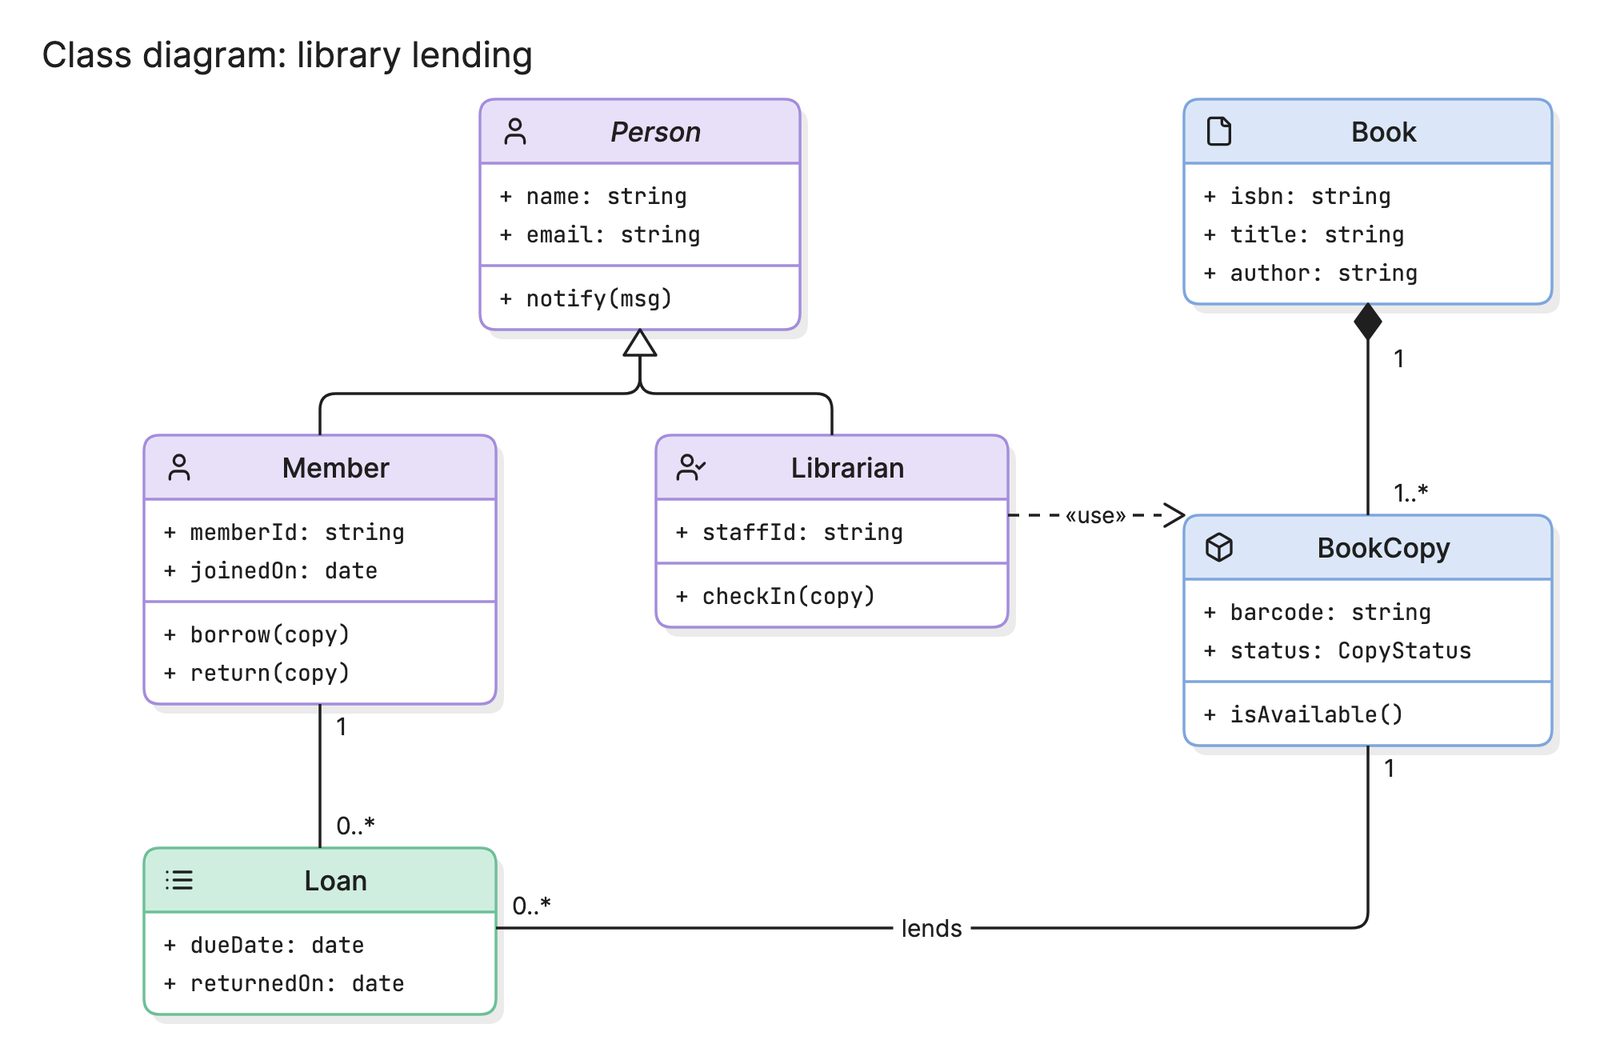
| Class diagram | The classes inside the code and their relationships | How is the code inside a component organized? |
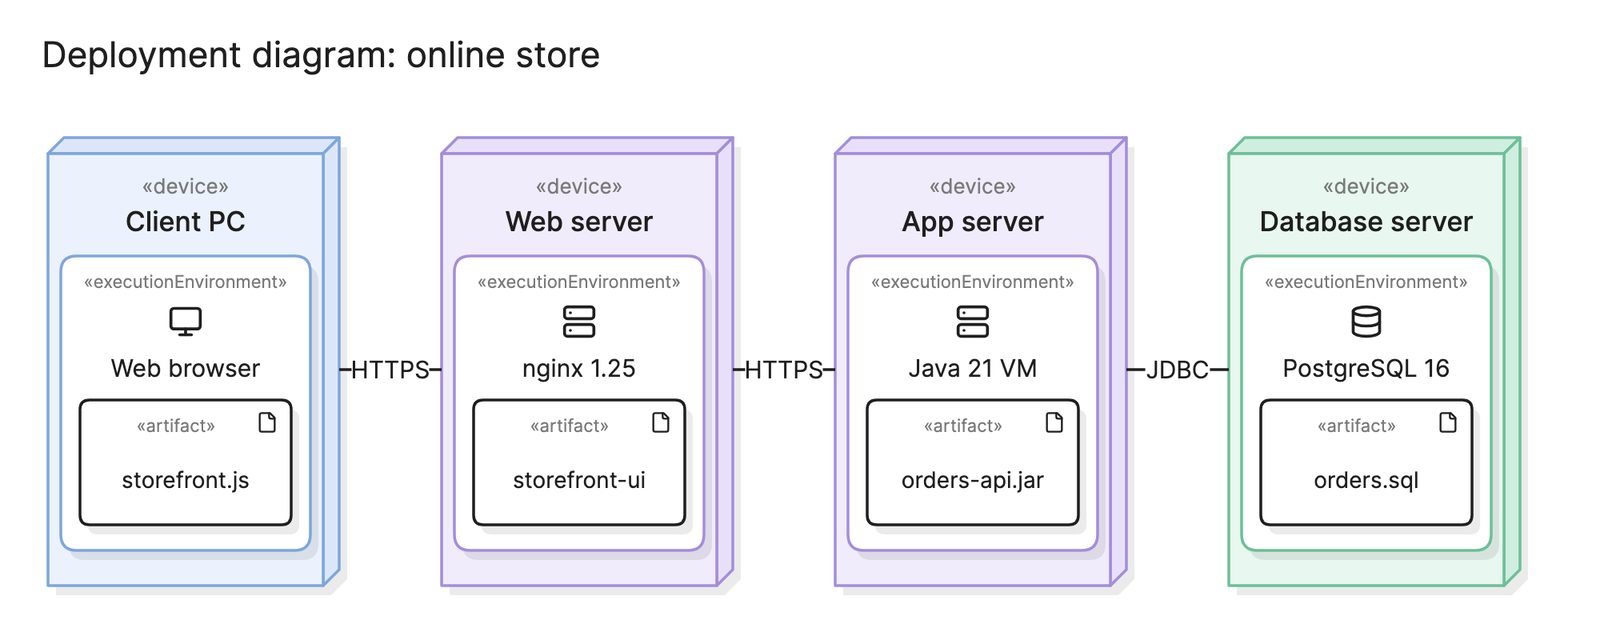
| Deployment diagram | Artifacts mapped to the nodes they run on | Where does each part run? |
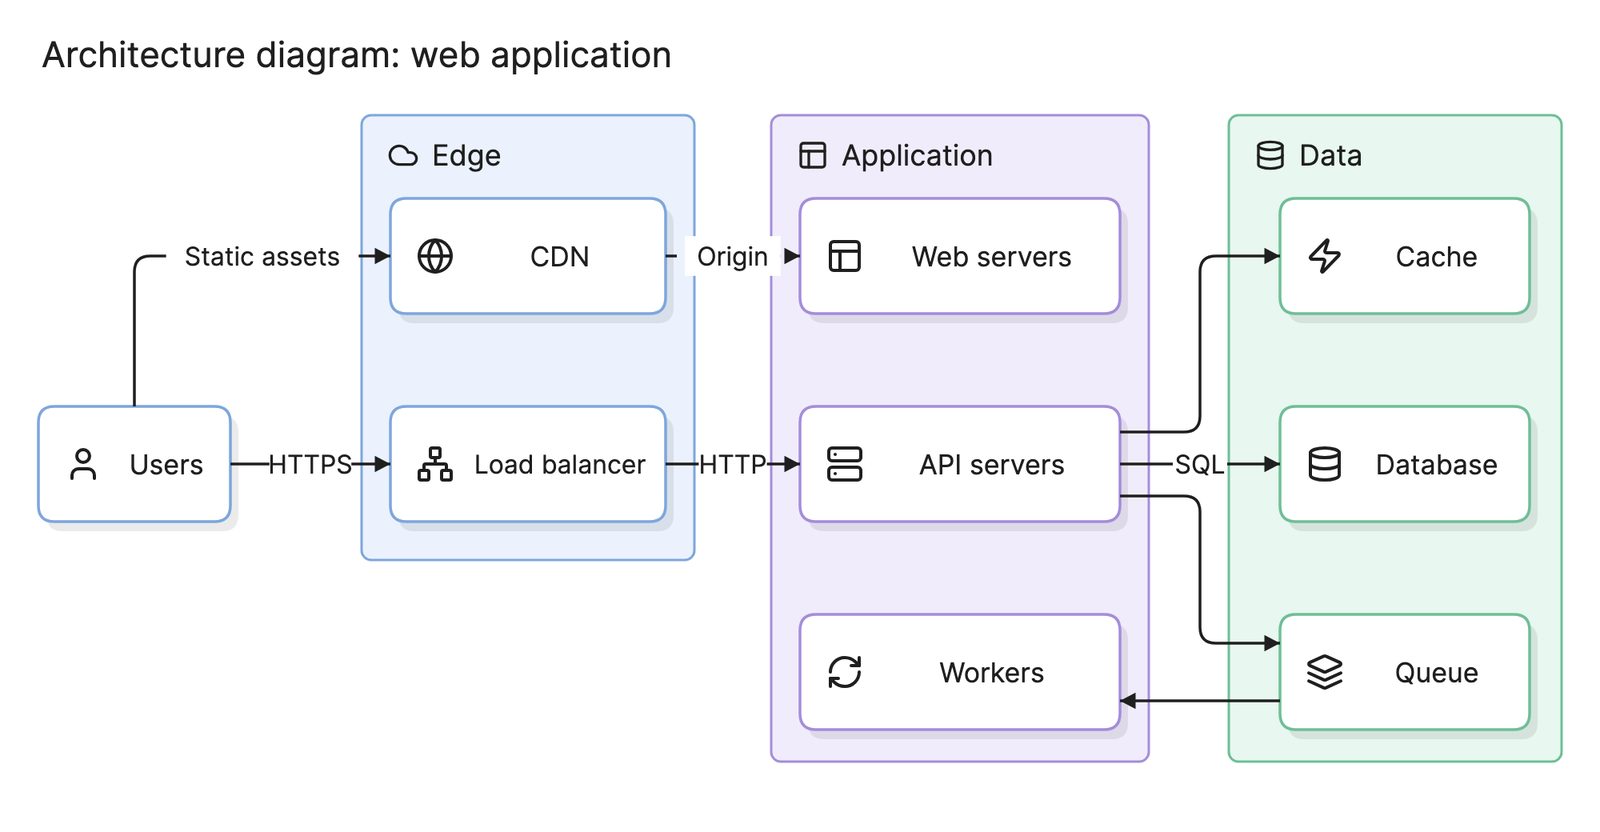
| Architecture diagram | Services, data stores and connections, in no fixed notation | How is the whole system put together? |
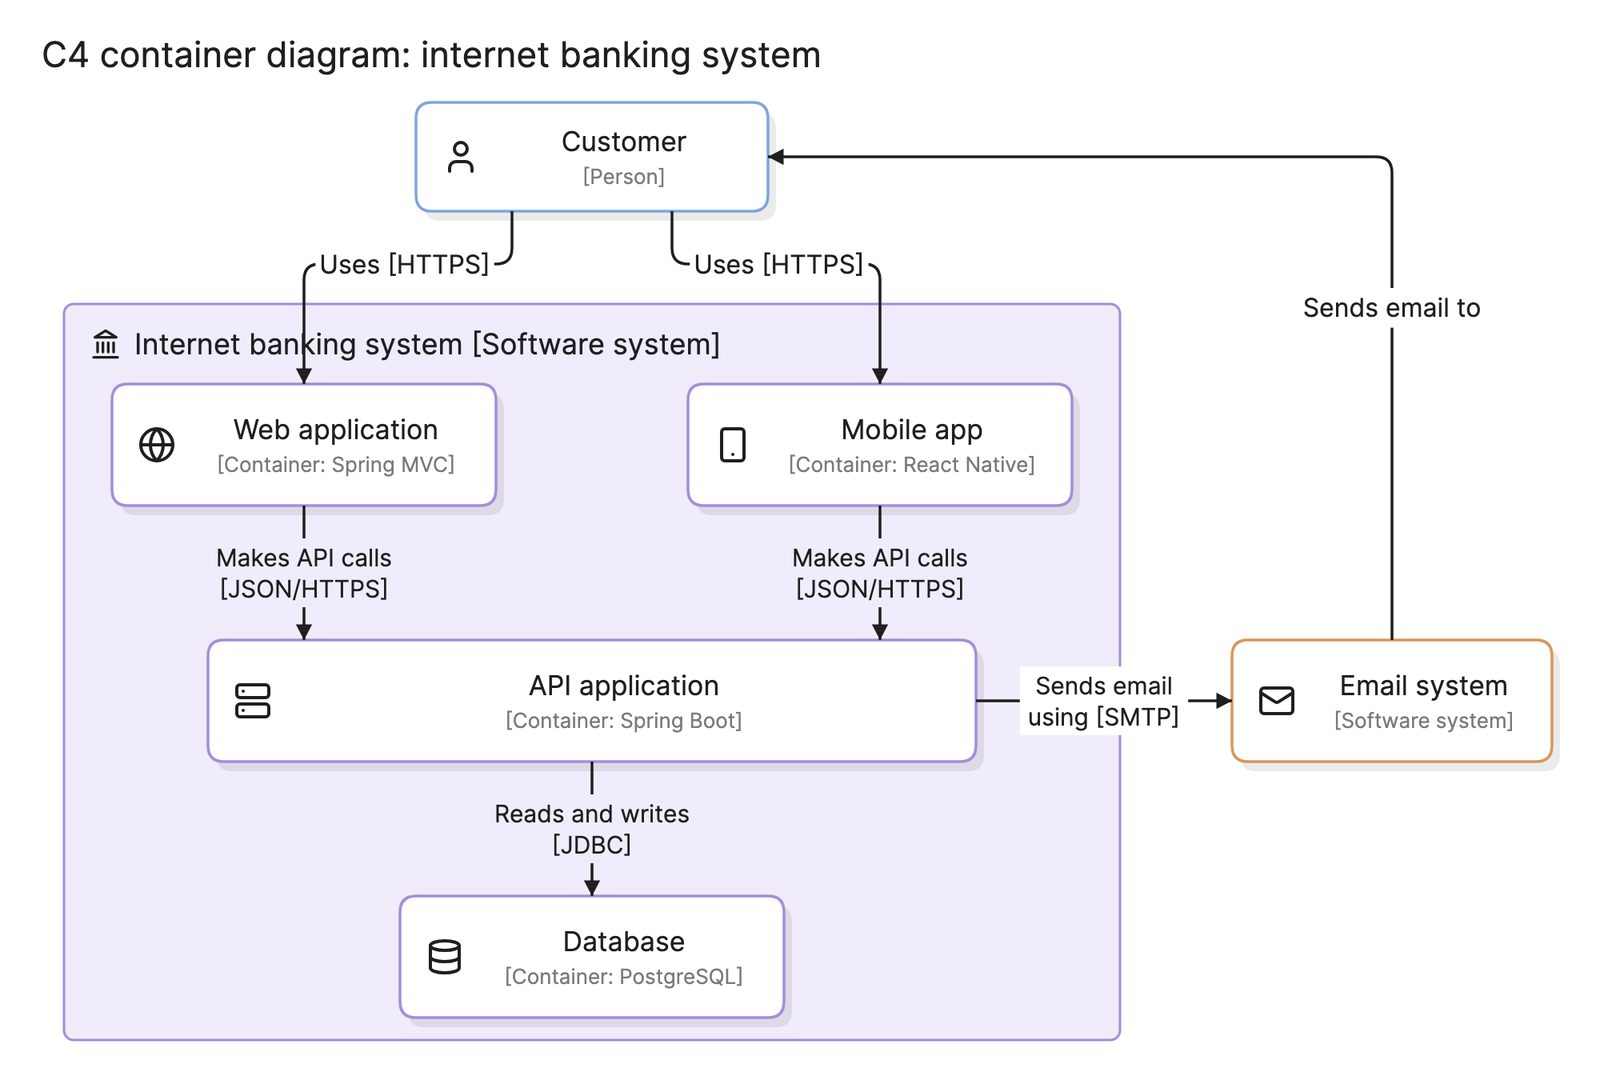
In the C4 model, the third level is also called a component diagram. It shows the components inside one container, but it uses C4’s own boxes and arrows rather than UML’s lollipops and sockets.
What tools can you use to make a component diagram?
- UML modeling tools. These enforce the notation and keep components, interfaces and classes linked in one model. They suit large, formal projects and are heavier than most teams need.
- Drag-and-drop diagramming tools. Most include UML shape libraries with the component glyph and interface symbols. They are quick for a one-off diagram, but the layout is maintained by hand.
- AI diagramming tools. Tools like Eraser turn a written description of a system into a component diagram you can keep editing, which is useful when the components are already listed in a design doc or a repository’s folder structure.
For more on this kind of diagram, see architecture diagrams.
Frequently asked questions
-
What is the difference between a component diagram and a class diagram?
A class diagram shows the classes inside the code, with their attributes, methods and inheritance. A component diagram works one level up, showing the units those classes are packaged into and the interfaces between them. A component often contains dozens of classes.
-
What is the difference between a component diagram and a deployment diagram?
A component diagram shows how the software is divided up, with no mention of hardware. A deployment diagram shows where the built artifacts run. Teams often draw both: the component diagram for the design and the deployment diagram for the environment.
-
What does the lollipop symbol mean in a component diagram?
The ball on a stick, or lollipop, is a provided interface: a contract the component offers to others. The half circle, or socket, is a required interface: a contract the component needs someone else to fulfill. When a socket is drawn around a ball, the two components are wired together.
-
Is a component diagram part of UML?
Yes. The component diagram is one of the structure diagrams in the UML standard, alongside class, deployment and package diagrams. The component symbol, the lollipop and socket notation and the dashed dependency arrow all come straight from the UML specification.