Diagram types
Swimlane diagram
A swimlane diagram is a flowchart divided into lanes, one per role, team or system, so every handoff shows up as an arrow crossing from one lane to the next.
Most delays in a process happen between teams rather than inside them. A swimlane diagram makes those handoffs visible, which is why it is the format teams reach for when a process crosses departments or systems.
When should you use a swimlane diagram?
- A process crosses teams. Onboarding, procurement, incident response and hiring all involve several groups, and the lanes show where work changes hands.
- Ownership is unclear. Putting every step in a lane forces a decision about who does it.
- You are looking for delays. Each crossing is a queue. Counting them is a quick way to find where work waits.
- Systems are involved. Give a system its own lane to show where a person acts and where software does.
What are the parts of a swimlane diagram?
Lanes
Each lane belongs to one actor: a role, a team, a department or a system. Name lanes by role rather than by person, so the diagram stays correct when people change jobs.
Steps and decisions
Inside the lanes, the diagram uses ordinary flowchart symbols. A rectangle is a step, a diamond is a decision and a pill marks the start and the end.
Handoffs
An arrow crossing from one lane to another is a handoff. These are the most important lines on the diagram, because they are where work waits, gets lost or arrives incomplete.
Phases
Some diagrams add a second axis across the lanes, dividing the process into stages such as “Contract”, “Setup” and “Launch”. This is common in cross-functional flowcharts, which is the name many tools give to the same diagram.
What are the types of swimlane diagram?
Horizontal lanes
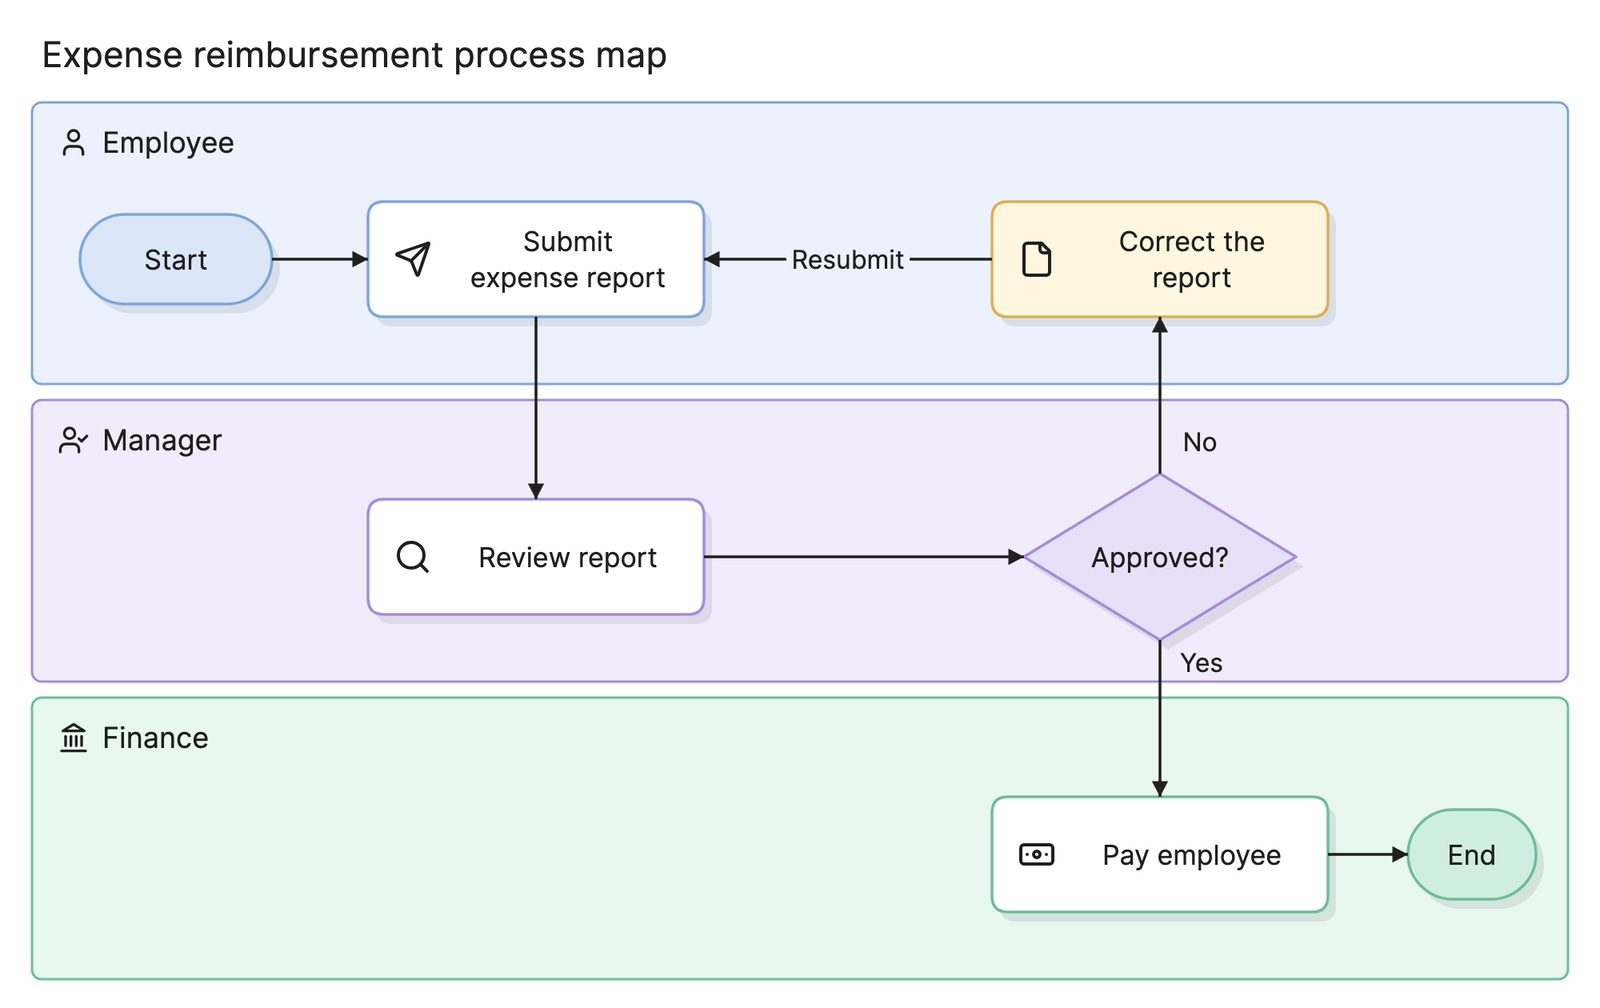
Lanes run left to right, stacked top to bottom, and the flow reads left to right. This is the usual choice for a long process with a few roles, and it is the layout used in the expense example on the process map page.
Vertical lanes
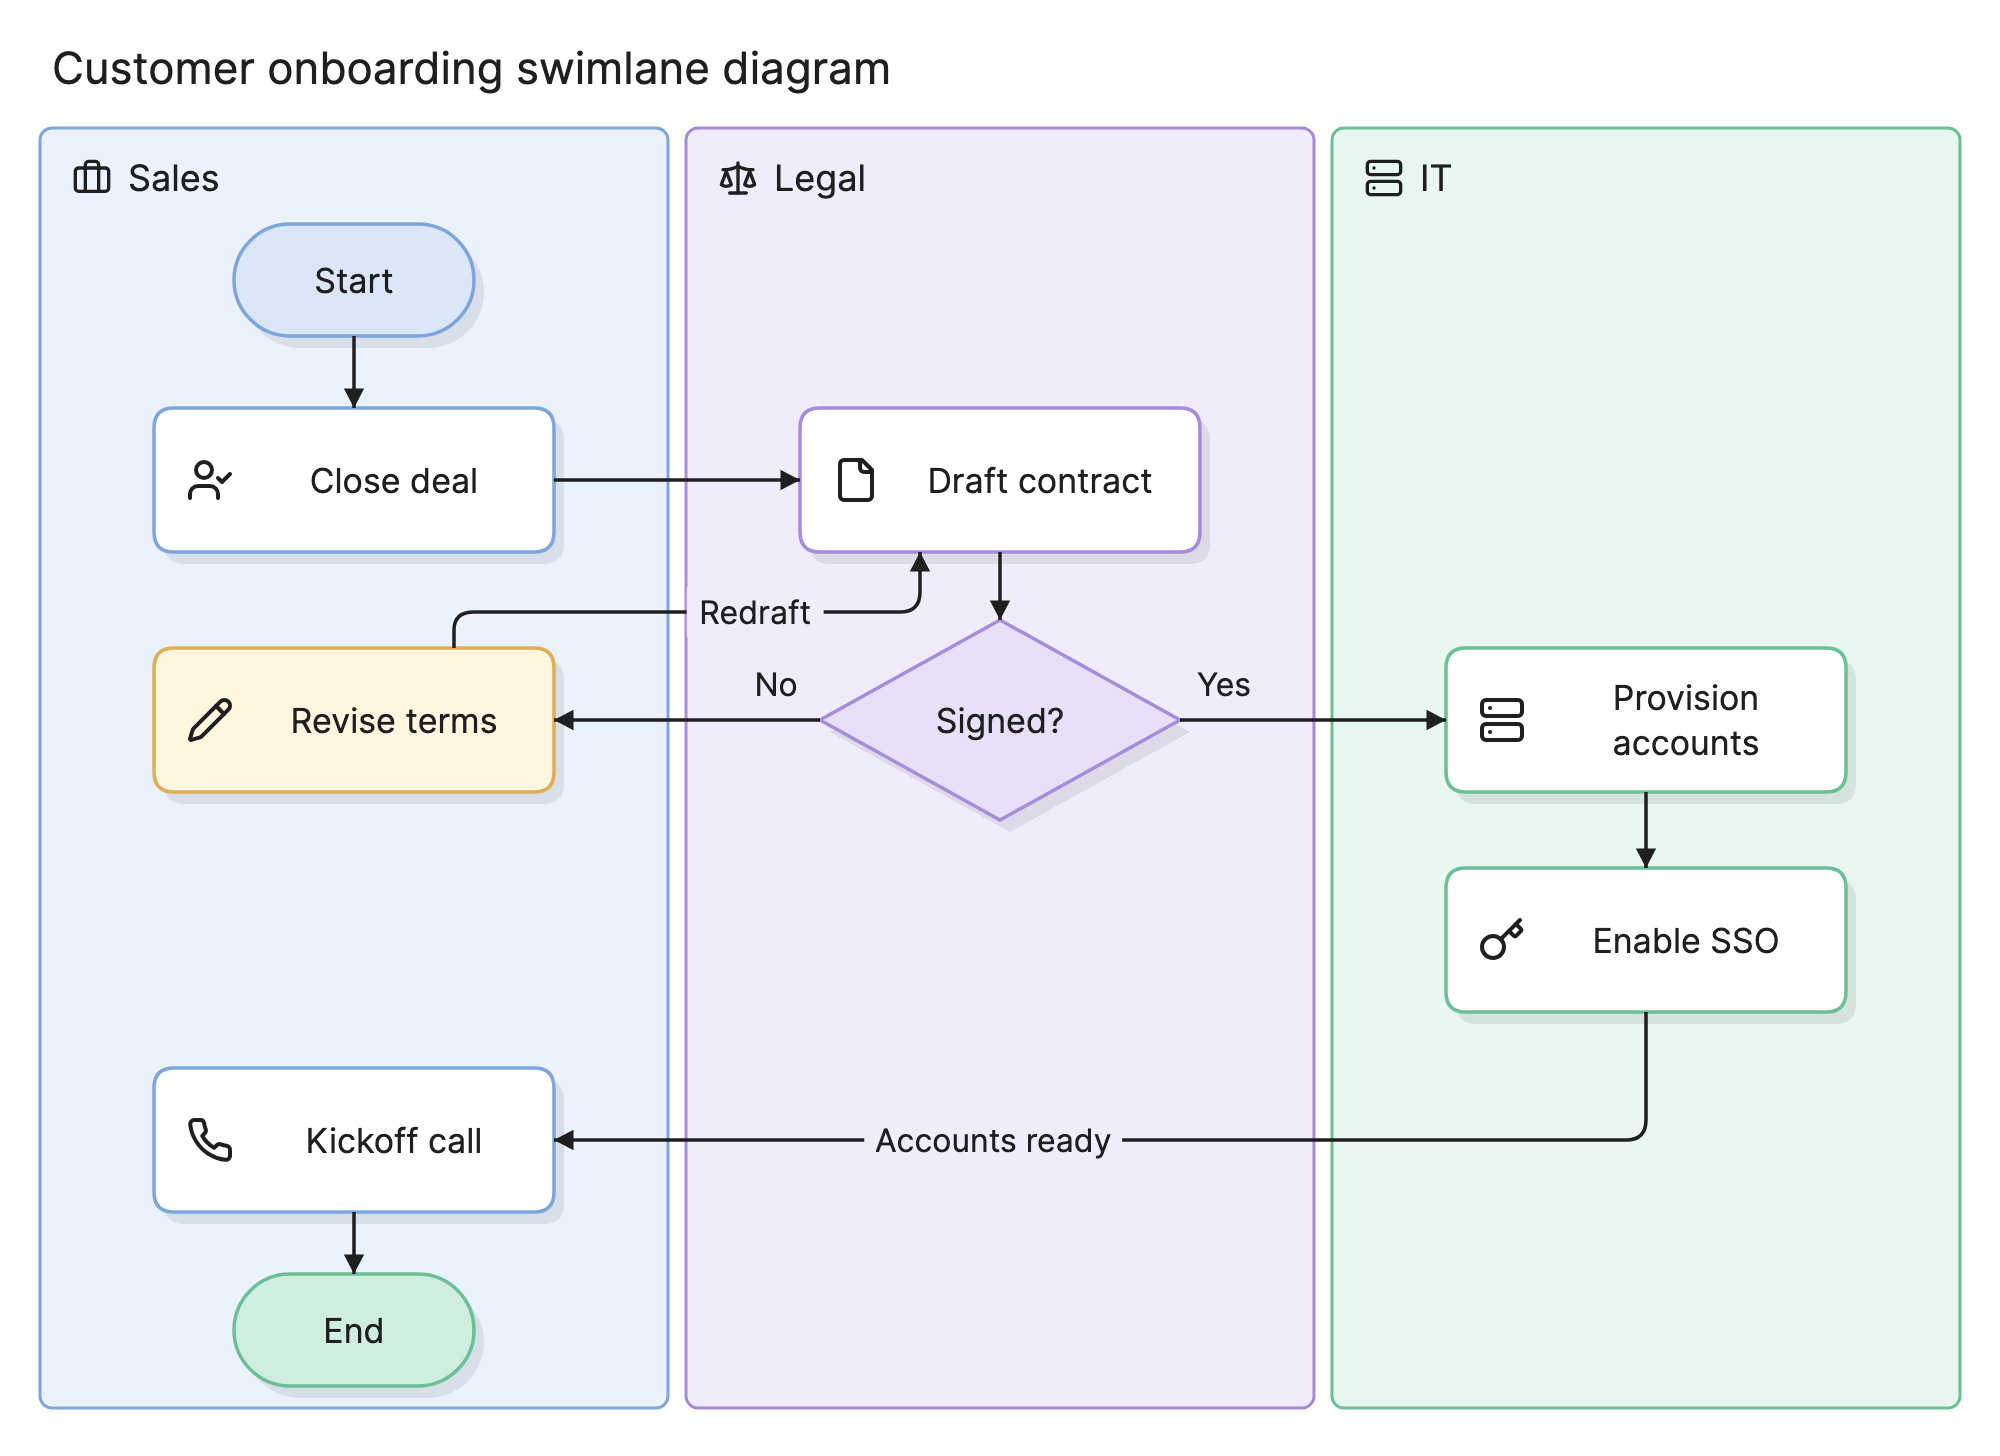
Lanes stand side by side and the flow reads top to bottom, as in the onboarding example above. It works well when there are more roles than steps, and it fits a portrait page.
Lanes by system
Lanes represent applications instead of people, such as a CRM, a billing system and a warehouse system. This variant shows integrations and is useful when documenting how data moves, though a data flow diagram may be a better fit if order does not matter.
BPMN pools and lanes
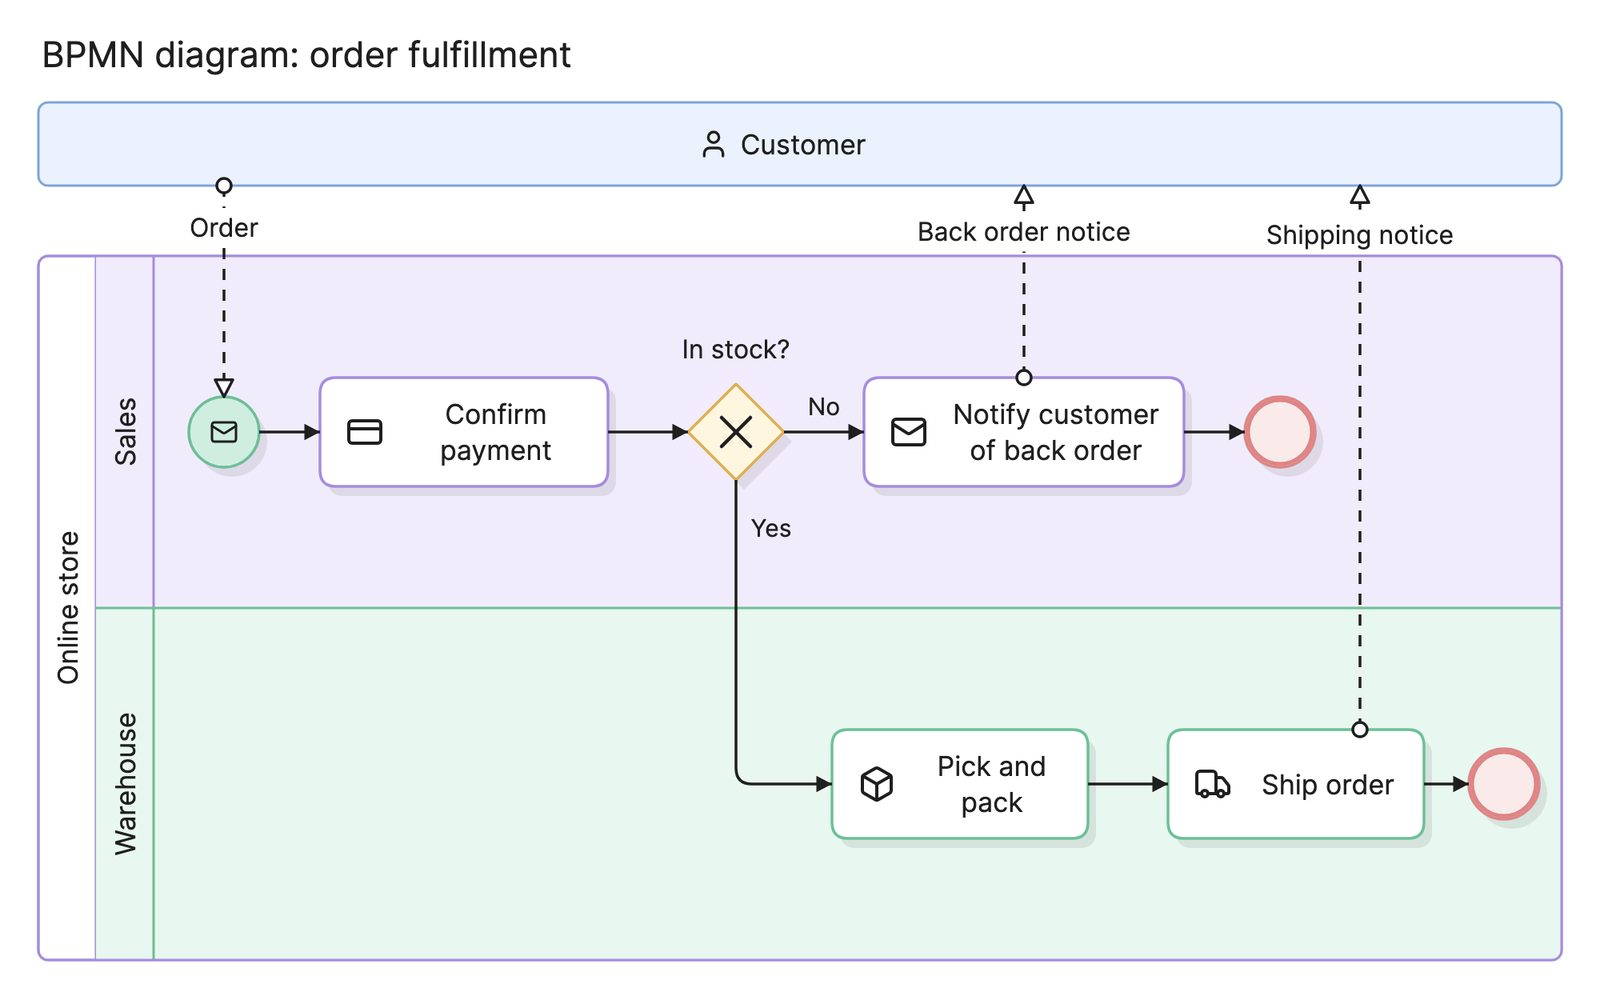
BPMN formalizes swimlanes. A pool is a whole participant, lanes divide it, and the standard defines what can cross between them.
How do you read a swimlane diagram?
Start at the pill marked Start and follow the arrows, paying attention each time a line crosses into another lane. In the onboarding example, sales closes the deal and the flow crosses into the legal lane, where legal drafts the contract.
The decision asks whether the customer signed. If not, the flow crosses back to sales, which revises the terms, and the arrow labeled Redraft returns to legal. That loop is the first place to look for delays, since each pass means two more handoffs. If the contract is signed, the flow crosses into IT, which provisions accounts and enables single sign-on, then hands back to sales for the kickoff call.
Counting the crossings tells you the process has five handoffs on the happy path and two more for each redraft, which a plain flowchart would hide.
How do you create a swimlane diagram?
- Set the scope. Name the trigger that starts the process and the result that ends it.
- List the actors. Write down every role, team and system that touches the process, and give each one a lane. Four to six lanes is a comfortable limit.
- List the steps in order. Start each with a verb, and place it in the lane of whoever performs it.
- Add the decisions. Phrase each one as a question, and label every exit.
- Draw the handoffs. Connect the steps and check that every crossing is real, not a drawing convenience.
- Walk through a real case. Follow one actual instance with the people involved and fix what does not match.
What are common swimlane diagram mistakes?
- Lanes for people instead of roles. The diagram breaks the day someone changes jobs.
- Too many lanes. Beyond six or so, the diagram becomes a grid of empty space. Merge minor actors or split the process.
- Steps outside any lane. Every step has an owner. If you cannot say who, that is a finding worth recording.
- Hiding the loops. Rejections and rework are often the bulk of the handoffs, so draw them.
- Mapping the ideal process. Document what happens today first, or the problems stay invisible.
How does a swimlane diagram compare with other diagrams?
| Diagram | What it shows | Use it when |
|---|---|---|
| Flowchart | Steps and decisions, without ownership | One actor performs the whole process |
| Swimlane diagram | Steps and decisions, with a lane per actor | The process crosses teams or systems |
| Process map | A business process at a chosen level of detail, often as swimlanes | You are improving or auditing how work is done |
| BPMN | Pools, lanes, events and gateways under a formal standard | The model must be precise or executable |
| Sequence diagram | Messages between components in time order | You are showing how software components interact |
What tools can you use to make a swimlane diagram?
- Whiteboards and sticky notes. Draw the lanes as rows on a whiteboard and move notes between them. This is ideal for a workshop, but the result has to be redrawn to keep it.
- Drag-and-drop diagramming tools. Most include swimlane templates that keep steps inside their lanes as you move them, which suits a diagram you plan to maintain.
- AI diagramming tools. Tools like Eraser turn a written procedure into a first draft of a swimlane diagram, with the lanes already assigned, that you can keep editing.
For more on this kind of diagram, see process flow diagrams.
Frequently asked questions
-
What is the difference between a swimlane diagram and a flowchart?
A swimlane diagram is a flowchart with lanes. The shapes and arrows are the same, but each step sits in the lane of the role, team or system that performs it. A plain flowchart shows what happens; a swimlane diagram also shows who does it.
-
What is the difference between a swimlane diagram and a process map?
A process map is any diagram of a business process, and a swimlane diagram is the most common form it takes. A process map can also be a simple flowchart, a SIPOC table or a value stream map.
-
Should swimlanes be horizontal or vertical?
Either works, and the meaning is the same. Horizontal lanes suit a process with many steps and few roles, since the flow can run a long way left to right. Vertical lanes suit a process with more roles than steps, or one that will be read on a tall page.
-
What are pools and lanes in BPMN?
BPMN uses the same idea with stricter rules. A pool is a whole participant, such as a company or a customer. Lanes divide a pool by role or department. Sequence flows stay inside a pool, and only message flows cross between pools.