Diagram types
Dependency graph
A dependency graph is a directed graph in which each node is a package, module, task or service and each edge shows that one of them depends on another.
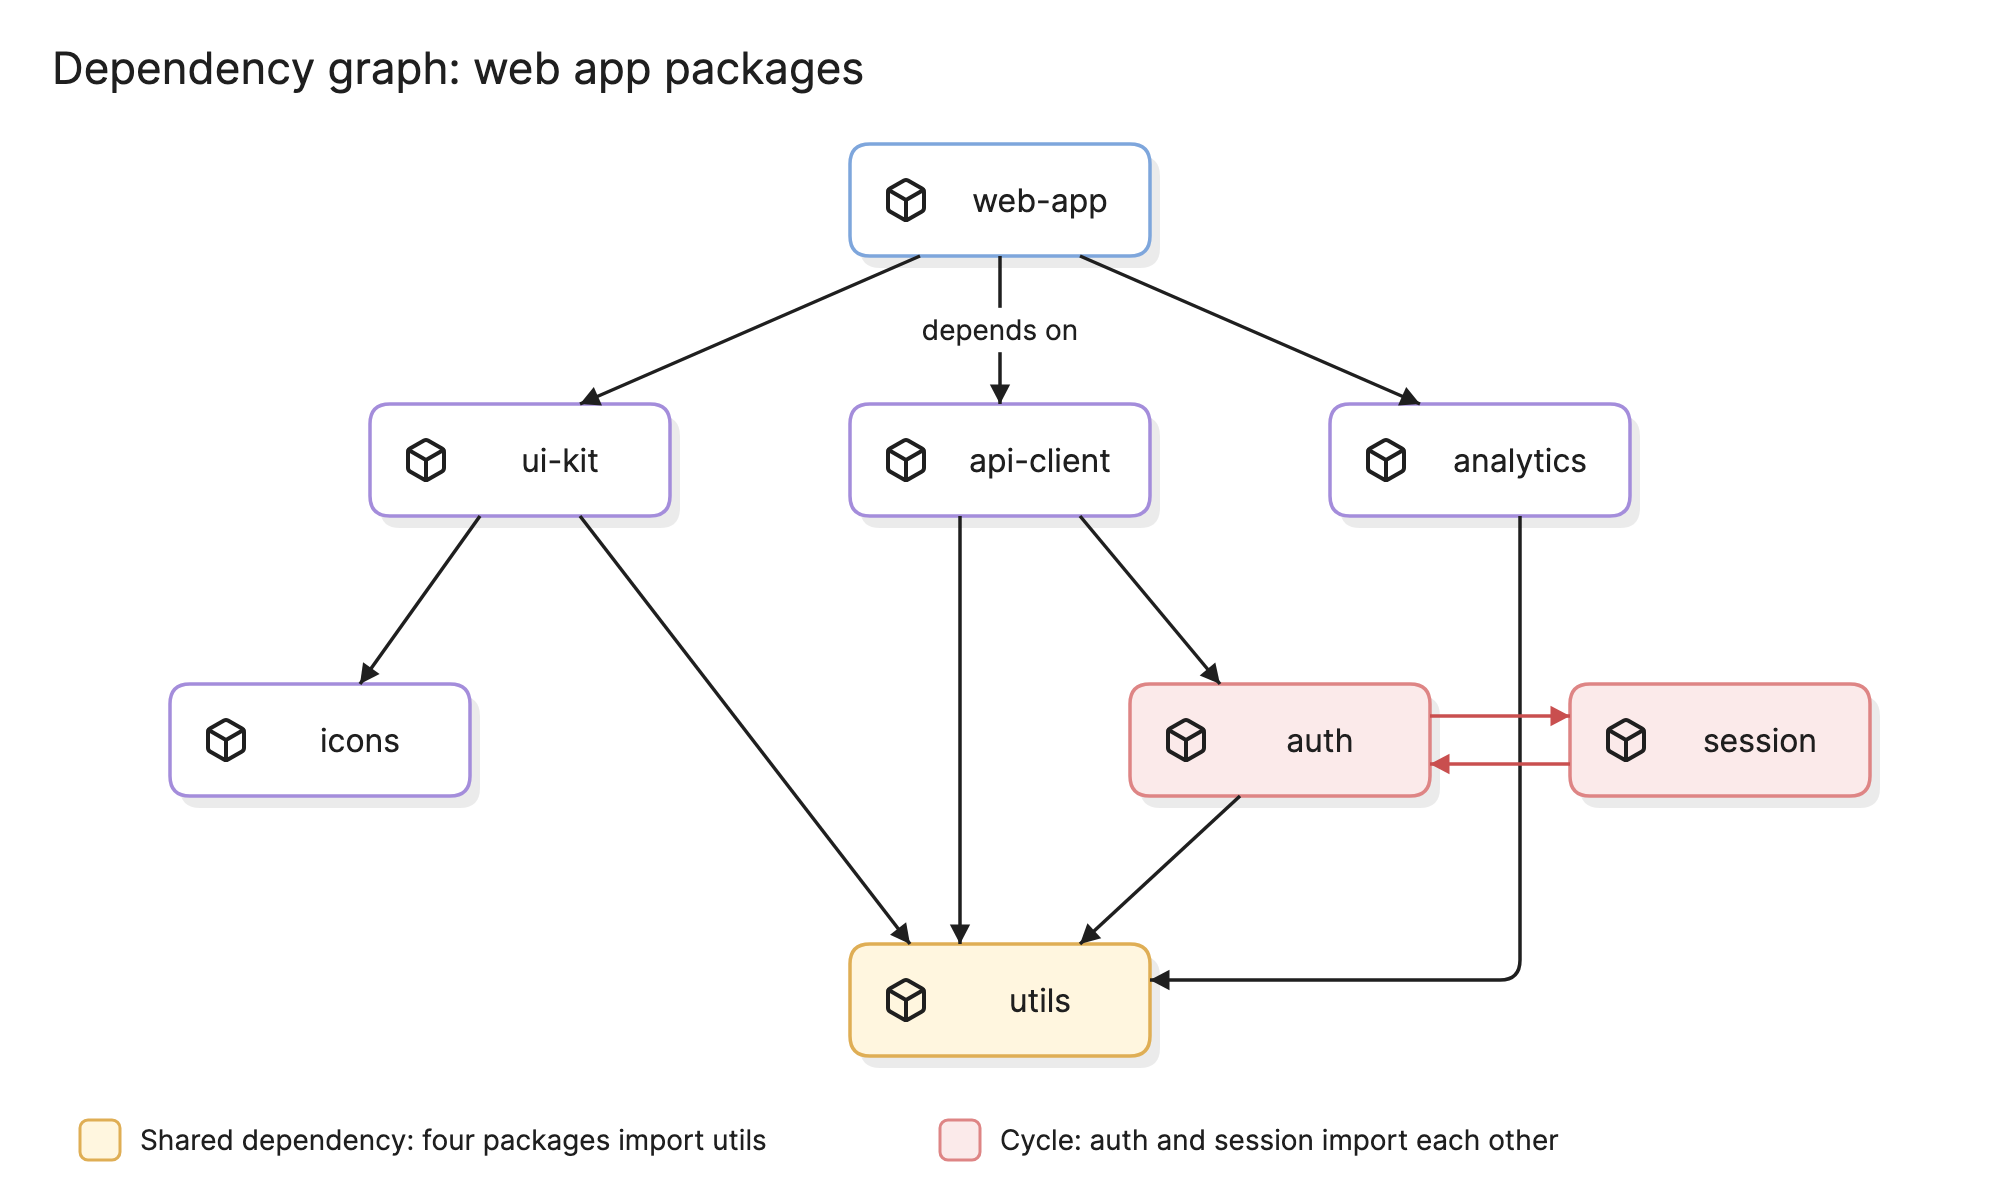
Engineers draw dependency graphs to see what a change will affect, what has to be built first and where a codebase has become tangled. The same graph answers questions about packages, build steps and services, because each is a set of things that depend on each other.
When should you use a dependency graph?
- Assessing a change. Find every package or service that depends on the one you are about to modify.
- Ordering a build or deployment. The graph gives you the order: dependencies first, then the things that use them.
- Finding cycles. Circular dependencies make code hard to build, test and split, and they are easy to see on a graph.
- Planning a split. Before breaking a monolith into packages or services, draw the graph of what already depends on what.
What are the parts of a dependency graph?
- Nodes. The things that depend on each other. In the example above they are packages, but they can be source files, build targets, services or infrastructure resources.
- Directed edges. An arrow from A to B means A depends on B: it imports it, calls it or needs it built first. The direction matters, so pick one convention and keep it.
- Shared dependencies. A node with many incoming edges.
utilsin the example is imported by four packages, so a breaking change there is a change to all of them. - Transitive dependencies. Anything reachable by following arrows.
web-appnever importsutils, but it depends on it throughui-kit,api-clientandanalytics. - Cycles. A path that returns to where it started.
authandsessionimport each other, which is marked in red because it is almost always a problem. - Edge labels. Optional detail such as a version range or whether the dependency is needed only at build time.
What are the types of dependency graph?
Package dependency graph
Nodes are libraries or packages and edges come from a manifest such as package.json, go.mod or pom.xml. Package managers build this graph to resolve versions, and security tooling walks it to find vulnerable transitive dependencies.
Module or file dependency graph
Nodes are files or modules within one codebase, and edges are imports. Draw it when a project feels tangled, because it shows which modules everything depends on and where the cycles are.
Build dependency graph
Nodes are build targets and edges say which outputs are inputs to which steps. Tools like Make, Bazel and Gradle keep this graph to decide what to rebuild and what can run in parallel, and it must be acyclic.
Service dependency graph
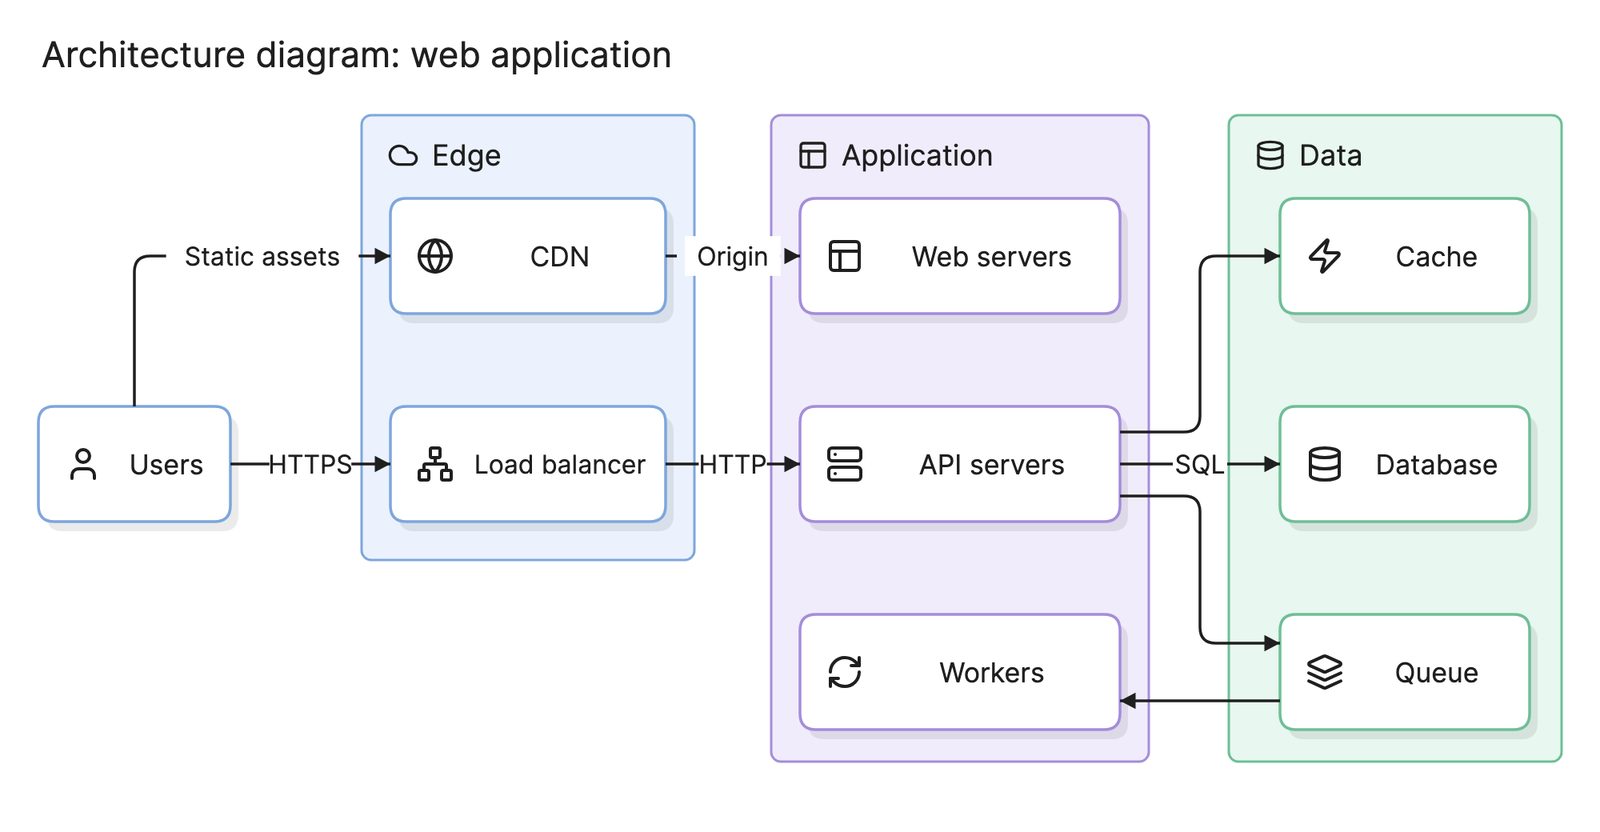
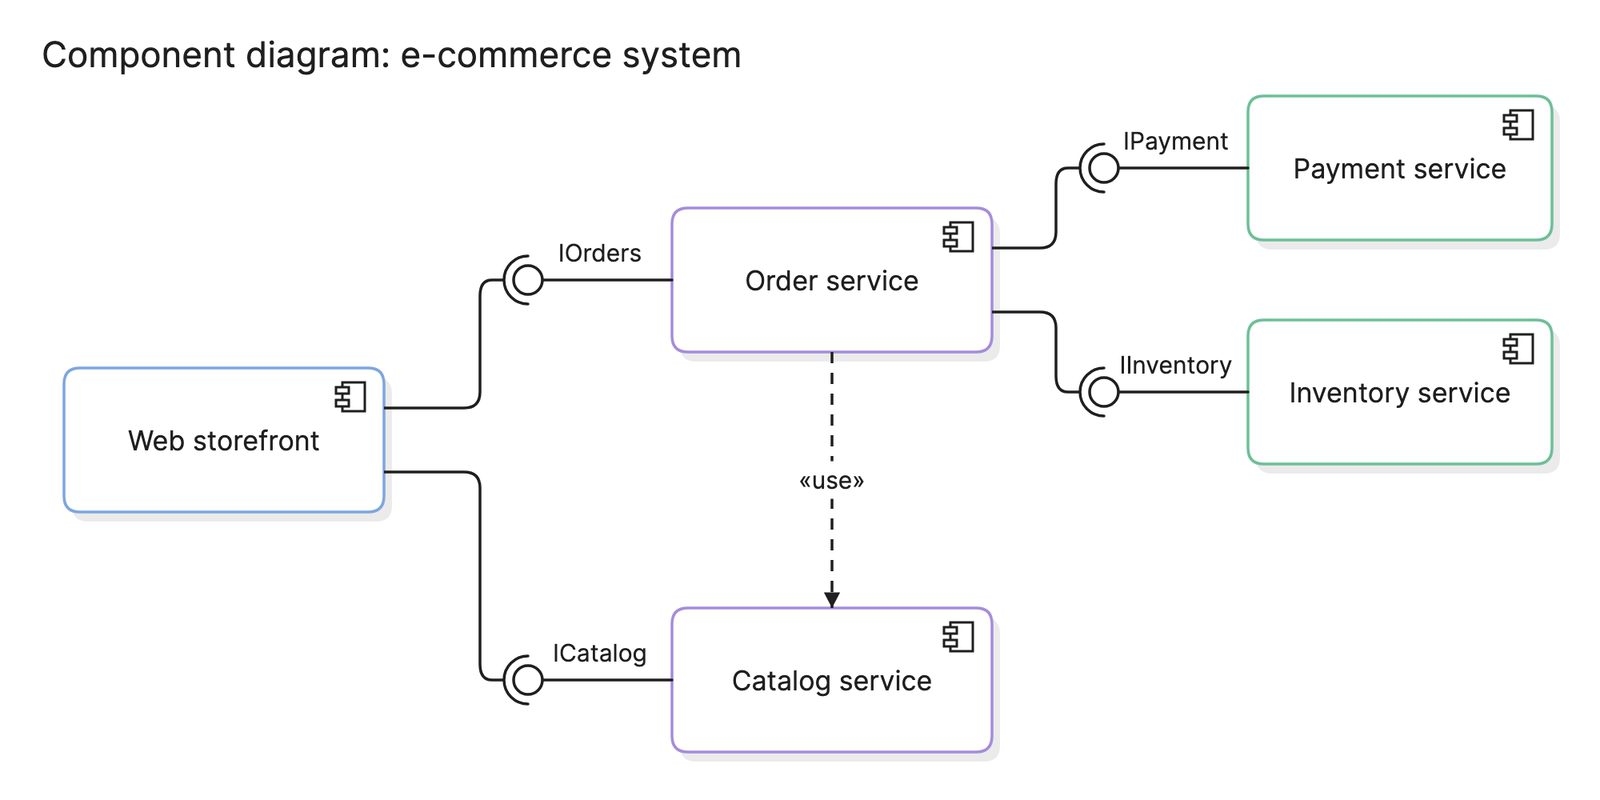
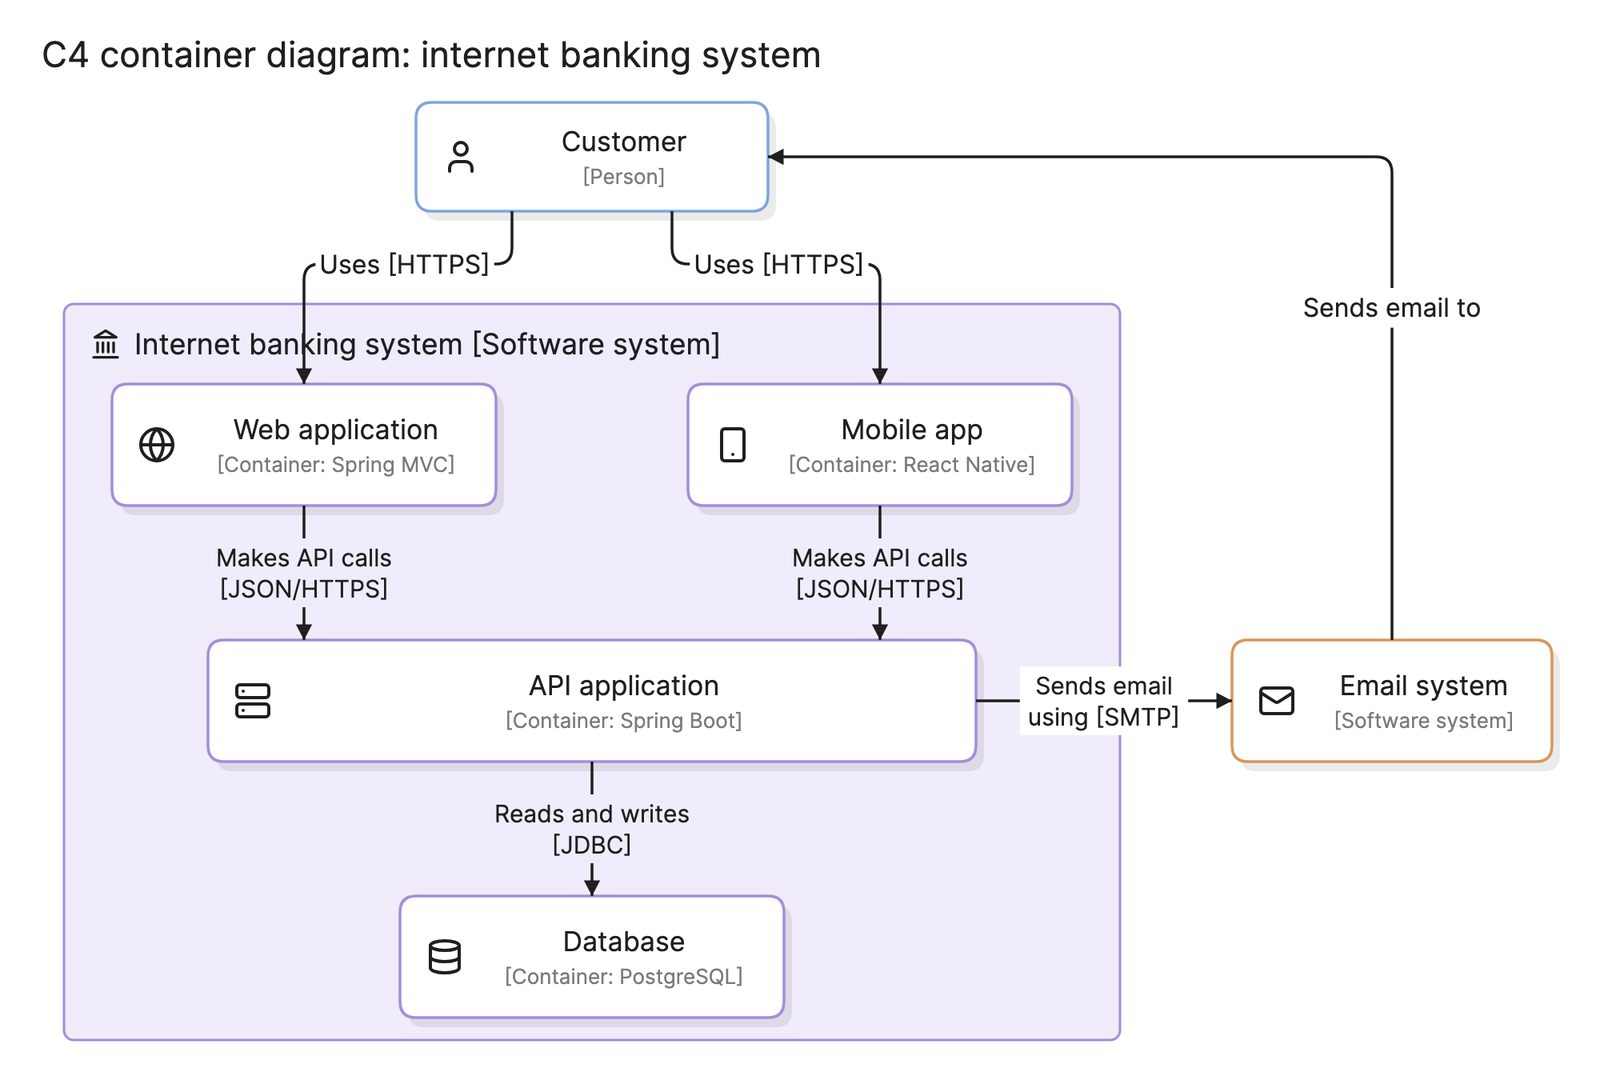
Nodes are services and edges are the calls between them. Teams draw it to understand the blast radius of an outage. It overlaps with a component diagram and the container level of the C4 model, but it shows only the depends-on relationship.
How do you read a dependency graph?
Start at the top and follow the arrows. In the example, web-app depends on three packages: ui-kit, api-client and analytics. Each of those depends on utils, and api-client also depends on auth, which depends on utils too. That makes utils the most shared node in the graph, so it is where a breaking change would do the most damage.
Now look for arrows that point backwards or sideways. auth and session point at each other, which is the cycle. Neither can be built or tested alone. The usual fix is to move whatever they share into a third package that both depend on, or to merge them.
To work out the build order, read the graph from the bottom up: utils and icons first, since they depend on nothing, then auth and session once the cycle is broken, then the three middle packages, then web-app.
How do you create a dependency graph?
- Pick the level. Packages, modules, build targets or services. Mixing levels makes the graph unreadable.
- Generate the raw graph if you can. A generated graph does not miss edges.
- Cut it down. Keep the part that answers your question, such as everything within two hops of the package you are changing.
- Fix the direction. Make every arrow point from the thing that depends to the thing it depends on, and say so in a legend.
- Lay it out in layers. Put nodes with no dependencies at the bottom and the application at the top, so every arrow points down and any cycle stands out.
- Mark what matters. Highlight shared dependencies, cycles and anything external or deprecated.
What are common dependency graph mistakes?
- Drawing everything. A full package graph for a real project has hundreds of nodes. Filter it first.
- Inconsistent arrow direction. If some arrows mean “depends on” and others mean “is used by”, nobody can read the graph.
- Leaving out transitive dependencies. The library you never import directly is still the one that breaks your build.
- Hand-drawing what a tool knows. A graph drawn from memory misses edges. Generate it, then redraw the part you need.
- Treating it as finished. Dependencies change with every pull request, so regenerate the graph when you need it.
How does a dependency graph compare with other diagrams?
| Diagram | What it shows | Use it to answer |
|---|---|---|
| Dependency graph | Which things depend on which | What breaks if this changes, and what builds first? |
| Architecture diagram | How a system is organized, including data flow and boundaries | How does this system work? |
| Component diagram | Components and the interfaces they expose and require | How is the code structured? |
| Deployment diagram | Where software runs | What is deployed where? |
What tools can you use to make a dependency graph?
Most teams combine a generator with something that draws the result.
- Package managers and build tools. Most can print the graph for a project, and some export it in a format a drawing tool can read. They are accurate but produce graphs that are too large to read without filtering.
- Graph layout tools. Tools that take a text list of edges and lay out the nodes automatically are the standard way to draw a generated graph.
- AI diagramming tools. Tools like Eraser turn a package list or a written description into a dependency graph you can edit, or let you write one as diagram-as-code so it can live next to the manifest it describes.
For more on this kind of diagram, see dependency diagrams.
Frequently asked questions
-
What is a circular dependency?
A circular dependency is a cycle in the graph: A depends on B, and B depends on A, directly or through other nodes. Neither can be built, loaded or tested without the other, and a change to one tends to break both.
-
What is a transitive dependency?
A transitive dependency is one you reach through another. If web-app depends on api-client, and api-client depends on utils, then utils is a transitive dependency of web-app. A breaking change in utils affects web-app even though web-app never imports it.
-
What is the difference between a dependency graph and an architecture diagram?
A dependency graph shows one relationship, depends on, for every node, and it is usually generated from code or configuration. An architecture diagram is drawn by hand to explain how a system is organized, and it can show data flow, deployment and boundaries that a dependency graph leaves out.
-
Can you generate a dependency graph automatically?
Yes. Package managers, build tools and most language toolchains can print the graph for a project, and there are tools that draw it. Generated graphs are accurate but often too large to read, so teams filter them to one package or one layer, or redraw the part that matters by hand.