Diagram types
User journey map
A user journey map is a grid that shows what a user does, uses, feels and struggles with at each stage of reaching a goal, inside and outside your product.
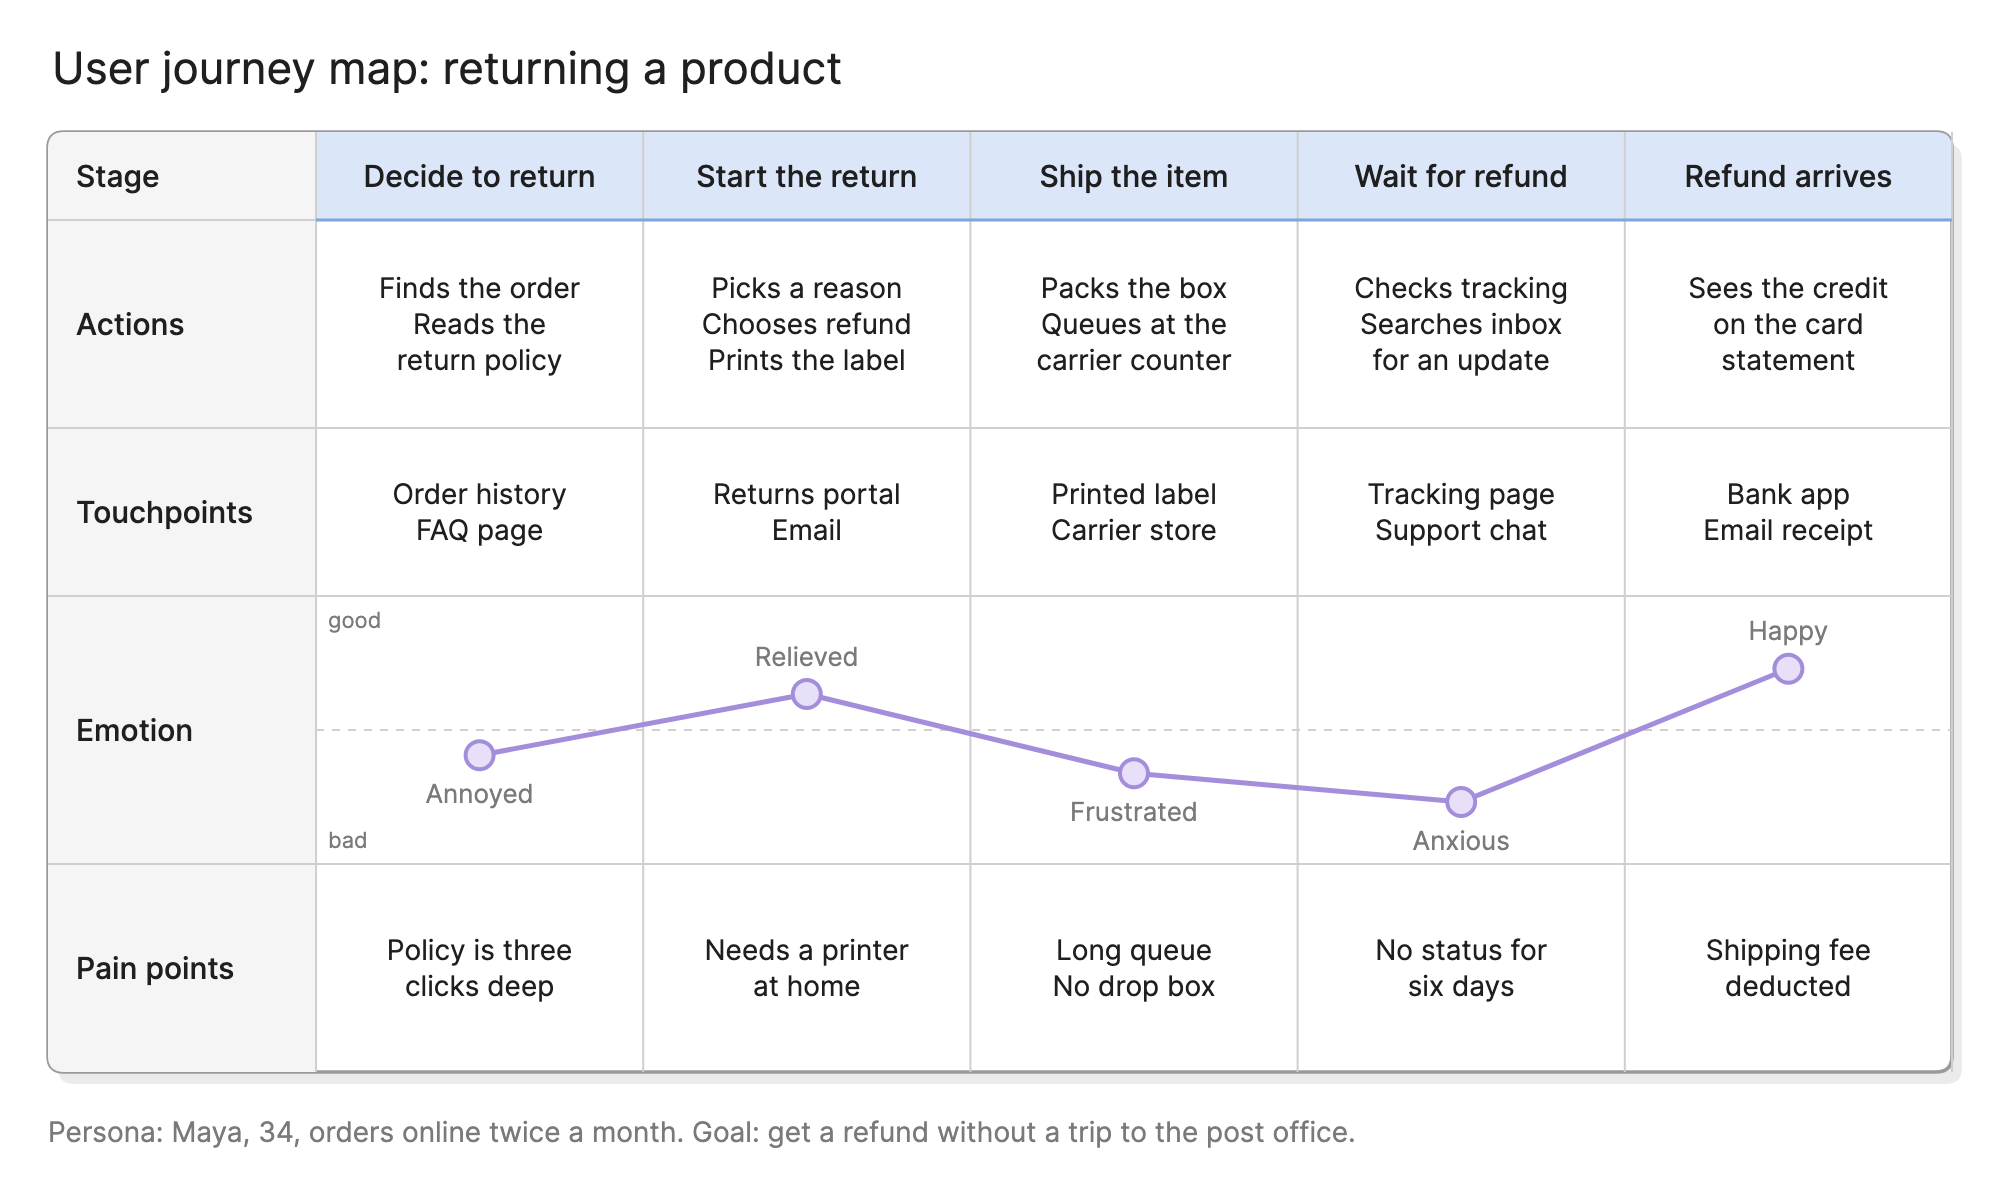
Teams draw journey maps to see a product the way one user experiences it, from the moment they have a goal to the moment they reach it or give up. Laying the stages out side by side makes it clear where the experience is fine, where it hurts and which team owns each part.
When should you use a user journey map?
- Finding the biggest problem. When a product has many complaints, a map shows which stage they cluster in.
- Aligning teams. Support, product, design and engineering each see part of the journey. The map puts it on one page.
- Scoping a redesign. Decide which stages to change before anyone draws screens or wireframes.
- Prioritizing a roadmap. A stage where emotion dips and pain points stack up is a stronger case for work than a feature request.
What are the parts of a user journey map?
A journey map is a grid. The columns are stages and the rows are lenses on each stage.
- Persona and goal. Who the map is about and what they are trying to achieve. One map covers one persona and one goal.
- Stages. The phases of the journey, across the top. They are written from the user’s point of view, such as “Decide to return”, not from the business’s, such as “Return initiated”.
- Actions. What the user does in each stage, in short phrases.
- Touchpoints. The channels, pages, people and tools the user interacts with, including ones you do not control, like a carrier’s counter.
- Emotion. How the user feels, usually drawn as a line with a dot per stage so the lows stand out.
- Pain points. Where the user is slowed down, confused or blocked.
- Opportunities. Ideas for fixing the pain points, and which team would own each one.
You do not need every row. The example above uses actions, touchpoints, emotion and pain points, which is enough to find the problems. Add opportunities once you know what to fix.
What are the types of user journey map?
Current state
Documents the journey as it happens today, backed by research. It is the most common type and the one to start with, because it shows where to spend effort.
Future state
Shows the journey as the team wants it to be after a change. It is useful for agreeing on a target before a redesign.
Service blueprint
A journey map with extra rows below the line for the staff, systems and processes that support each stage. It is closer to a process map than the other types.
How do you read a user journey map?
Read the stages across the top first, then down one column at a time. In the product return example, the persona, Maya, decides to return an item, starts the return online, ships it, waits for the refund and finally sees the money arrive.
The emotion row is where to look next. It rises when the returns portal turns out to be easy, then falls through shipping and waiting, hitting its low when there is no status update for six days. Match each dip to the pain points row below it: a printer she does not have, a queue at the carrier and silence while she waits.
Now check the touchpoints. The low point happens on a tracking page and in a support chat, which tells the team where a fix would land. A status email when the carrier scans the parcel would address the worst stage without touching the rest.
How do you create a user journey map?
- Choose one persona and one goal. “Maya returns an item she ordered online” gives you a map. “Customers” and “returns” do not.
- Gather evidence. Interviews, support tickets, reviews, session recordings and analytics. Note which stages it does not cover.
- Define the stages. Name four to seven phases in the user’s words, from the first intent to the outcome.
- Fill in the rows. Work column by column: actions, then touchpoints, then emotion and pain points. Keep each cell to a phrase.
- Draw the emotion line. Place a dot per stage and connect them. Mark where the evidence is thin.
- Find the opportunities. For each low point, write what would fix it and who owns that part of the product.
- Review it with support and operations staff. They will correct what the product team assumed.
What are common user journey map mistakes?
- Mapping the business process instead of the user’s experience. If the stages are named after your internal steps, the map is a process map, not a journey map.
- Covering too many personas. Different users take different paths. Make one map per persona and compare them.
- Making up the emotion row. A guessed emotion line looks authoritative and misleads everyone. Label assumptions, then replace them with research.
- Stopping at the map. A map with no owners for its opportunities tends to be forgotten.
- Too much text. Keep cells to a phrase and link to the research for detail.
How does a user journey map compare with other diagrams?
| Diagram | What it shows | Use it to answer |
|---|---|---|
| User journey map | A user’s experience over time, inside and outside the product | Where is the experience good or bad, and why? |
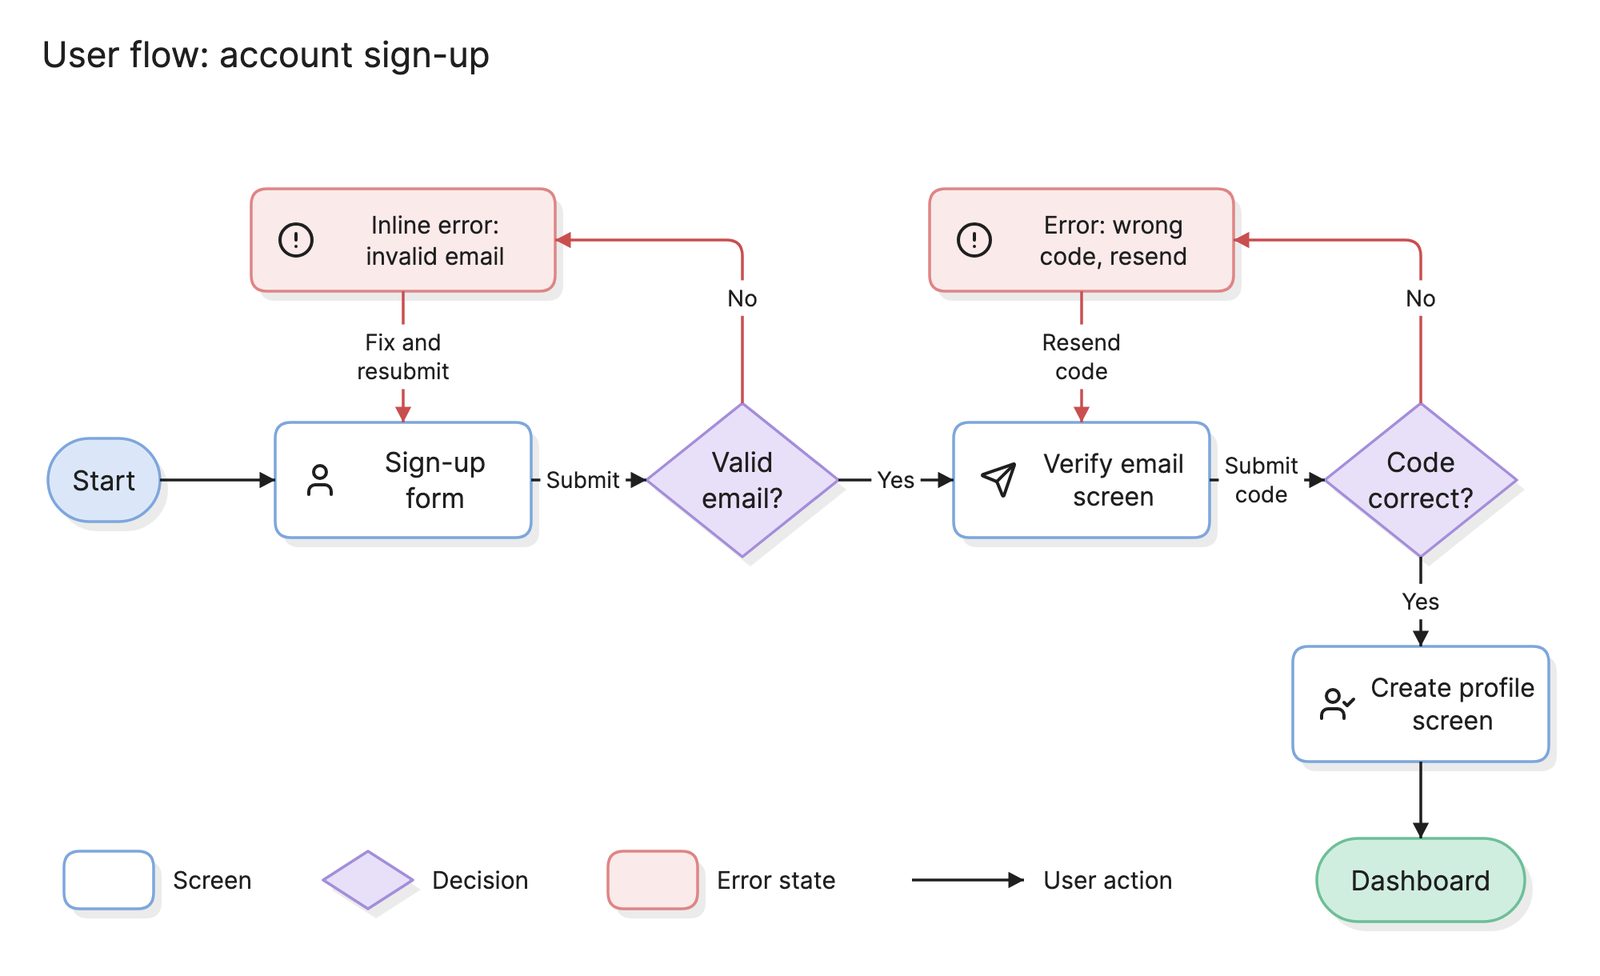
| User flow | Screens and decisions inside the product for one task | What steps does a user take to do this? |
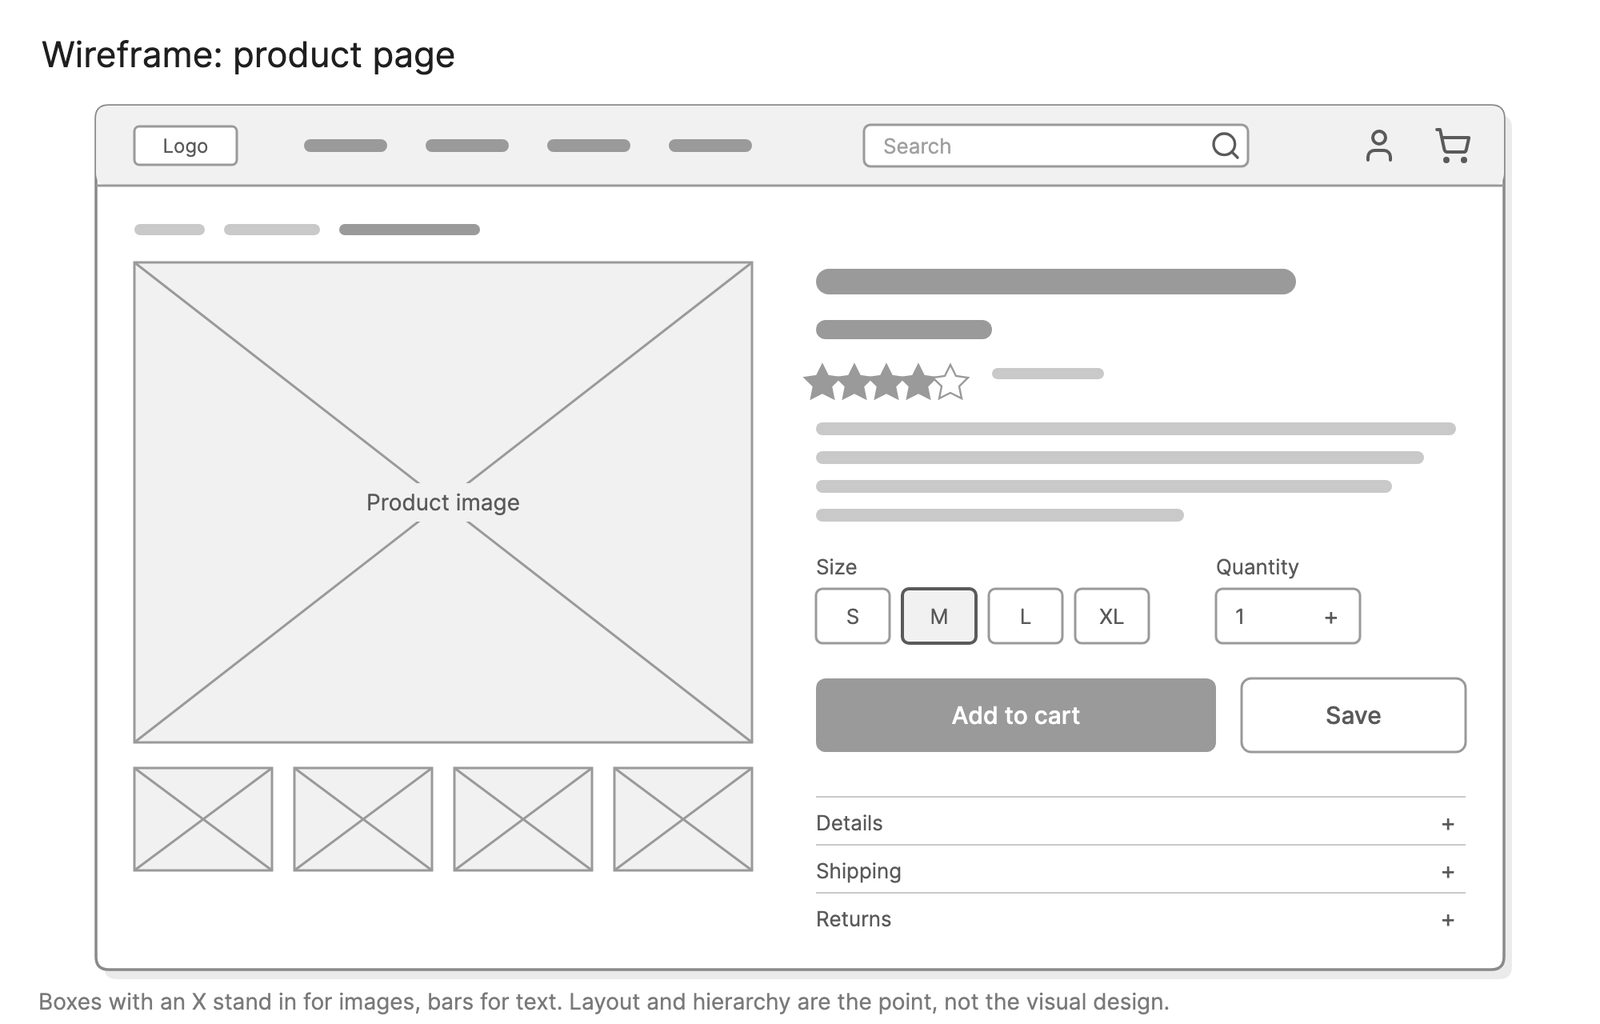
| Wireframe | The layout of one screen | What goes on this screen? |
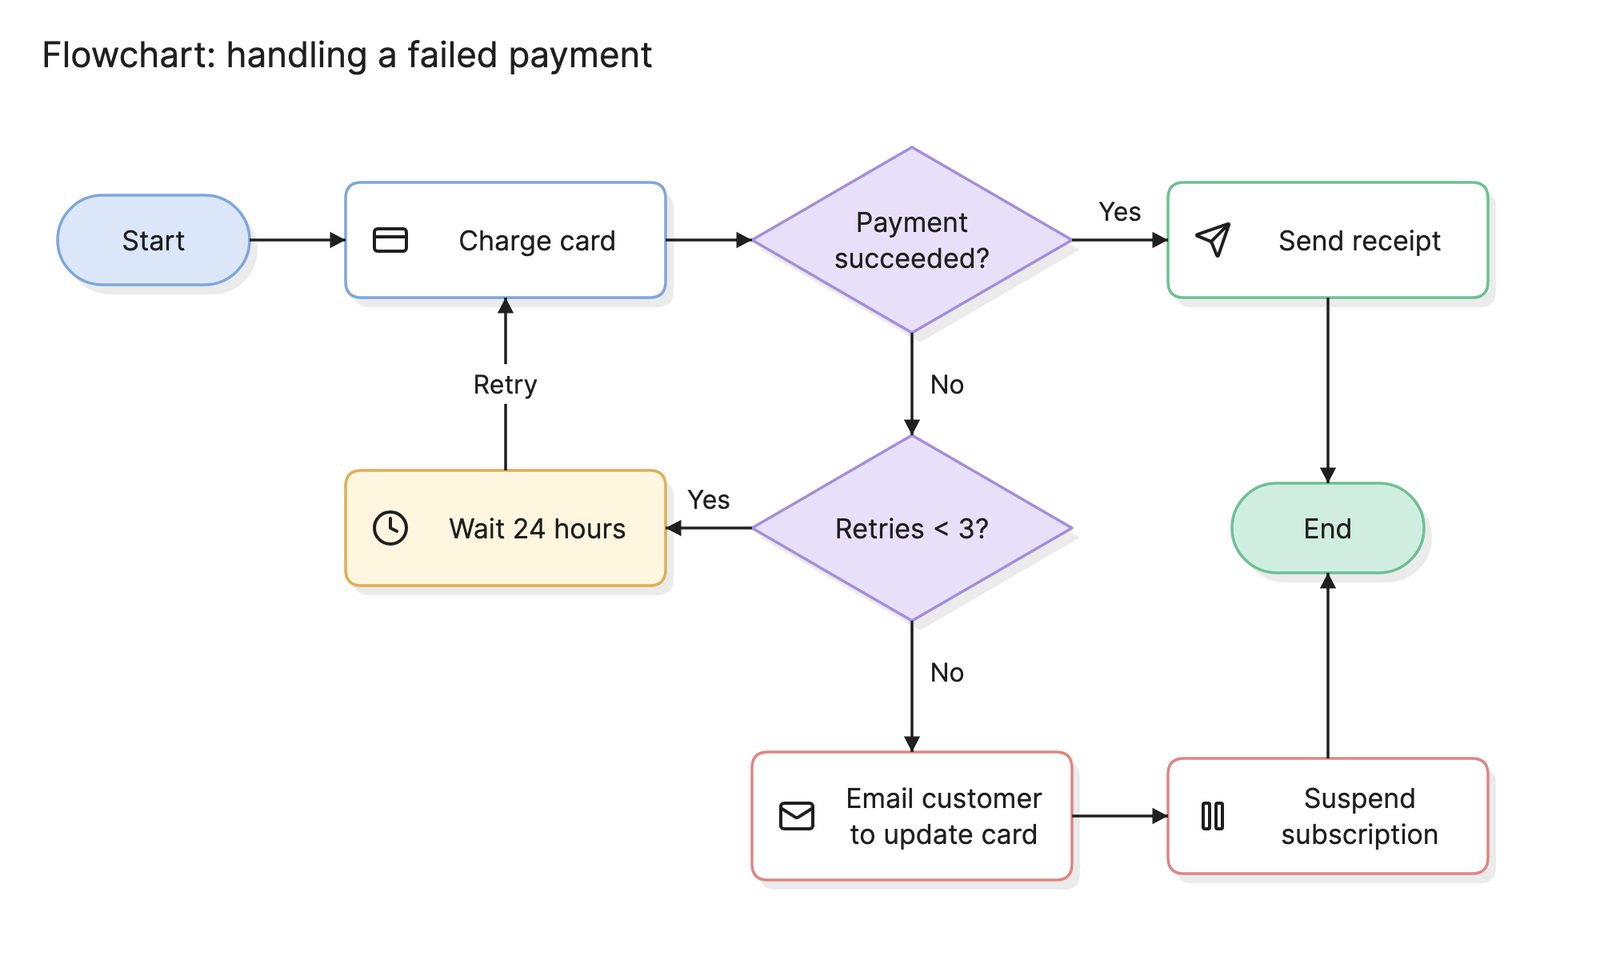
| Flowchart | The steps and decisions in any process | How does this process run? |
What tools can you use to make a user journey map?
A journey map is a grid, so almost anything can hold one. The difference is how easy it is to build from research.
- Spreadsheets. Quick to start and easy to share, but the emotion line and any visual emphasis are awkward to add.
- Whiteboard tools. Good for building a map live in a workshop, and for moving cells around as the team argues over stages.
- AI diagramming tools. Tools like Eraser turn interview notes or a written description of a journey into a first draft of a journey map that you can edit, which saves the setup work when the research already exists in text.
Frequently asked questions
-
What is the difference between a user journey map and a user flow?
A journey map covers the whole experience of reaching a goal, including the parts that happen outside your product, and it records how the user feels. A user flow zooms in on the screens and decisions inside the product for one task.
-
What is the difference between a user journey map and a customer journey map?
They are largely the same tool. Customer journey map is the term marketing and service teams tend to use, and it often starts before someone is a user, at awareness and purchase. User journey map is more common in product and UX teams and tends to focus on using the product.
-
How many stages should a journey map have?
Usually four to seven. Fewer than four and the map is too coarse to show where things go wrong. More than seven and it becomes hard to read on one page. For the steps inside a stage, draw a separate user flow.
-
Do you need research to make a journey map?
An assumption map drawn from what the team already knows is a fine starting point, as long as you label it that way. But the value of the rows for emotion and pain points depends on real evidence from interviews, support tickets, session recordings or analytics. Plan to replace the assumptions with findings.