Guide
How to draw a high availability architecture diagram from AWS
Scan an AWS account, ask for the diagram grouped by region and availability zone, and check what survives the loss of a zone or a region.
A high availability design promises that the service keeps answering when an availability zone is lost. The diagram that shows it usually dates from the design review. Since then a cache went in with one node and the second zone never got its NAT gateway. Nobody redrew anything.
This guide draws the high availability architecture diagram from the AWS account as it runs today. You connect the account to Eraser, scan it, and ask for the diagram grouped by region and availability zone. Then you check what is left when a zone, or a region, is lost. It takes about fifteen minutes.
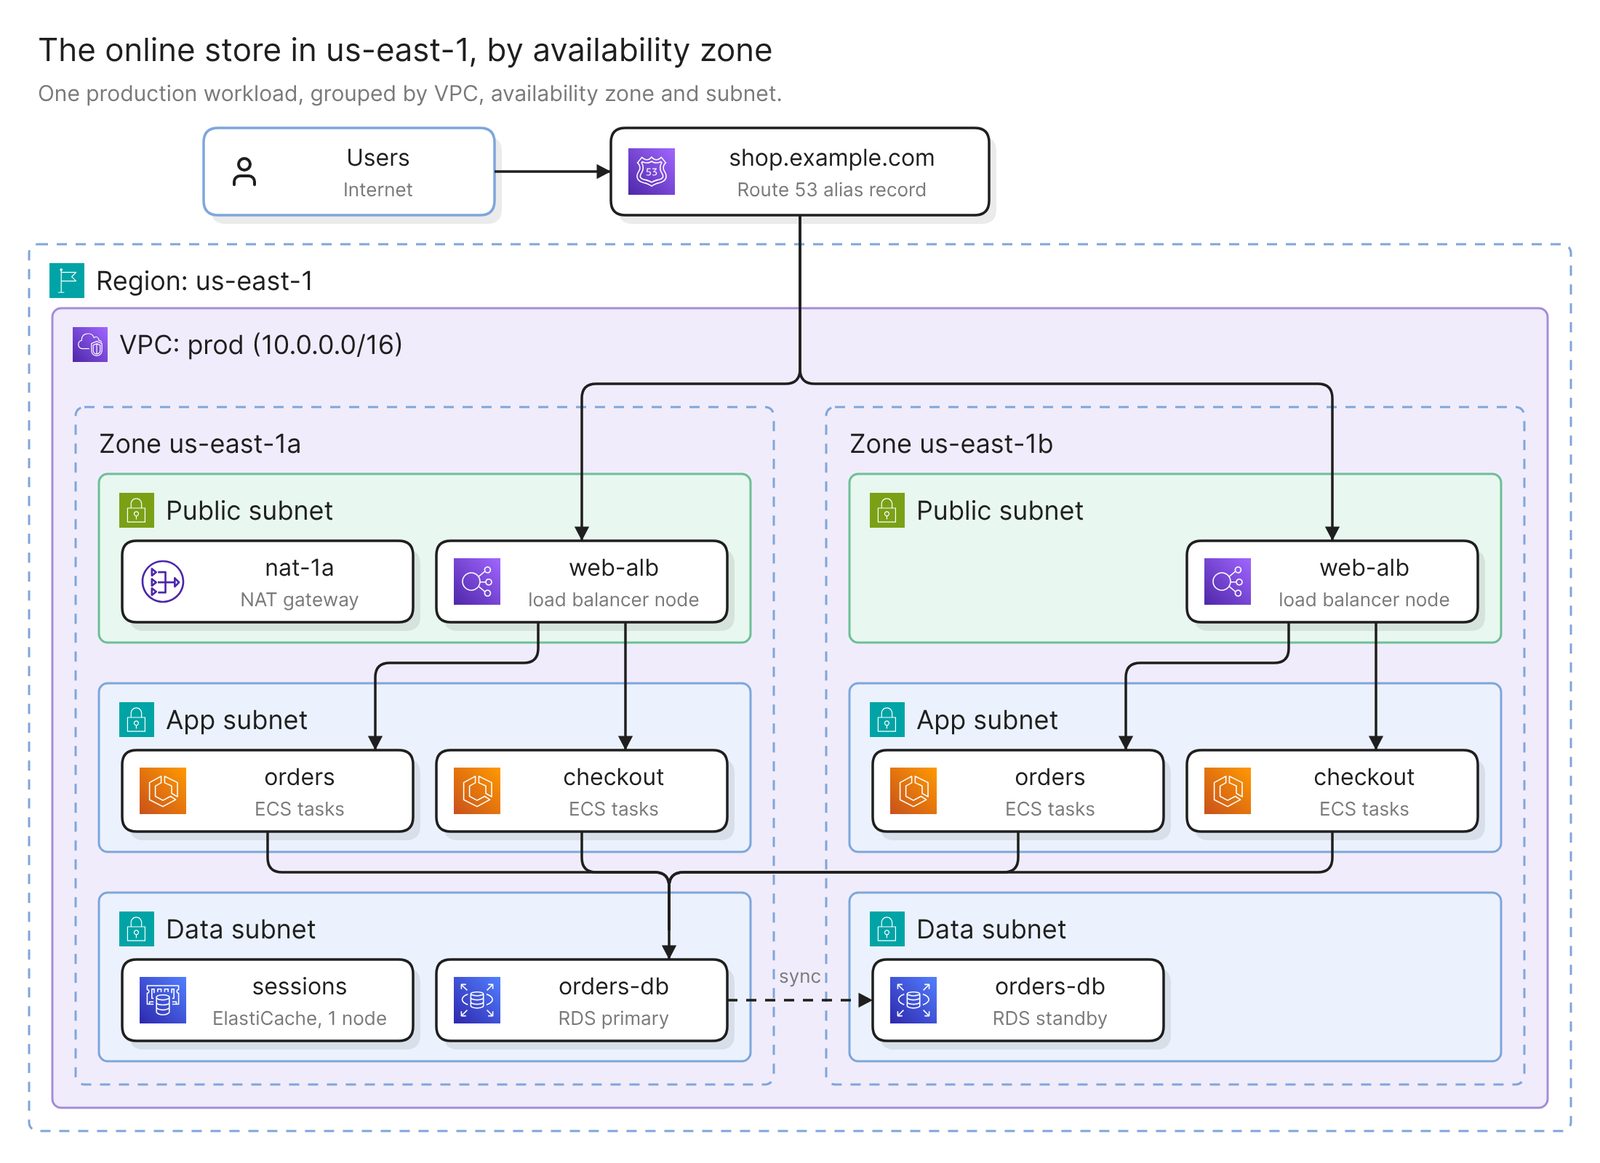 Example: an online store in one region, grouped by availability zone
Before you start
You need two things:
- Access to Eraser
- Access to the AWS account, with permission to create a read-only role
The scan reads configuration, including the region, subnets and zones of each resource. It sees no traffic, so it cannot show that a failover works, and some availability settings may not be in it. Step 3 covers both.
Step 1. Connect the account and scan it
Eraser gives you a CloudFormation template that creates one read-only role in the account. You choose which accounts to include, and the first scan runs. It builds a model, an inventory of what the account holds, with each record’s fields and connections.
The docs have the click-by-click steps, and the AWS architecture diagram guide covers this route in full. That guide draws what is deployed. This page asks one question of the same scan.
Step 2. Ask for the diagram by region and zone
Open AI chat, attach the account’s model, and ask for the grouping that AWS fails by:
Draw the online store in us-east-1 as a high availability architecture
diagram. Group by VPC, then availability zone, then subnet, with the
zones side by side. Put Route 53 and anything else that is not in a zone
outside the VPC. Draw each load balancer once per zone it has a subnet in.
Regions and zones are the units of failure on AWS. Its EC2 documentation calls Availability Zones “multiple, isolated locations within each Region”.
A scan can place resources by zone because each “subnet must reside entirely within one Availability Zone and cannot span zones”, so a resource’s subnets say which zones it is in.
Name the region and the workload, because a model covers everything its connection imports.
Step 3. Add what the scan does not hold, then check it
The scan holds placement. Subnets carry their zone, and load balancers and Auto Scaling groups carry the subnets and zones they are placed in. An RDS instance carries its Multi-AZ setting and the zones of its subnet group.
Do not count on the rest being in the model: which of those zones a database’s primary and standby are in, replication to another region, a Route 53 record’s routing policy and health check, or whether a NAT gateway is zonal or regional. Open the model and read the record’s fields. Look up what is missing in the AWS console and add it by prompt:
orders-db is a Multi-AZ instance. Draw its primary in us-east-1a and its
standby in us-east-1b, joined by a dashed line labeled sync. Connect
every service to the primary only.
The RDS console shows the standby’s zone as the secondary AZ.
Then check five things. The example fails two.
- Each tier spans at least two zones. Find the load balancer, the services and the data tier in more than one zone. The example’s
sessionscache has one node, so it is in one zone. Read task counts too, because a service with two subnets and one task runs in one zone at a time. - The data tier has a standby, and you know where it is. In a Multi-AZ DB instance deployment, RDS keeps “a synchronous standby replica in a different Availability Zone”. The standby “doesn’t serve read traffic”, so every arrow should end on the primary.
- The load balancer covers the zones its targets run in. “If you register targets in an Availability Zone but do not enable the Availability Zone, these registered targets do not receive traffic.”
- Zonal resources are not shared by accident. If zones share one zonal NAT gateway and its zone is down, “resources in the other Availability Zones lose internet access”. The example has only
nat-1a. AWS’s answer is a NAT gateway in each zone, or a regional NAT gateway, which expands across zones on its own. - The layer that fails over is on the diagram. Something has to move the traffic, such as a load balancer between zones or a Route 53 record between regions. If it is missing, ask for it by name.
A diagram shows placement. It cannot show that failover has been tested, or the recovery time and recovery point. Only a test measures those, and AWS’s reliability guidance is to regularly “test failover to your recovery site to verify that it operates properly and that RTO and RPO are met”.
Ask a narrower question
Each of these prompts asks for a different diagram of the same scan.
Single points of failure
Show everything in the prod VPC that runs in only one availability zone,
and what depends on each. Color those red. Draw whatever spans two or
more zones in gray, without its subnets.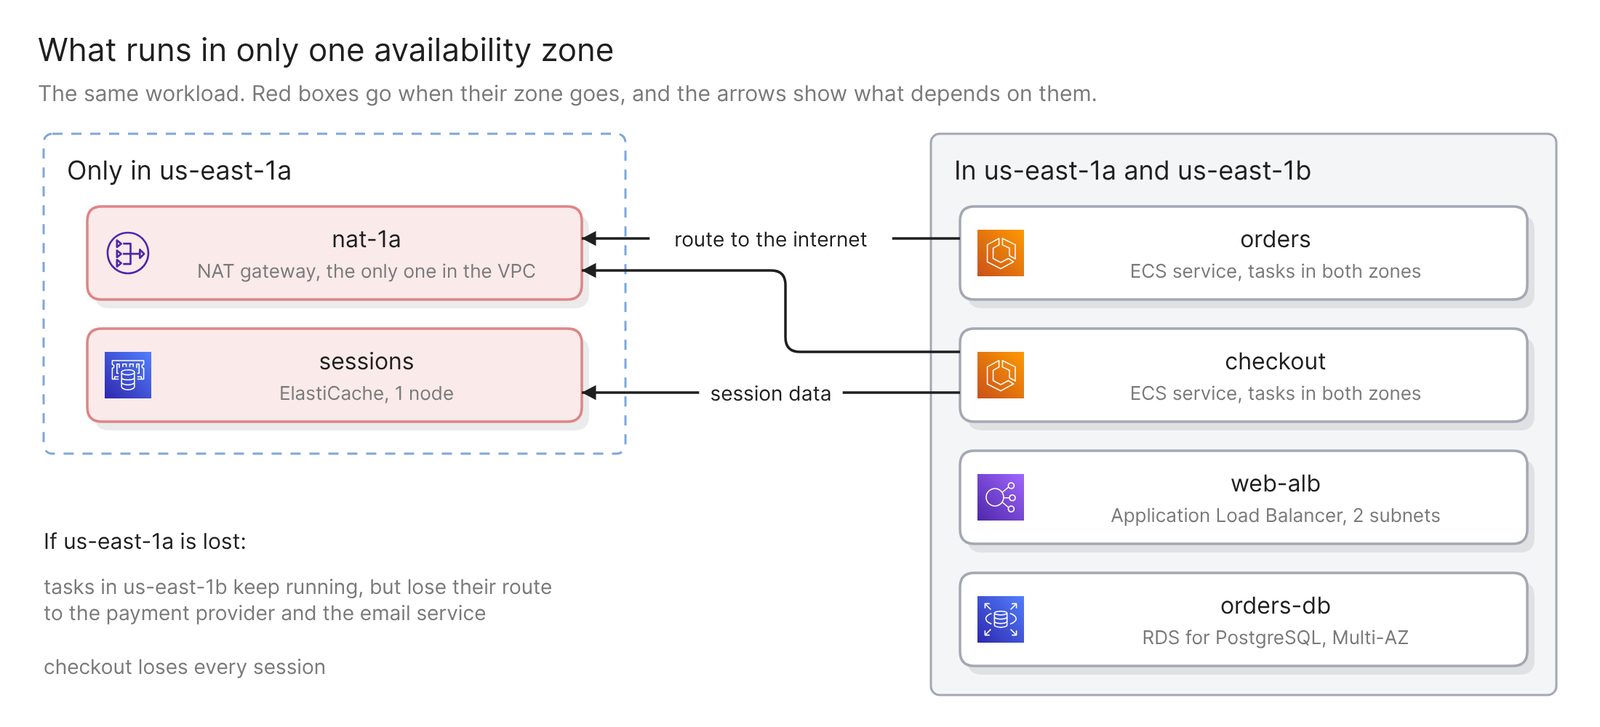 Example: what runs in one zone only, and what depends on it
A NAT gateway per zone shows up here too, which is correct. For each red box, ask what else stops when its zone does.
Two regions, active-passive or active-active
Draw us-east-1 and us-west-2 side by side with the same tiers in each:
load balancer, services, data store. Put the Route 53 record for
shop.example.com above both and label each path primary, secondary or
active. Draw replication between the data stores with its direction.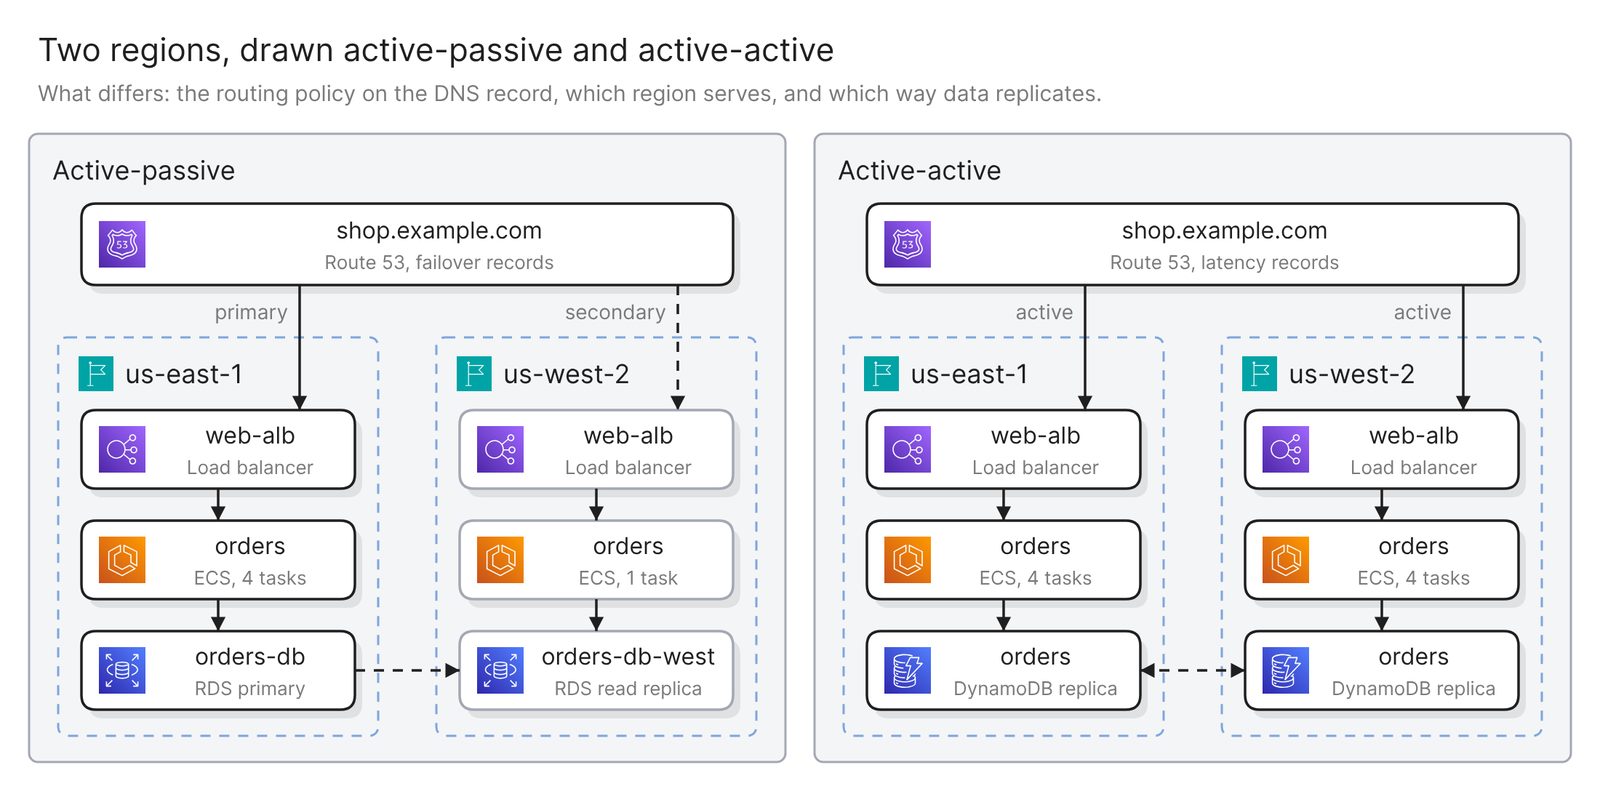 Example: the same two regions drawn active-passive and active-active
Route 53 shows which one you have. AWS’s rule is that you “configure active-active failover using any routing policy (or combination of routing policies) other than failover, and you configure active-passive failover using the failover routing policy”. Read the policy in the Route 53 console and name it in the prompt. For active-active, also show which regions accept writes. A DynamoDB global table accepts them in every region it is deployed to.
A disaster recovery view
Draw a disaster recovery view. us-east-1 is the primary region and
us-west-2 is the recovery region. Pair each resource in the primary with
its copy in the recovery region, draw what replicates between them, and
color red anything in the primary that has no copy.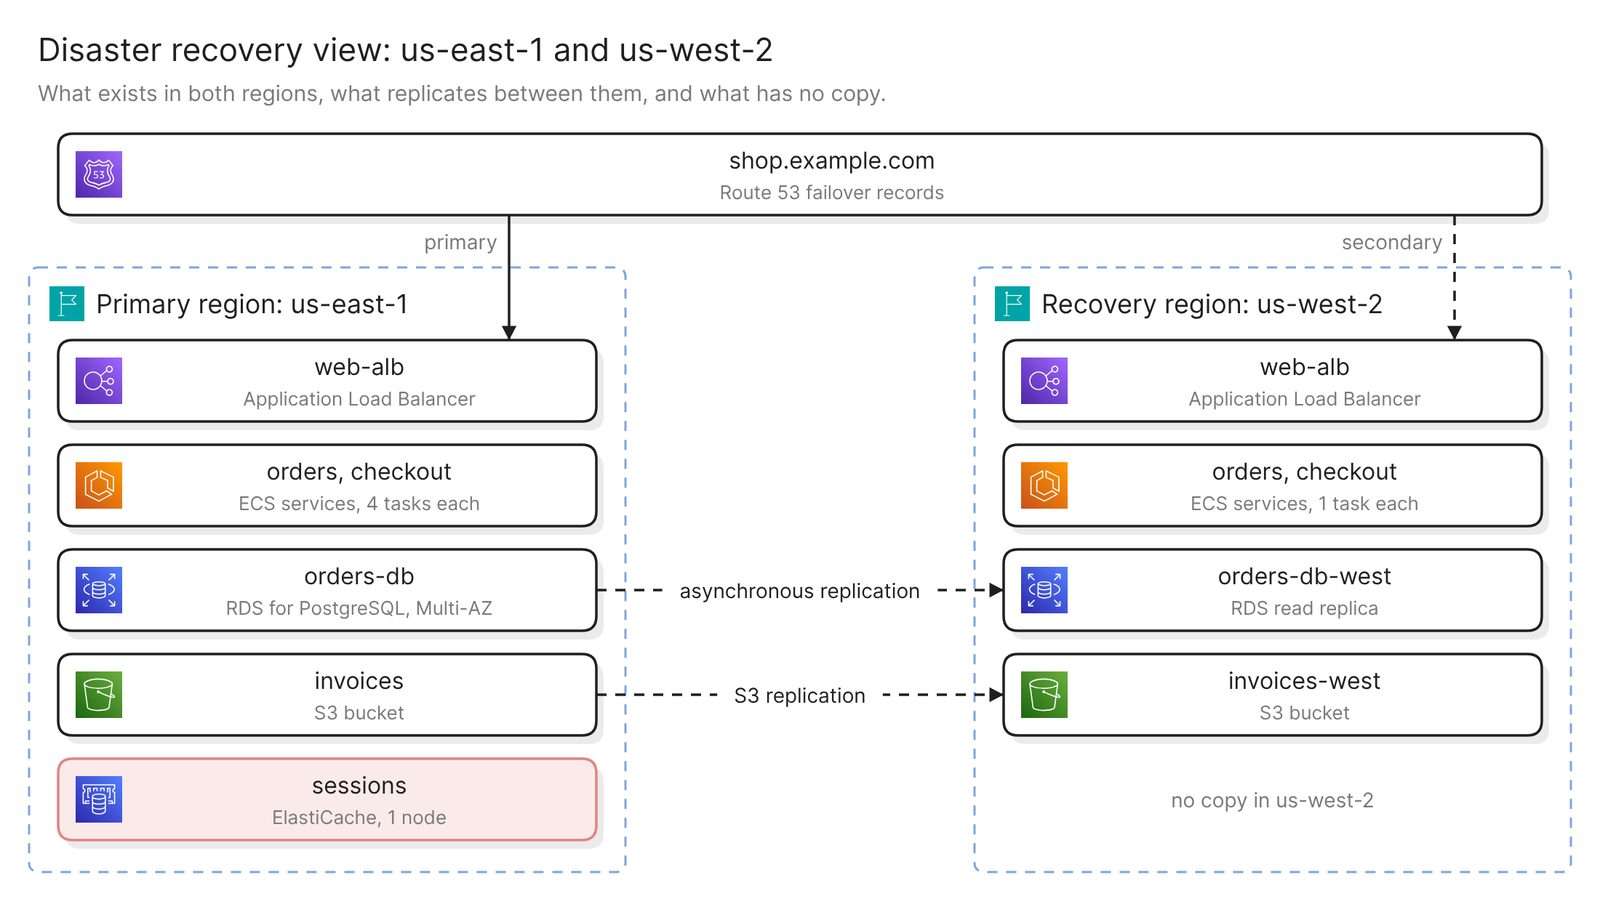 Example: a primary and a recovery region, and what replicates between them
AWS says “we don’t automatically replicate resources across Regions”, so each line between the regions is a setting someone made, such as an RDS read replica in another region or S3 replication. It may not be in the model. Expect pairing by name, and treat a red box as a question for its owner. The glossary covers what a disaster recovery plan needs beyond the diagram.
One workload’s failure domains
Diagram the checkout workload by failure domain. Use three groups: what
is tied to one zone, what spans the region, and what is global. Put
every resource checkout depends on into one of them.
AWS sorts its services the same way in its fault isolation boundaries whitepaper: zonal services such as EC2 and EBS, regional services such as S3, and a few global ones, Route 53 among them.
Keep it current
The diagram reflects the last scan, and nothing scans on a schedule. Rescan after a change to the network or the data tier, then regenerate.
Verify checks an existing diagram against the model and lists every issue without changing it. It can also check against a standard you name, such as AWS Well-Architected. What you added by prompt and the model does not hold, such as the standby’s zone or the routing policy, still needs a check by hand.
Share the diagram with a link, embed it in your team’s wiki, or export it. Keep the date of the last failover test beside it.
Other ways to draw a high availability architecture diagram
- Use AWS Resilience Hub. As of November 2026, the next generation of Resilience Hub discovers a service’s resources from CloudFormation stacks, Terraform state files, resource tags or EKS clusters. It assesses them against a resilience policy, runs tests such as an Availability Zone impairment, and shows a service topology in its console. It is the better choice when you need findings and test results. The topology groups resources by service function, where this page groups by zone.
- Run a Well-Architected review. AWS describes the Well-Architected Tool as a manual, “guided self-review of your workloads against the AWS Well-Architected Framework”. Its output is a list of risks and an improvement plan. It is the right choice when the reliability questions need answers on the record. It is a questionnaire, and you bring the diagram to it.
- Draw it by hand from AWS’s reference architectures. AWS’s disaster recovery whitepaper has an architecture figure for each of its four strategies, from backup and restore to multi-site active/active. AWS also publishes reference architecture diagrams and its architecture icons. This suits a design that is not built yet. Nothing checks the drawing against the account.
- Use another tool that reads a live account. Best cloud diagram tools in 2026 compares them.
FAQ
Does the scan know whether a database is Multi-AZ?
Look in the model, where an RDS instance record has a Multi-AZ field. Do not count on it naming the standby’s zone, which the RDS console shows as the secondary AZ.
Can one diagram cover two regions or several accounts?
Yes. Name the regions in the prompt, and attach up to five models to one request. Across accounts, compare zones by AZ ID. For accounts created before November 2025, AWS warns that us-east-1a in one account “might not be the same physical location” as it is in another.
How do I tell active-active from active-passive on a diagram?
Count the regions that take user traffic. One serves in active-passive, and both serve in active-active.
Can a diagram prove that failover works?
No. It shows that a standby exists and where. Only a test shows that traffic moves and how long it takes. AWS Fault Injection Service has an AZ Availability: Power Interruption scenario for that.
Where to go next
To start from a description instead of an account, the AWS diagram generator draws one from plain English. For reference diagrams, see a network diagram for disaster recovery, Kubernetes on AWS and the Landing Zone Accelerator.
The glossary covers cloud computing architecture and multi-cloud. If the recovery site is a data center, the hybrid cloud guide draws both sides.