Diagram types
Block diagram
A block diagram is a high-level drawing of a system in which each major part is a labeled block and the lines between blocks show the signals that connect them.
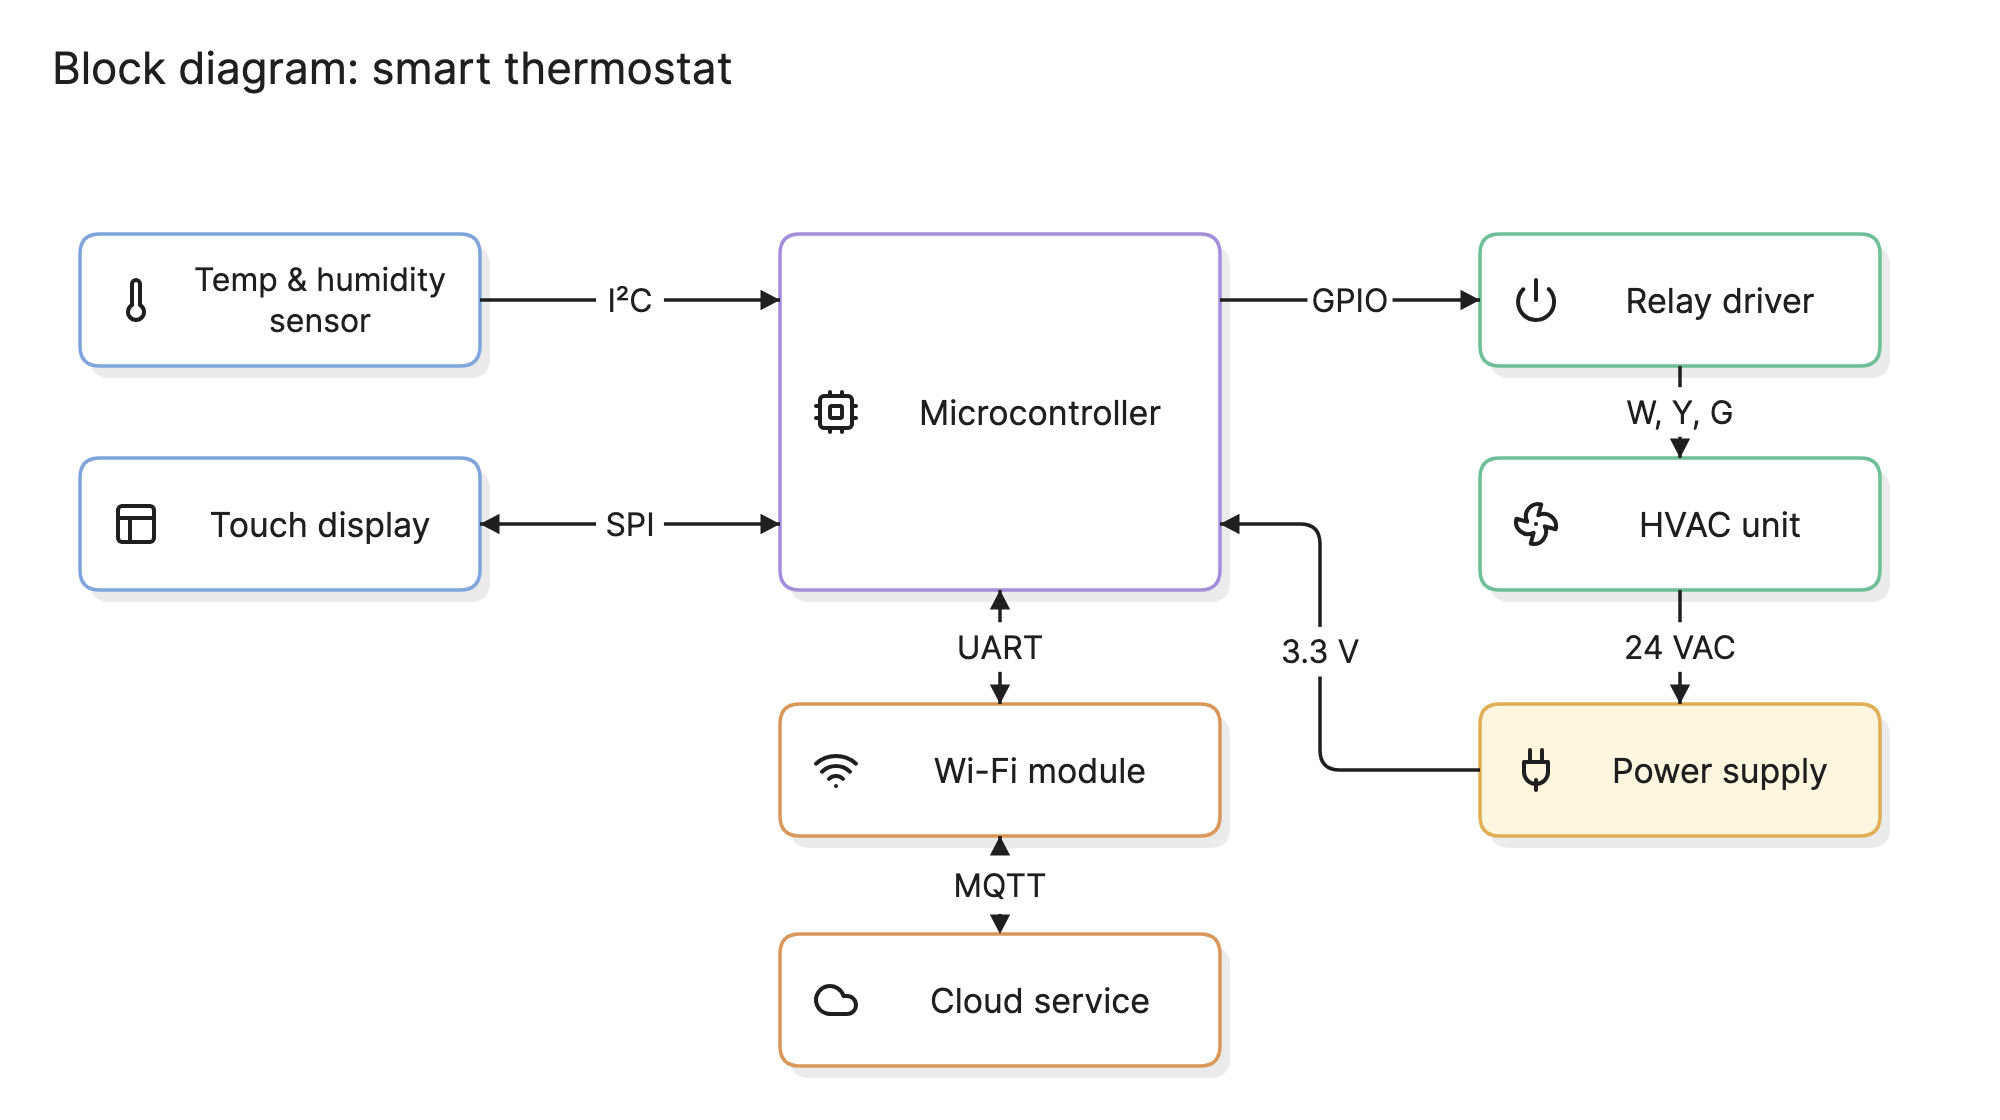
Engineers use block diagrams to agree on what a system is made of before anyone designs the pieces. Because a block hides everything inside it, the diagram stays readable whether the system is a thermostat, a radio receiver or a cloud platform.
When should you use a block diagram?
- Starting a design. Sketch the major parts and the signals between them before committing to components, protocols or vendors.
- Explaining a product. Show a customer, a manager or a new engineer how the system works without the detail of a schematic.
- Splitting the work. Each block can become a team’s or a supplier’s responsibility, with the arrows as the interfaces they have to agree on.
- Troubleshooting. Trace a signal from block to block to narrow down where a fault must be.
What are the parts of a block diagram?
- Blocks. Rectangles that stand for a functional part of the system: a sensor, a controller, a power supply, a service. Each block is labeled with what it is or does, not with how it is built.
- Signal lines. Arrows that show something passing from one block to another: an electrical signal, a data message, a force, a fluid. The arrowhead shows the direction. A line with heads at both ends is a two-way link.
- Labels on lines. The name of the signal or bus, such as I²C, 24 VAC or MQTT. These labels are what make a block diagram useful to an engineer rather than just a picture.
- Inputs and outputs. Signals that enter from or leave to the outside world, often drawn as arrows with no block at one end.
Color is optional, but tinting blocks by role, as the thermostat example does, helps a reader scan the diagram.
What are the types of block diagram?
System block diagram
Shows the physical or logical parts of a whole product and how they connect. The thermostat above is this kind. Software teams draw the equivalent as an architecture diagram.
Functional block diagram
Shows functions rather than parts: acquire, filter, compute, actuate. It is used when the design has not yet decided which physical parts will perform each function.
Control block diagram
Shows a control loop with transfer functions in the blocks, summing points and feedback paths. It is a mathematical model that can be reduced algebraically to analyze the whole loop.
Signal flow or data flow
Shows how a signal or a data set is transformed as it passes through a chain of processing blocks, such as a radio front end or a data pipeline. The data flow diagram is a formalized version for software.
How do you read a block diagram?
Start at the inputs and follow the arrows. In the smart thermostat example at the top of this page, the temperature and humidity sensor sends readings to the microcontroller over I²C. The touch display has a two-way SPI link, because the controller draws the screen and the screen sends touches back.
The microcontroller’s decisions leave on the right. A GPIO signal drives the relay driver, which switches the W, Y and G control lines of the HVAC unit to call for heat, cooling or the fan. Below that, the power path runs the other way: the HVAC’s transformer supplies 24 VAC to the power supply, which regulates it to 3.3 V for the controller. The UART link to the Wi-Fi module and the dashed MQTT link to the cloud service show how the thermostat reports and takes commands from outside.
Two things stand out: the thermostat depends on the HVAC for power, and the cloud link is optional, which is why it is dashed.
How do you create a block diagram?
- Set the boundary. Decide what is inside the system and what is an external input or output.
- List the blocks. Name each major function or part. If you have more than about 15, group some into a sub-block with its own diagram.
- Draw the signals. Add an arrow for every signal, bus or data flow between blocks, in the direction it travels.
- Label everything. Name each block and each signal, including units, protocols or voltages where they matter.
- Arrange for flow. Put inputs on the left, outputs on the right and feedback or power paths below, so a reader follows it without effort.
- Review with the people building each block. The arrows are the interfaces they will have to agree on, so check that every one is real.
What are common block diagram mistakes?
- Unlabeled arrows. A line between two blocks that does not say what it carries is a guess, not a design.
- Mixing levels of detail. A block for “power supply” next to one for “0.1 µF capacitor” means the diagram has stopped being a block diagram.
- Missing the power path. Power is a signal too, and forgetting it hides the dependency the thermostat example makes visible.
- No boundary. If a reader cannot tell what is part of the system and what is outside it, add a frame or mark the external blocks.
How does a block diagram compare with other diagrams?
| Diagram | What it shows | Use it to answer |
|---|---|---|
| Block diagram | The major parts of a system and the signals between them | What is this made of, and how do the parts connect? |
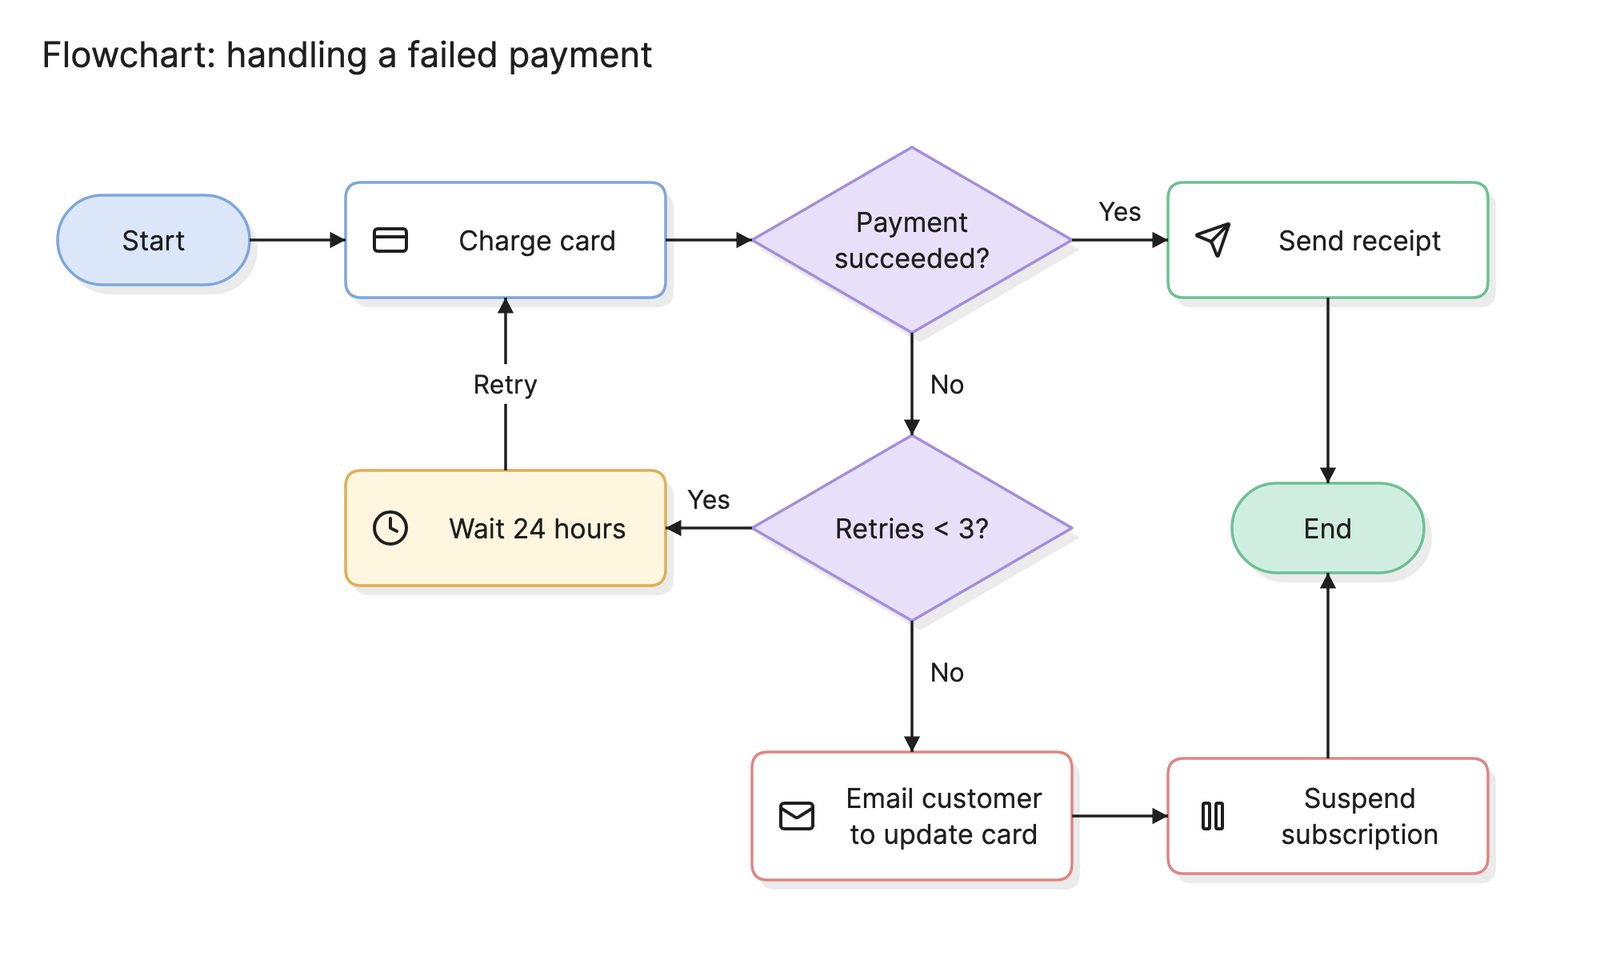
| Flowchart | Steps and decisions in order | What happens next? |
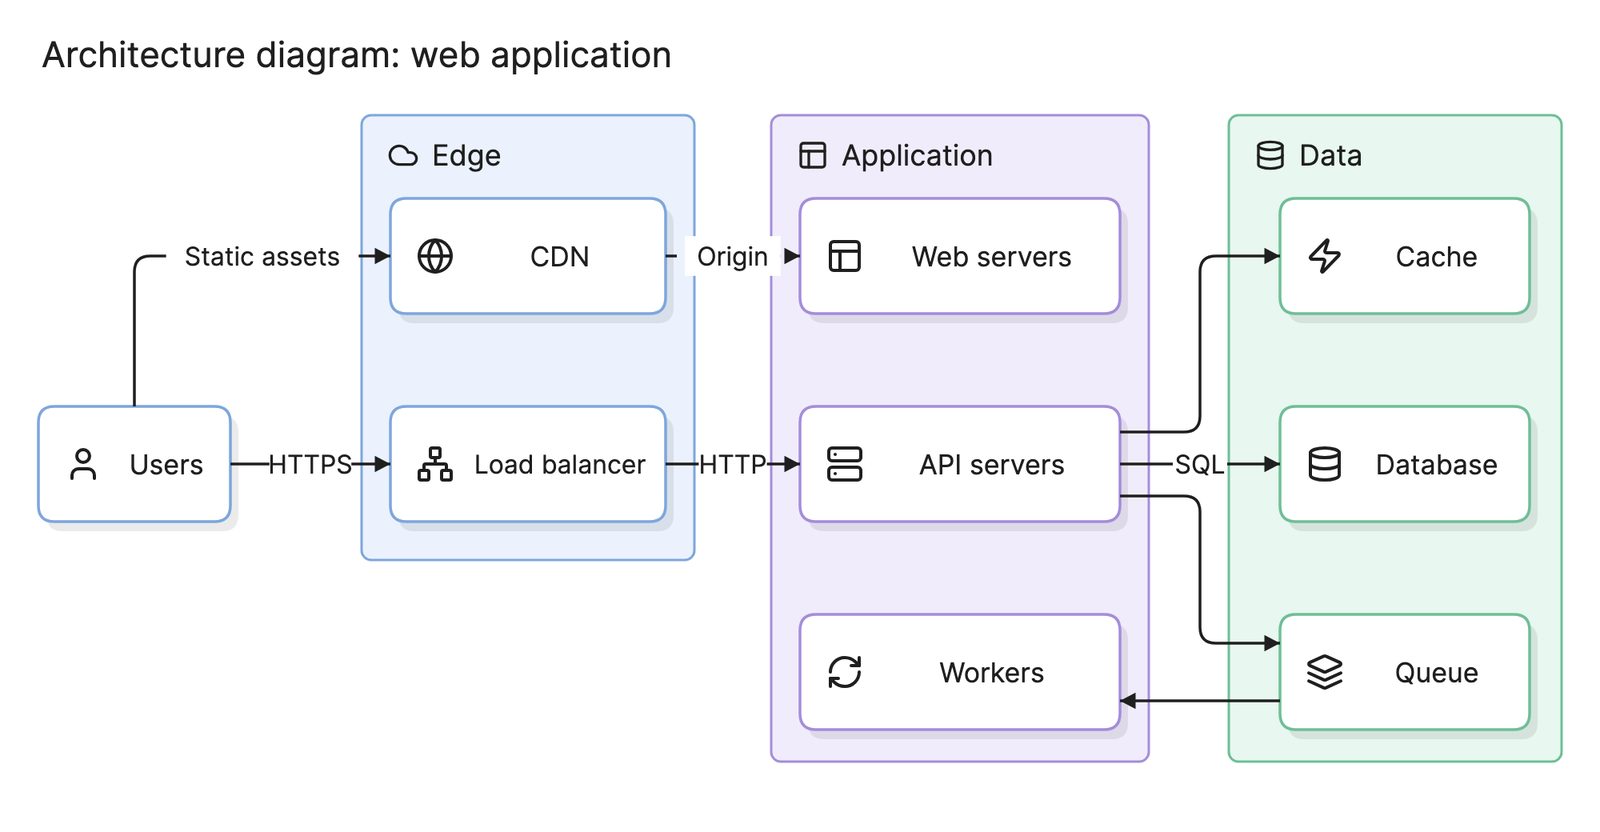
| Architecture diagram | Services, stores and connections in a software system | How is this software system put together? |
| Circuit schematic | Every component and wire | How is this block actually built? |
What tools can you use to make a block diagram?
- Whiteboards and sketches. The fastest way to agree on blocks in a meeting, but the result has to be redrawn somewhere to keep.
- Drag-and-drop diagramming tools. Good for a clean block diagram you plan to maintain, with full control of layout and labels.
- AI diagramming tools. Tools like Eraser turn a parts list, a requirements doc or a plain-English description into a block diagram you can keep editing, which is useful when the blocks are already written down somewhere.
Frequently asked questions
-
What is the difference between a block diagram and a flowchart?
A block diagram shows the parts of a system and the signals or data between them, and it has no notion of time or order. A flowchart shows the steps of a process in sequence, with decisions that change the path. A block diagram answers what the system is made of, a flowchart answers what happens next.
-
What is the difference between a block diagram and a circuit diagram?
A circuit diagram, or schematic, shows every component and wire, down to individual resistors and pin numbers. A block diagram groups those components into functional blocks, such as a power supply or a sensor, and shows only the connections between blocks. Engineers usually draw the block diagram first and the schematic afterwards.
-
What is a functional block diagram?
A functional block diagram is a block diagram in which each block is a function the system performs, such as filtering or amplification, rather than a physical part. The blocks are connected by the signals that flow between them. The term is common in control engineering and in systems engineering standards.
-
Are block diagrams used in software?
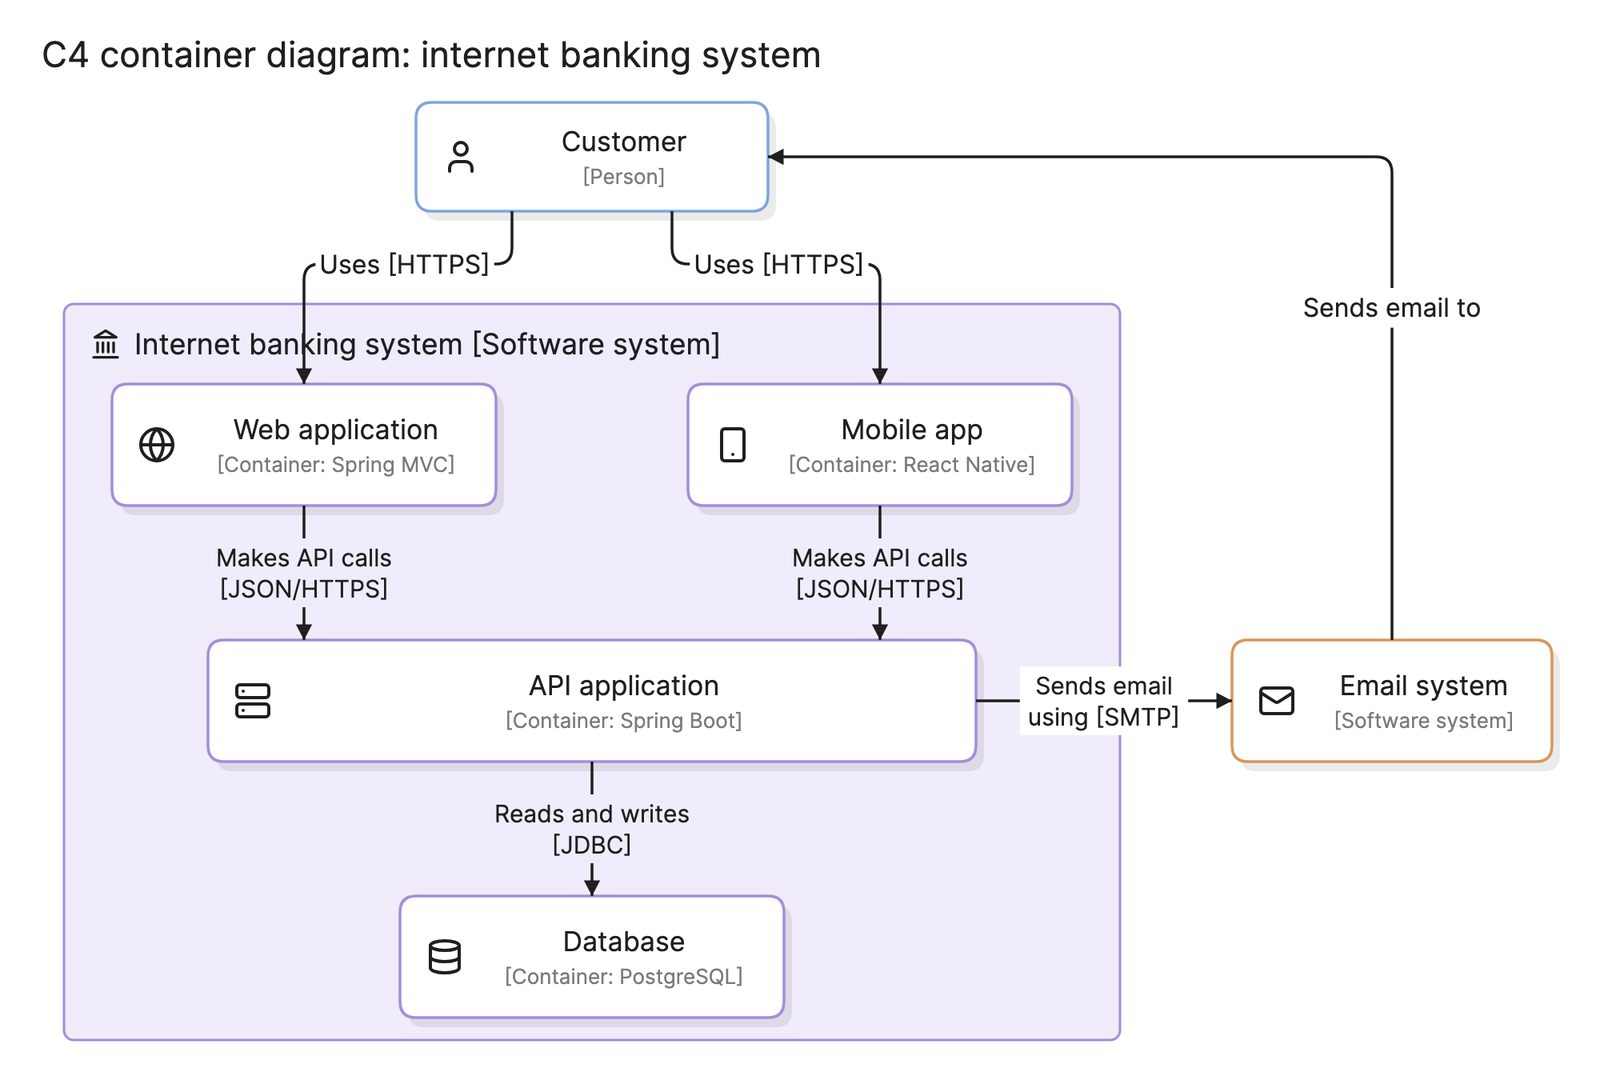
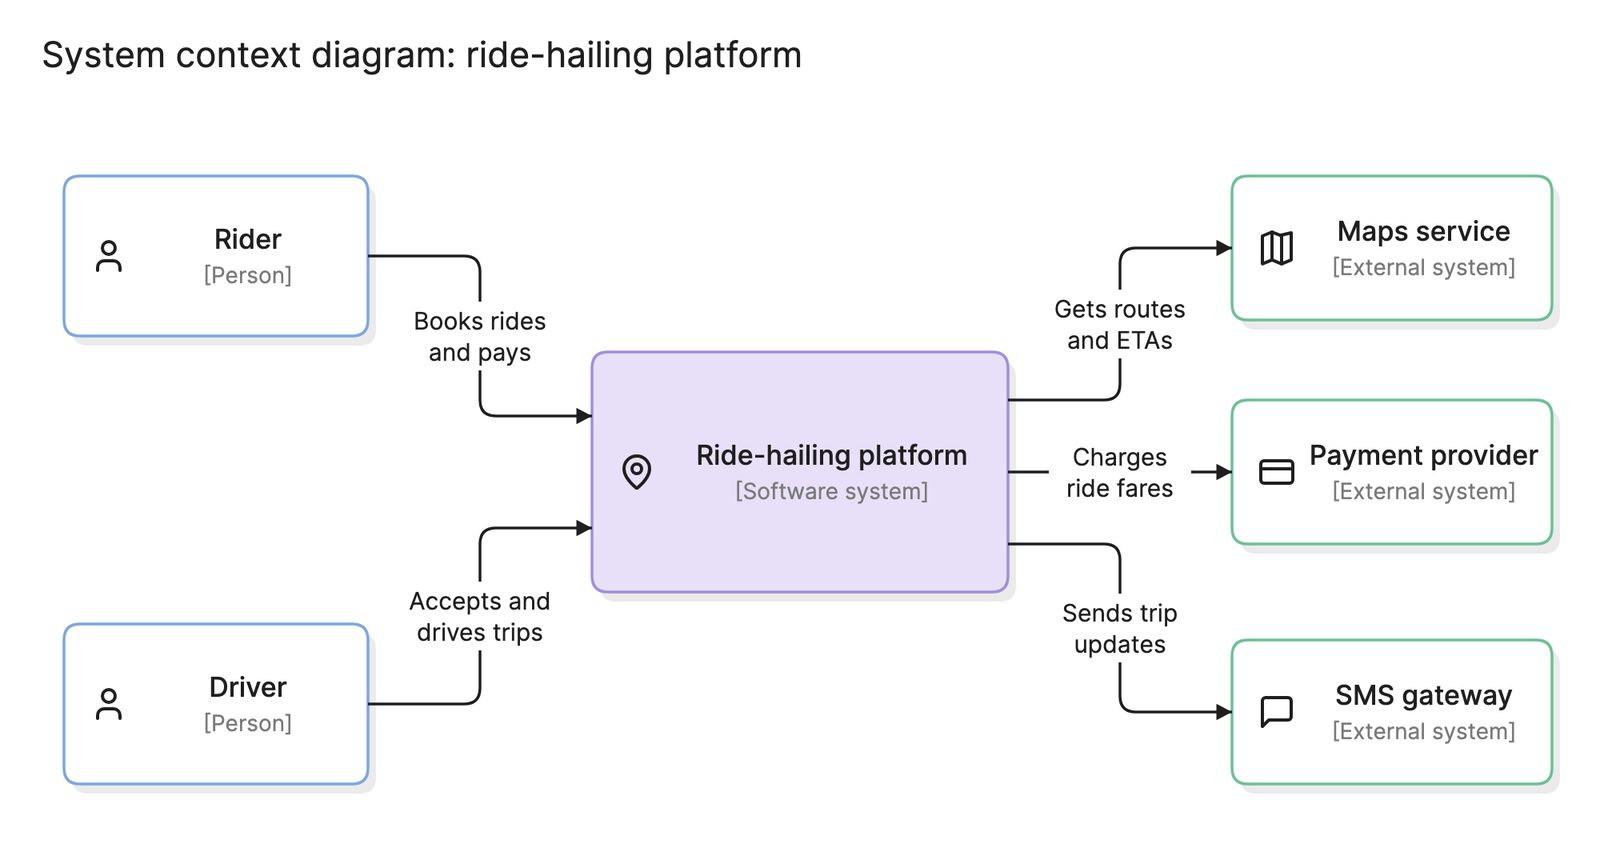
Yes. Software and cloud teams use block diagrams for the first picture of a system, before choosing a more specific notation. An architecture diagram is a block diagram in which the blocks are services and data stores, and the C4 model is a structured set of block diagrams at four levels.