Security
Threat modeling
Threat modeling is a structured way to find what can go wrong in a system before it is built, by mapping its parts, data flows and trust boundaries.
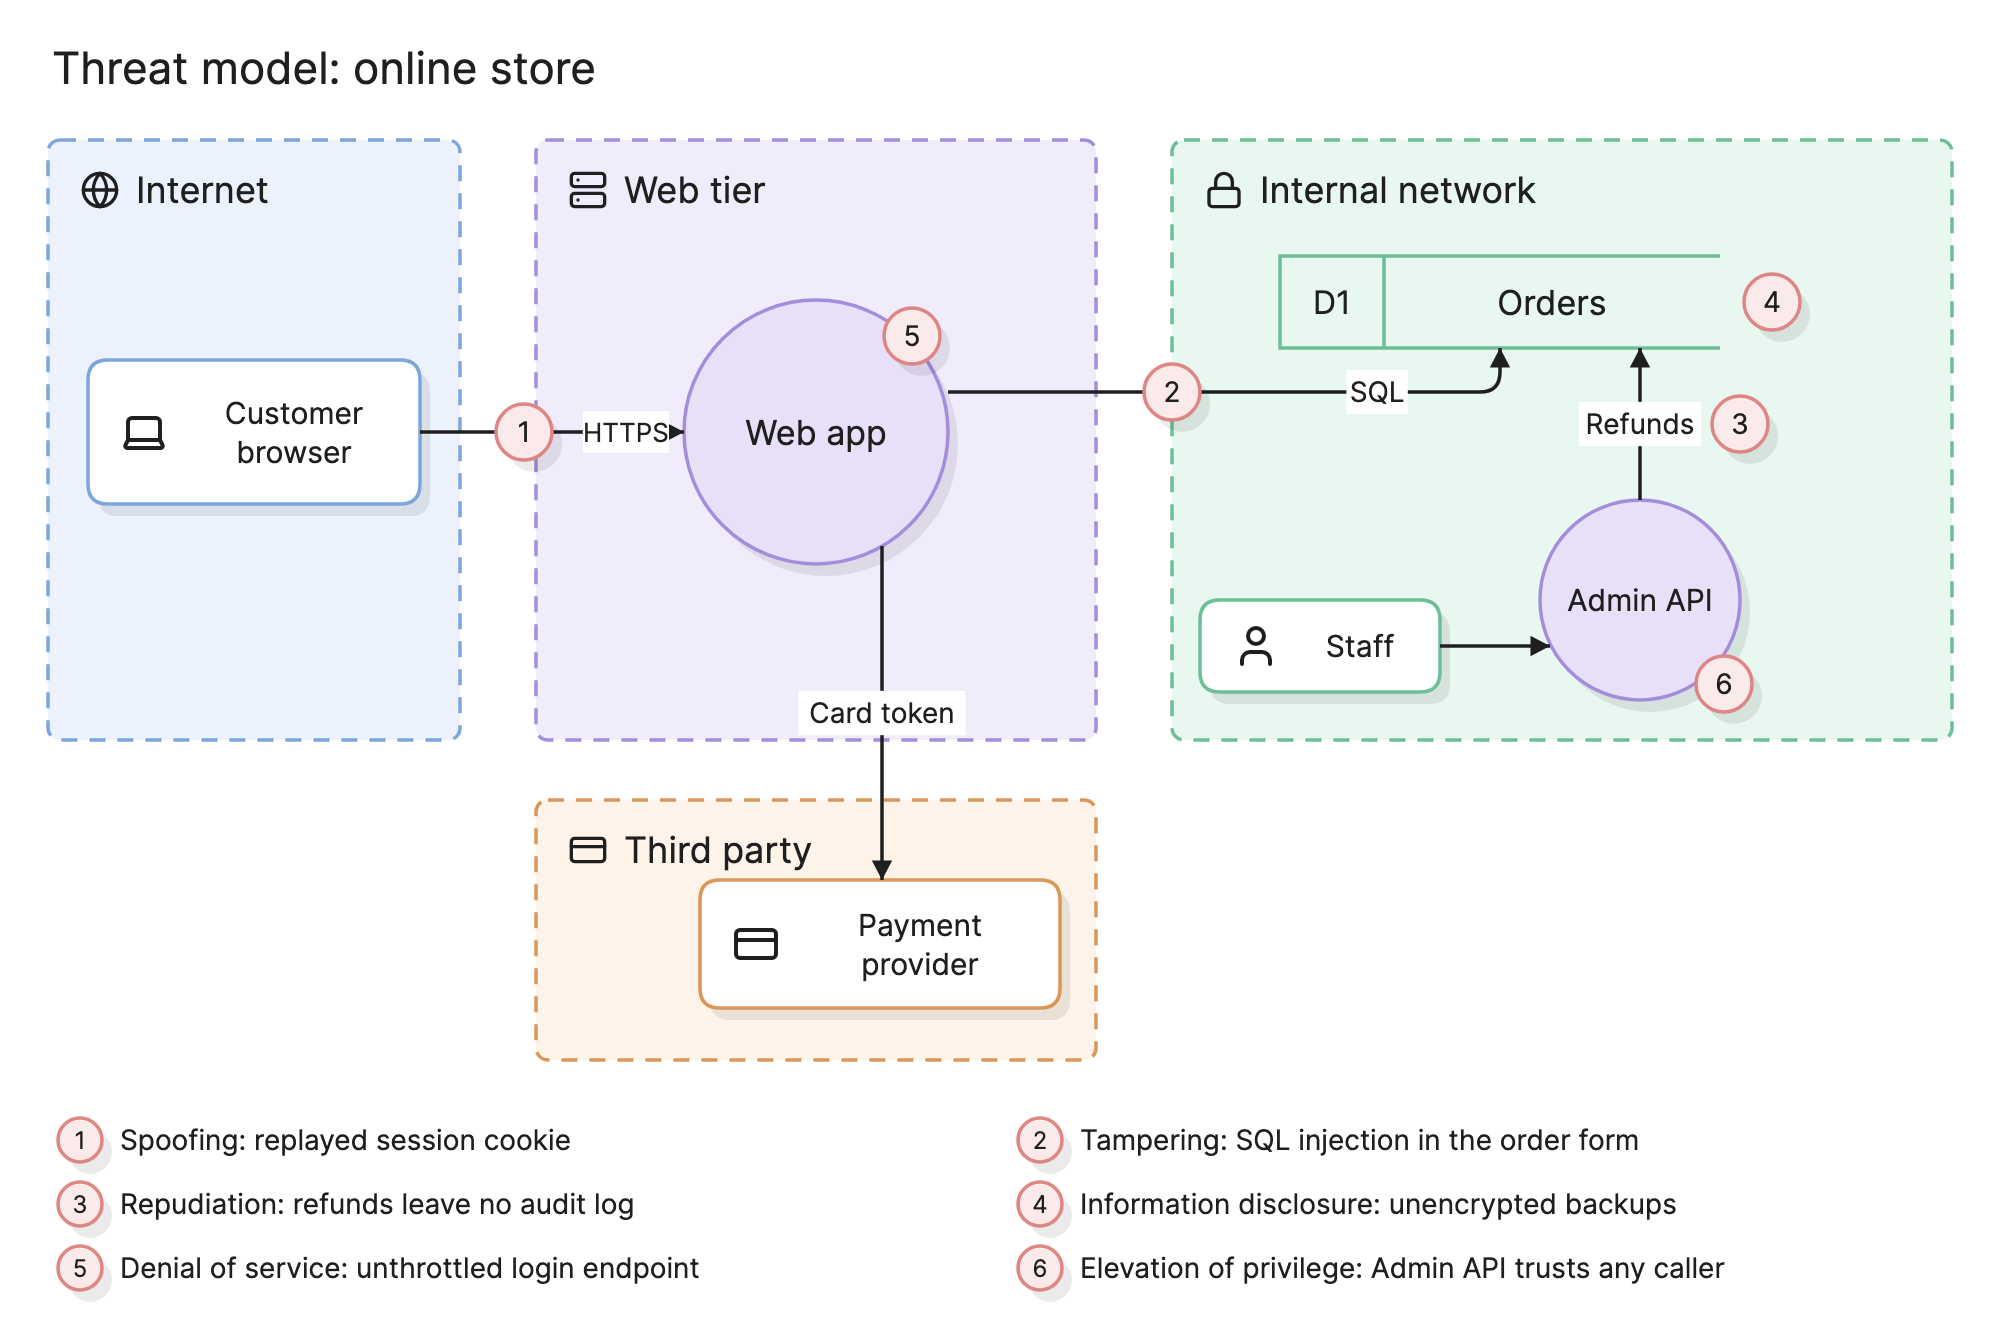
Teams threat model because fixing a design flaw costs an afternoon before launch and a quarter after it. An hour in front of a diagram, asking what an attacker would do, finds the missing boundary that testing would not.
Why does threat modeling matter?
- Design flaws are invisible to scanners. A database reachable from the web tier is not a bug in any file. It only shows up when someone draws the system and looks at it.
- It focuses security effort. With a list of ranked threats, the team fixes the three that matter instead of hardening everything a little.
- Compliance expects it. Most security frameworks ask for evidence that threats were considered at design time.
What are the four questions of threat modeling?
Every method comes down to the same four questions.
- What are we working on? Draw the system: its components, data flows and trust boundaries. This is usually a data flow diagram.
- What can go wrong? Walk the diagram and list threats, with STRIDE or attack trees as a prompt.
- What are we going to do about it? For each threat, choose to mitigate, accept, transfer or eliminate it, and record the decision.
- Did we do a good job? Check the mitigations landed, and revisit when the system changes.
What is STRIDE?
STRIDE is a checklist of six threat categories, each named for the security property it breaks. You apply it per element: for each process, store, flow and external entity, ask whether each category applies.
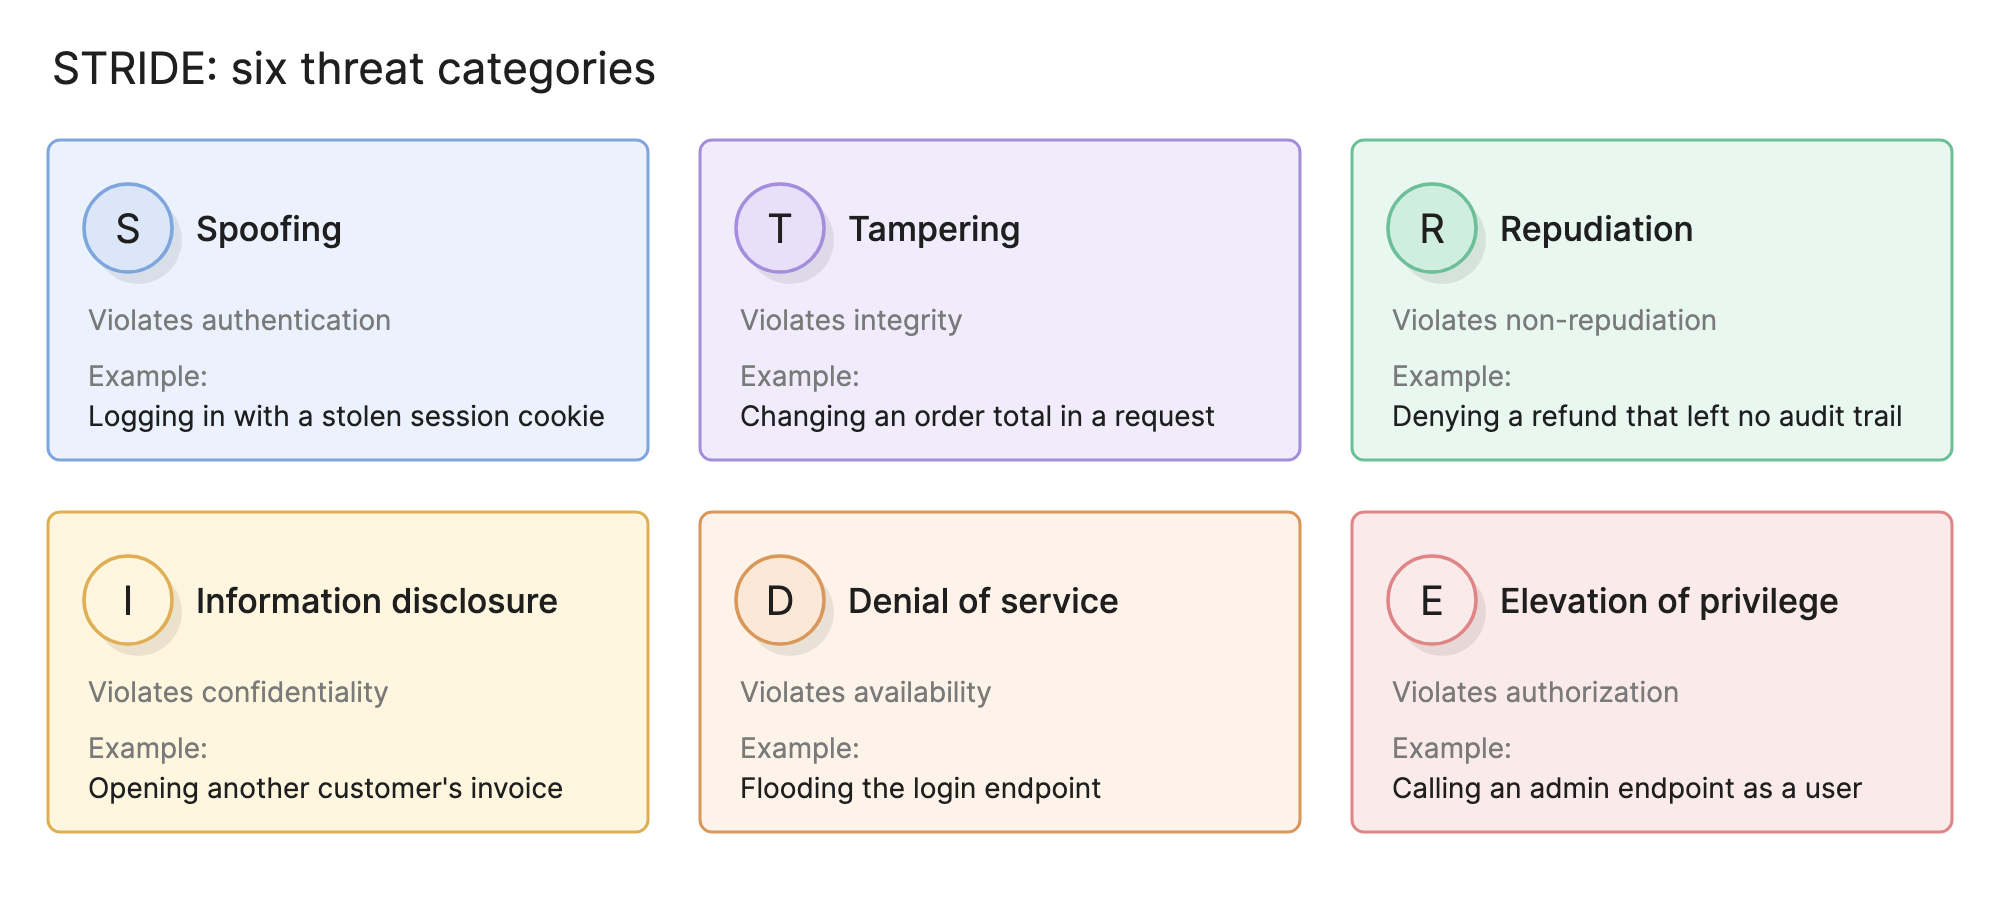
Processes are subject to all six. Data stores mostly face tampering, repudiation, information disclosure and denial of service. Data flows face tampering, information disclosure and denial of service. External entities face spoofing and repudiation. Knowing that keeps the walk-through short.
What is an attack tree?
An attack tree starts from an attacker’s goal, such as “read another customer’s orders”, and branches into the ways to reach it: guess an order ID, steal a session, exploit an injection, bribe an employee. Each branch splits again until the leaves are concrete steps you can assess for cost and likelihood.
Attack trees suit a specific high-value asset. STRIDE suits a whole system, because the diagram drives it rather than whoever is in the room. Many teams use both: STRIDE to find threats, then an attack tree for the two or three that worry them most.
How do you read a threat model diagram?
The diagram at the top of this page is a data flow diagram of an online store with trust boundaries added. Four dashed regions mark the trust levels: the internet, the web tier, the internal network and a third-party payment provider. The circle is a process, the open rectangle is a data store, and the boxes are external entities.
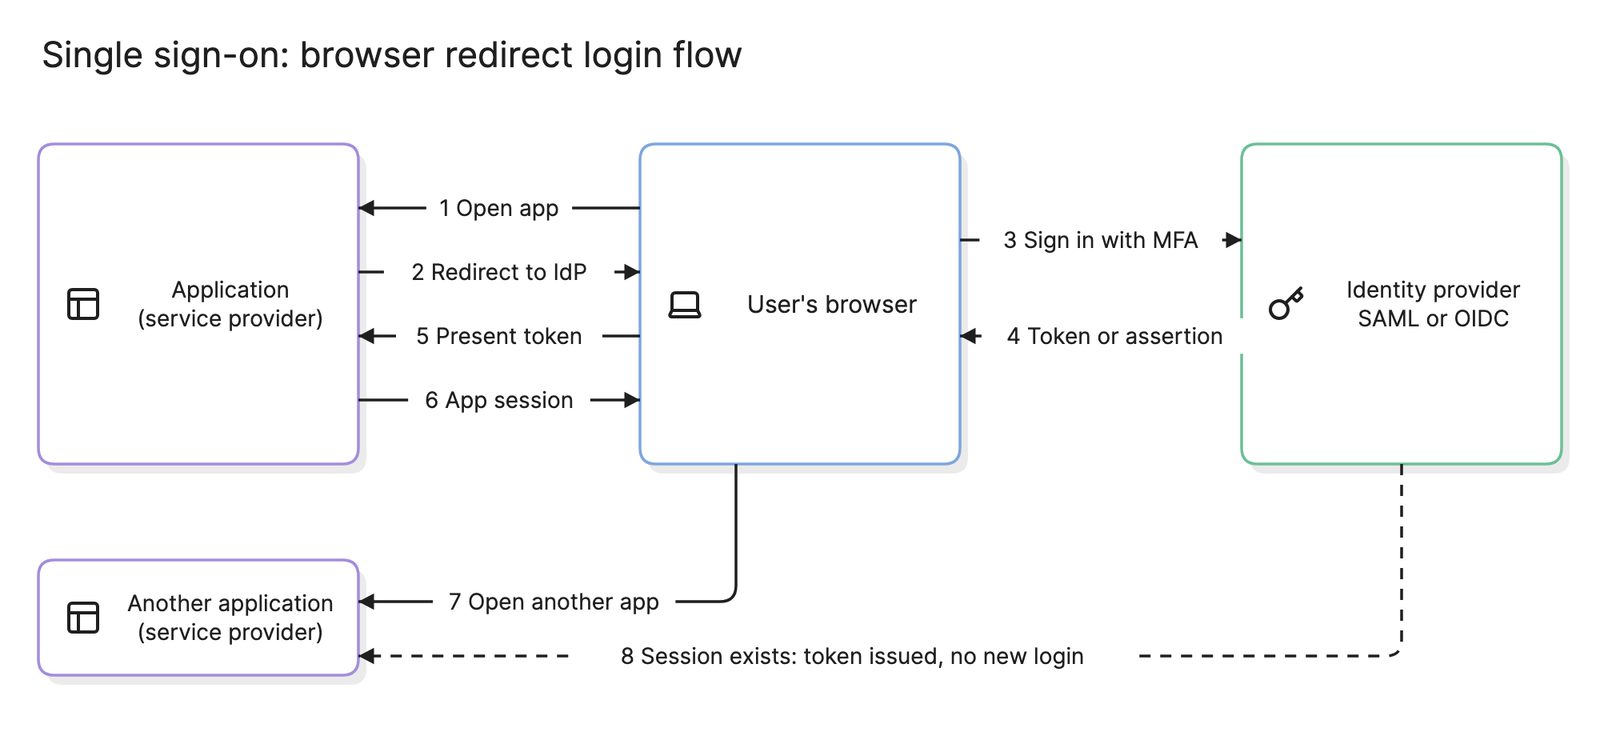
The numbered markers sit where threats were found, and most sit on a boundary crossing. Threat 1 is on the browser-to-app flow, where a stolen session cookie could be replayed. Threat 2 is where the web tier reaches into the internal network with SQL, where injection does its damage. Threat 6 is the Admin API, which trusts any caller on the network, so an attacker past threat 2 gets everything; an API gateway that checks the single sign-on token on every call is the usual mitigation. The legend ties each number to a STRIDE category and a one-line description, which becomes the first column of the mitigation table.
How do you do threat modeling?
- Set the scope. One system or subsystem per session, with its owners in the room.
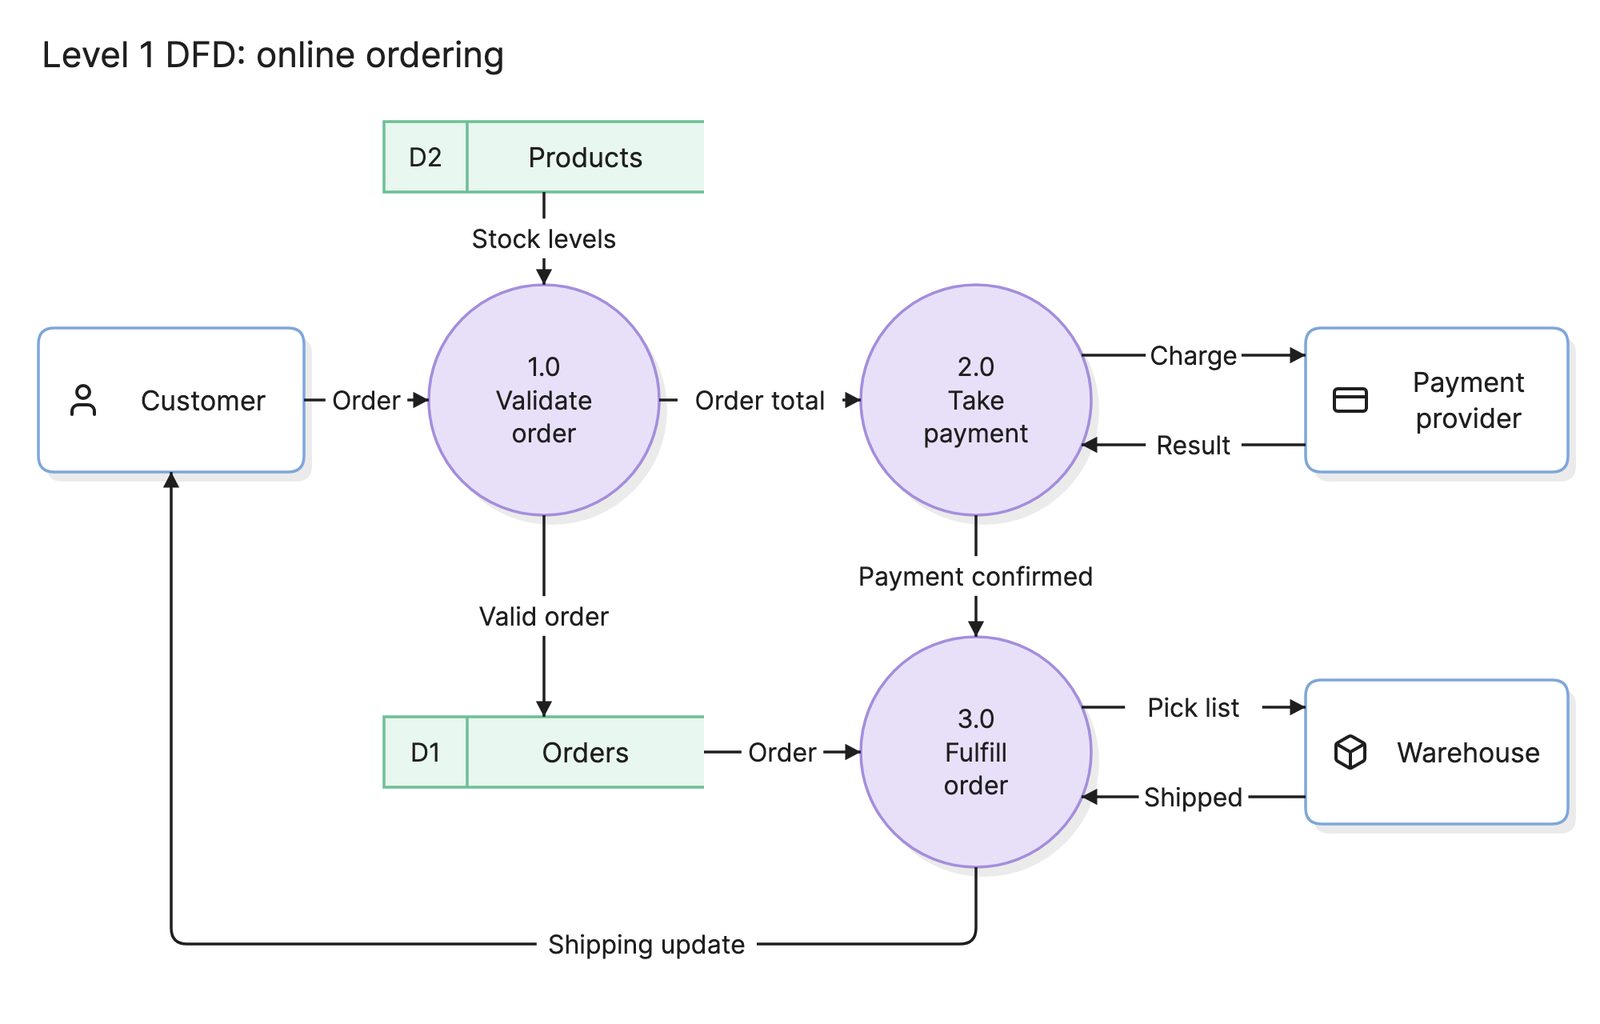
- Draw the data flow diagram. Processes, stores, flows and external entities. Start from the architecture diagram if one exists.
- Add trust boundaries. Draw a dashed region around each zone with a different level of trust: internet, DMZ, internal, vendor, admin. A network diagram of the subnets tells you where they are.
- Walk the elements with STRIDE. For each element and each applicable category, ask how it could happen here. Number the threats on the diagram.
- Rank and decide. Score each threat by impact and likelihood, then record mitigate, accept or transfer for each one.
- Track the mitigations. Turn them into tickets, and store the diagram with the design so the next change updates it.
What are common threat modeling mistakes?
- Starting without a diagram. A list of threats brainstormed from memory misses whatever nobody remembered.
- No trust boundaries. Without them, the diagram is just an architecture picture, and the threats have nowhere to cluster.
- Modeling the whole company. A model with 80 elements never finishes. Model one subsystem at a time.
- Stopping at the list. Threats without decisions and tickets are a document, not a mitigation.
- Never revisiting. The model describes the system as it was. A new integration adds a boundary nobody modeled.
How does threat modeling compare with related practices?
| Practice | When | Finds |
|---|---|---|
| Threat modeling | Design time, on a diagram | Structural flaws: missing boundaries, trusted inputs, unlogged actions |
| Code review and static analysis | As code is written | Implementation bugs in specific files |
| Penetration testing | Against a running system | Exploitable flaws of either kind |
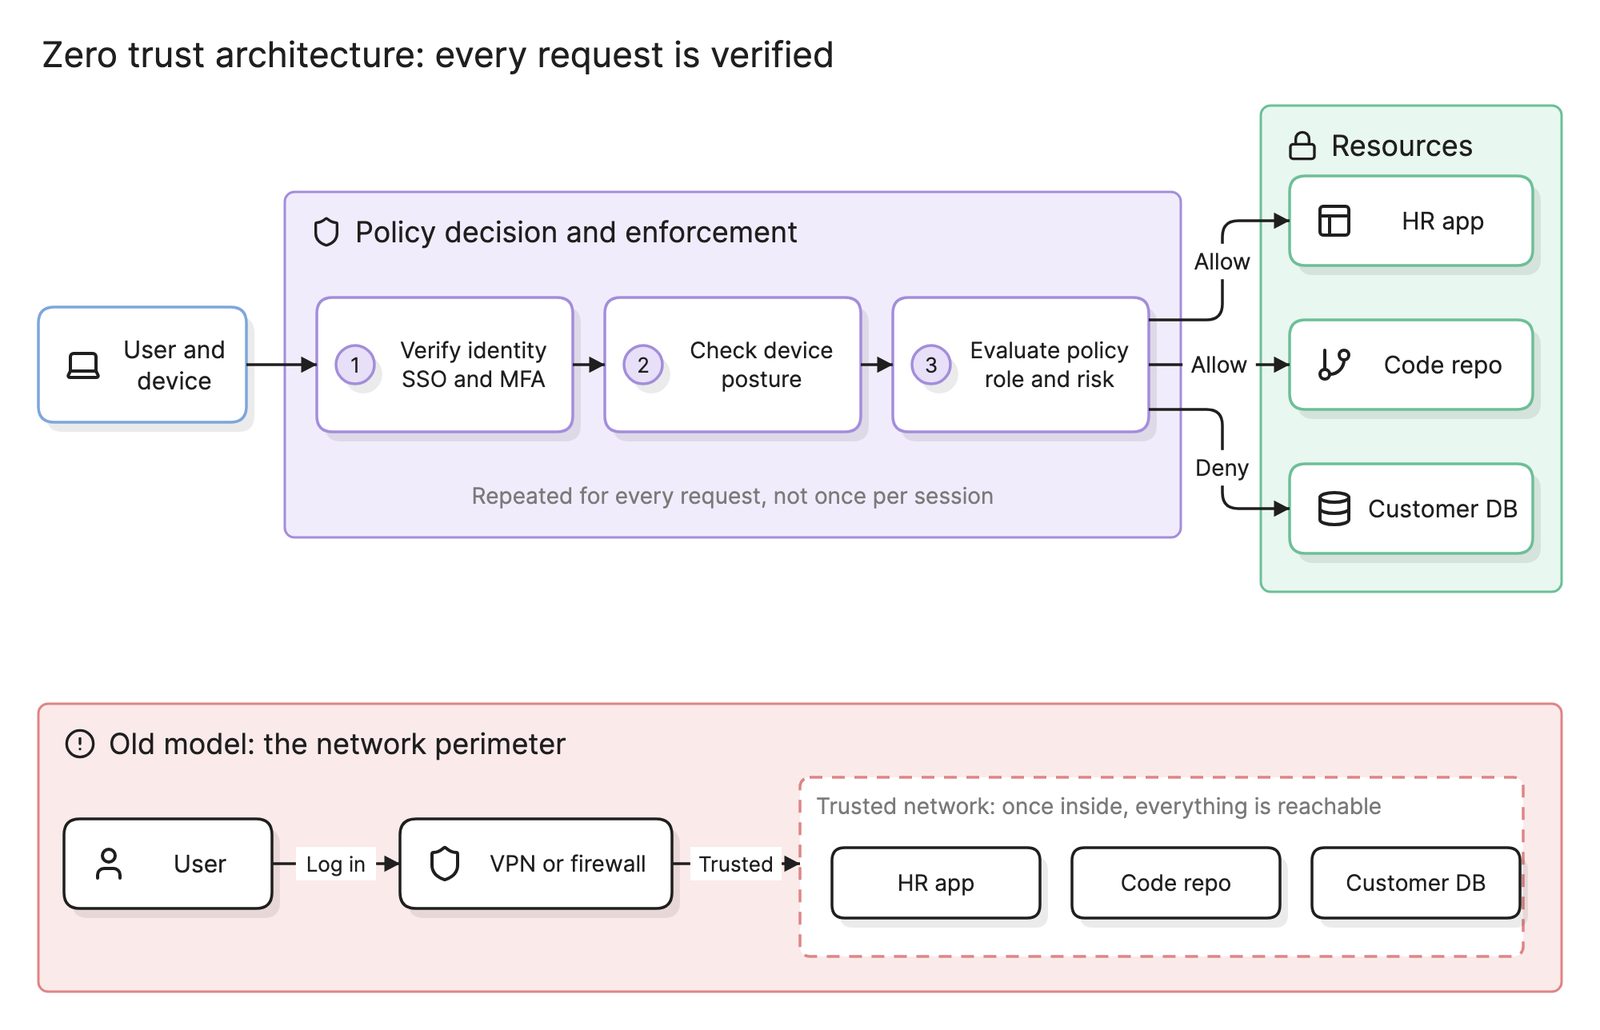
| Zero trust architecture | An architectural stance | Removes the implicit trust that threat 6 above depends on |
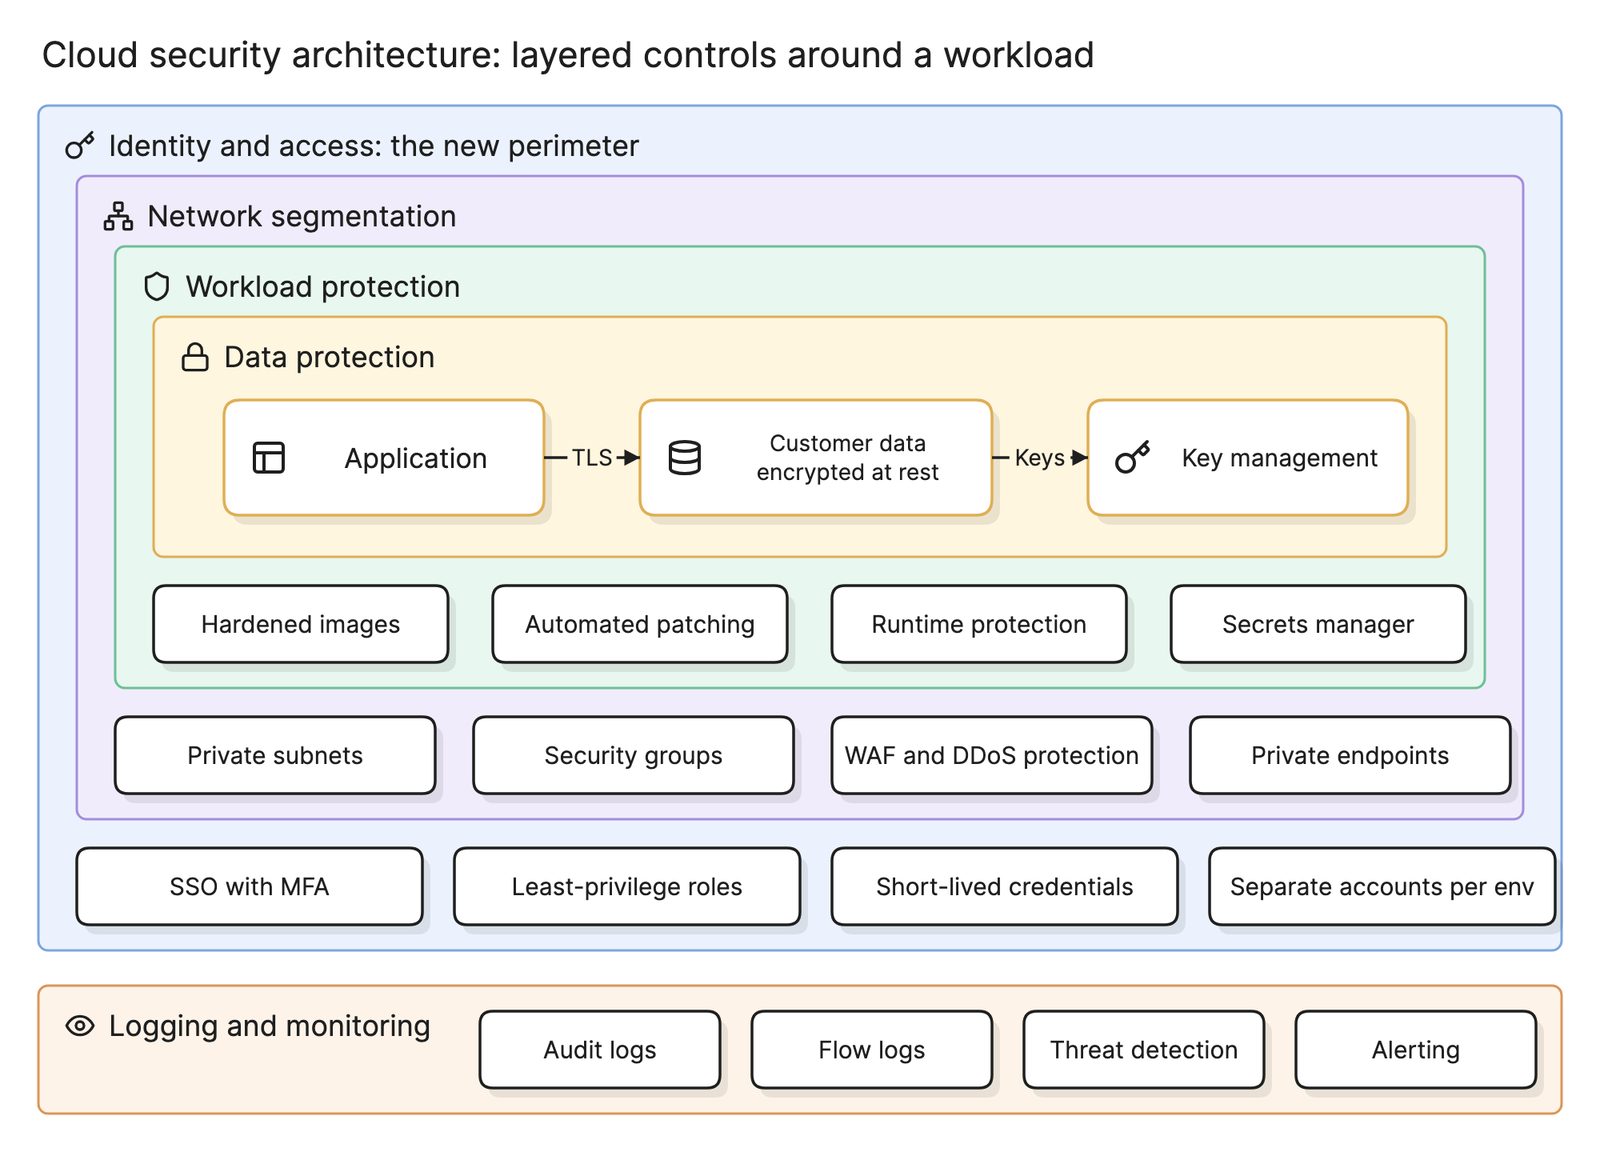
A cloud security architecture review covers the same ground at the account level; threat modeling goes a system at a time.
What tools help with threat modeling?
- Dedicated threat modeling tools. Desktop and web tools with DFD stencils, trust boundaries and automatic STRIDE-per-element threat generation.
- Drag-and-drop diagramming tools. Any tool that can draw a data flow diagram with dashed regions works for the diagram, with the threat list kept in a document or tracker.
- AI diagramming tools. Tools like Eraser turn a description of a system into a threat model diagram with boundaries you can keep editing, which gets a session started in minutes rather than with a blank canvas.
For more on this kind of diagram, see threat modeling.
Frequently asked questions
-
What is the difference between threat modeling and a penetration test?
Threat modeling happens on paper, before or during design, and asks what could go wrong. A penetration test happens against a running system and finds what actually goes wrong. The model tells testers where to look and catches design flaws no test can reach, such as a missing boundary between tiers.
-
What is a trust boundary?
A trust boundary is a line in the system where the level of trust changes: between the internet and your servers, between a web tier and a database, between your code and a vendor's. Threats cluster where data crosses one, because the receiving side has to decide whether to trust what arrives.
-
Who should take part in threat modeling?
The engineers who designed the system, because they know the flows, plus one person who thinks like an attacker, whether a security engineer or a curious developer. Product owners help rank what matters. A session of three to five people for an hour per subsystem finds most of what a larger meeting would.
-
How often should you threat model?
Model a new system before building it, and revisit the model whenever the architecture changes: a new external integration, a new trust boundary, a new kind of data. Many teams tie it to the architecture diagram, so an update to the diagram triggers a review of the threats.