Guide
How to make a network topology diagram from a live Cisco network
Connect Meraki or Catalyst Center with read-only access, scan, and ask for the topology you need: one site, one switch or every site.
The usual network topology diagram is a Visio file that matched the network on the day someone drew it. Since then a stack gained a member and an uplink moved, and the network diagram stayed the same.
This guide starts from the network instead. Your Cisco controller already knows which devices exist and how they are linked. Eraser reads that with read-only access, and you ask for the diagram you need. It takes about ten minutes once you have the credentials.
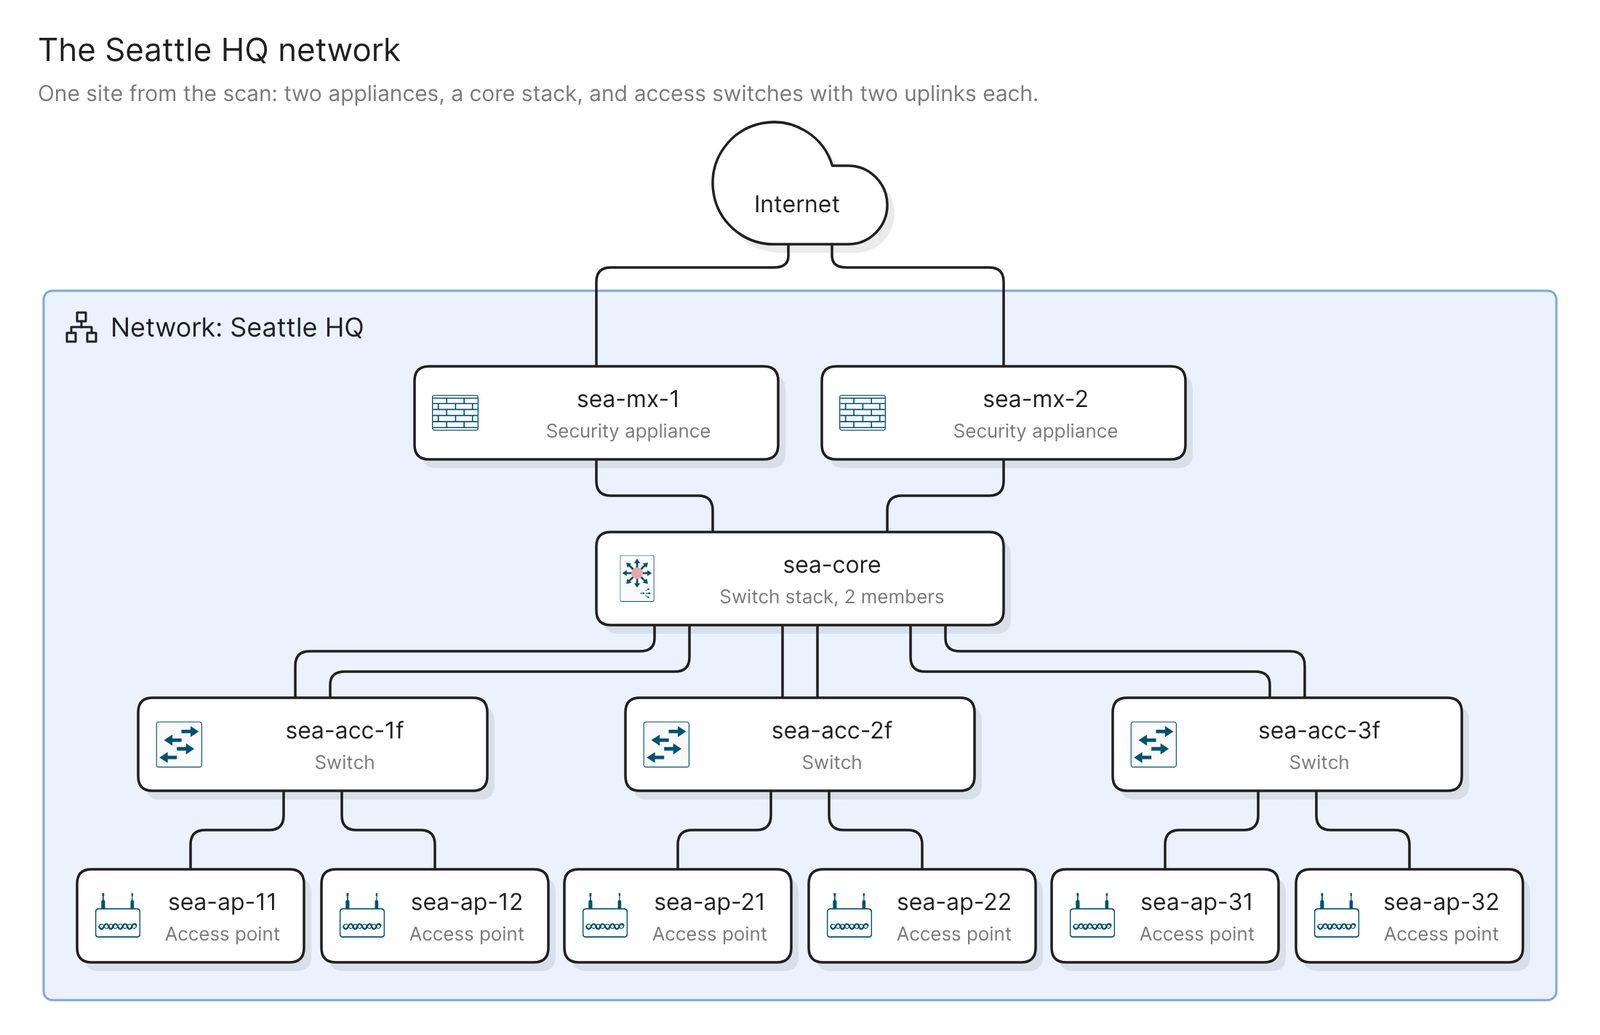 Example: one site, from the edge down to the access points
Before you start
You need two things:
- Access to Eraser
- Access to your Meraki dashboard or Catalyst Center, with permission to create a read-only API key or user
Eraser reads devices, the site or network each one belongs to, and the links between devices, and nothing else. It never starts discovery or changes a device. VLANs, subnets and firewall rules are not in the scan, so the result shows devices and links, and a logical diagram needs another source.
Step 1. Connect the controller
Pick the controller you run. Meraki dashboard connects with a read-only API key, and you then choose the networks to import. Catalyst Center connects with a read-only user and the controller’s hostname, and you then choose the sites. Eraser scans as soon as you connect. A minute or two later it holds a model, which is an inventory of the devices and how they are linked.
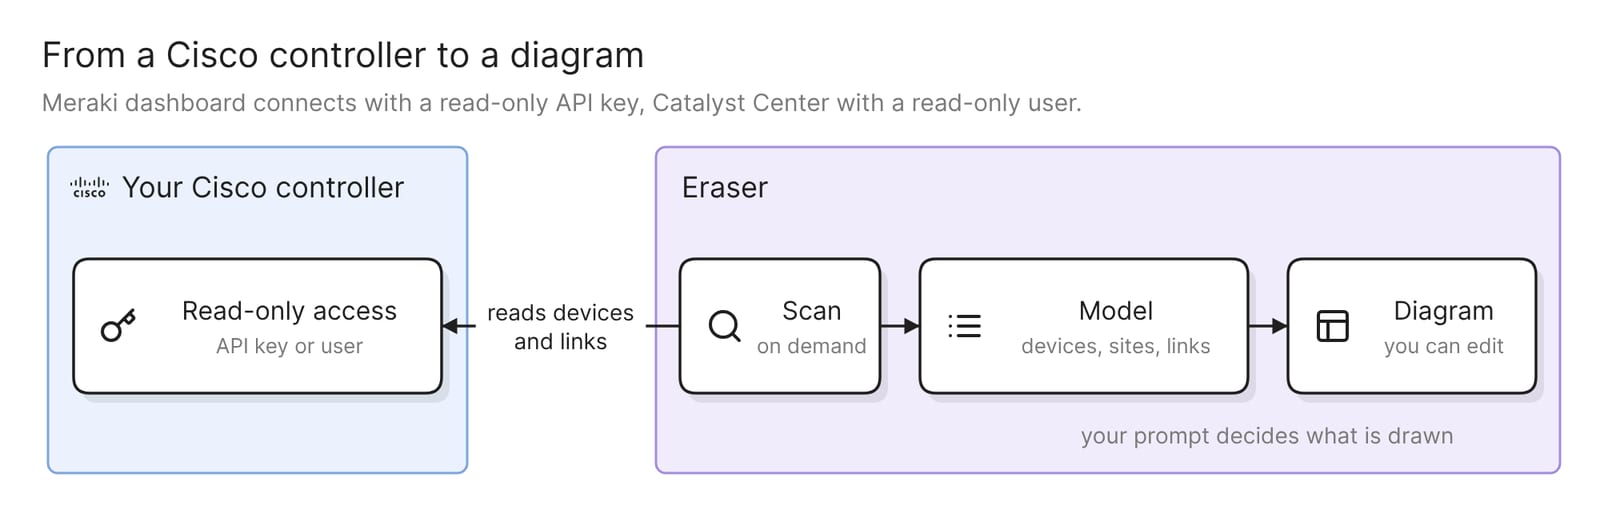 What connecting a controller sets up
Two limits apply. Catalyst Center has to be reachable from Eraser over HTTPS and run one of the releases Eraser supports, so check the list before you start. A Meraki network with only wireless access points has no link-layer topology, so it is refused. The docs list the supported releases and have the click-by-click steps for both controllers.
Step 2. Ask for one site
Open AI chat, attach the model, and say what you want in plain words. Start with one site:
Draw the Seattle HQ network: its appliances, switches and access points,
and how they are linked. Put the edge at the top and add a cloud for the
internet above it.
The example at the top of this page is the kind of diagram this asks for. The security appliances sit at the edge, the core stack is below them, and each access switch carries its access points. The internet cloud is the one thing on it that is not in the scan, and it is there because the prompt asked for it.
A model covers everything the connection imports, so name the site in the prompt, the way the controller names it. A diagram of every device at every site answers no particular question, and at any real size it is too dense to read.
The result is an ordinary diagram. You can move, rename and regroup anything on it, or keep prompting.
Step 3. Check it against the network
Check four things before you share the diagram.
- Every site is there. Compare the sites or networks on the diagram with the controller. A missing one was left out when you connected, or it is a Meraki network with only access points.
- Redundant links are both drawn. An access switch with two uplinks should show two lines to the core. If you see one, ask for parallel links to be drawn separately, then compare the result with the controller.
- Device roles are right. Eraser sorts devices into routers, switches, switch stacks, security appliances, access points and wireless controllers. Check that each device carries the type you expect and sits in the right tier.
- Neighbors are explained. A device the controller sees on a link and does not manage comes through as a neighbor. Each one should be something you can name, such as a switch from another vendor. One you cannot name is a reason to visit the wiring closet.
The diagram can only be as complete as the controller’s own picture. Eraser reads what the controller has already discovered and does not probe the network itself.
Step 4. Ask for the view you need
Each of these prompts asks for a different view of the same scan.
One switch and what hangs off it
Show everything linked to sea-acc-2f, one hop out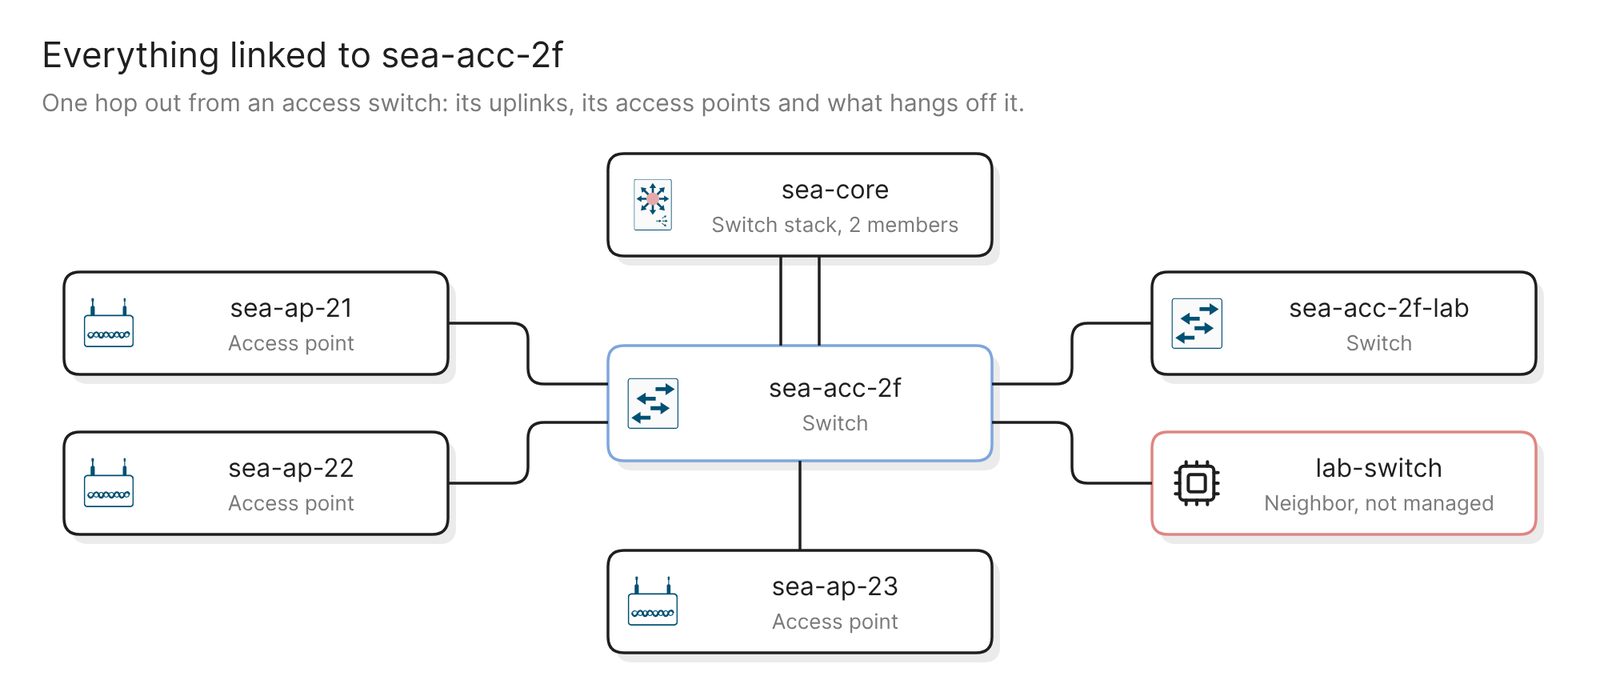 Example: one access switch and its links, with the neighbor the controller does not manage in red
This is the diagram for a change window. It shows what goes dark when the switch reloads, and what is plugged into it that nobody wrote down.
Every site, side by side
Draw every site as its own group. Name the edge devices and core switches,
and collapse the access switches and access points into counts.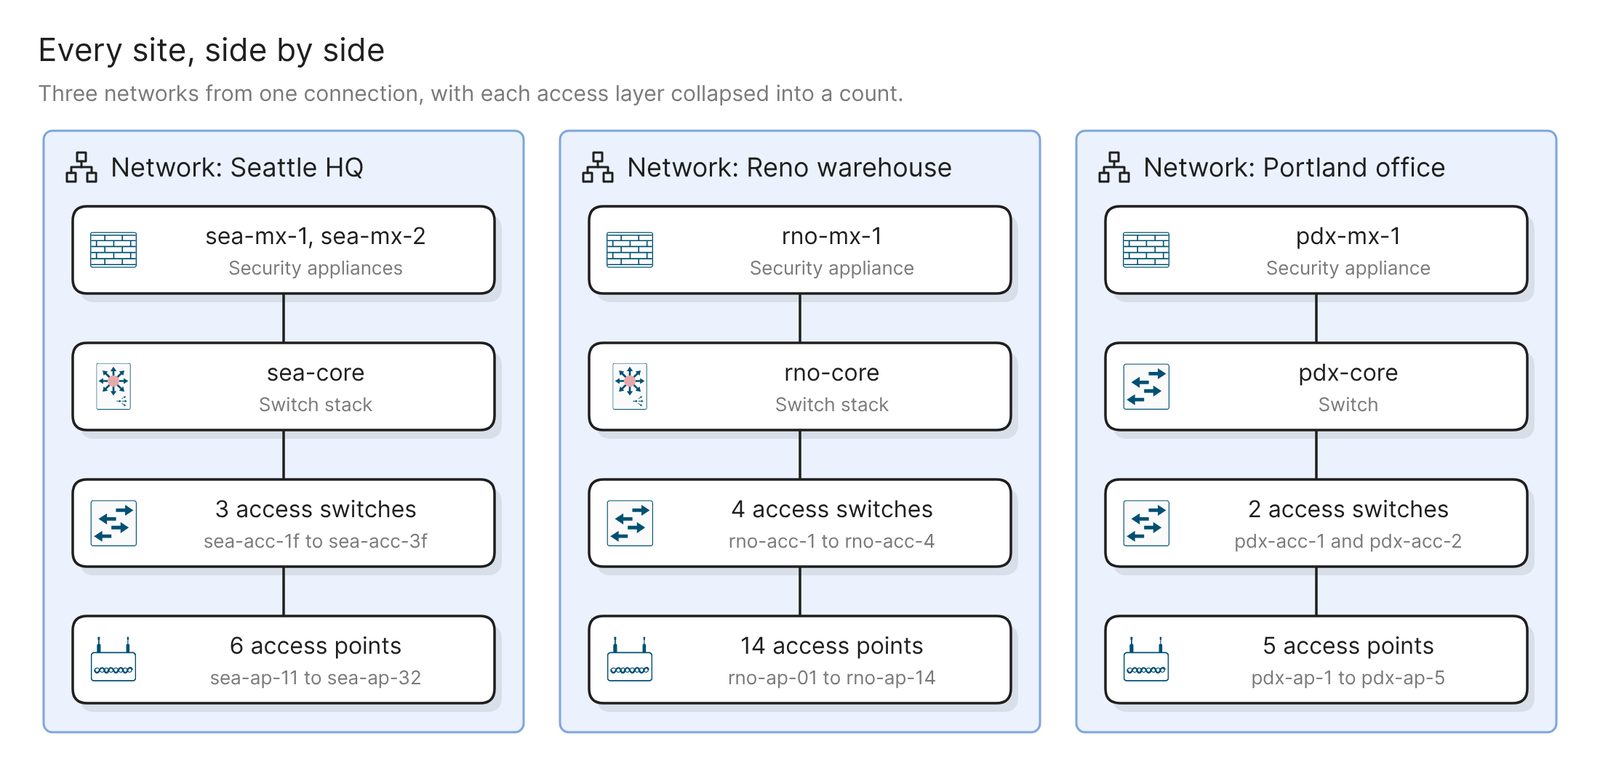 Example: three sites at a glance, with each access layer collapsed into a count
This is the overview for an audit or a new team member. The scan holds links the controller has discovered between devices. A VPN tunnel between two sites is not one of them, so add WAN links by prompt or by hand. If the WAN is a hub-and-spoke network, say which site is the hub.
The wireless layer
Draw the access points at Seattle HQ and the switch each one connects toUseful before a switch replacement, when the question is which access points go down with which switch.
An inventory instead of a diagram
Write an inventory of the devices at each site, grouped by typeThe same model also answers in words. Use this in place of the device spreadsheet kept beside the Visio file.
Other sources connect the same way. VMware covers the virtual side, and AWS, Azure and Google Cloud cover the networks you run in the cloud. One prompt can read up to five models, and the AWS guide walks through the cloud version.
Keep it current
The diagram reflects the last scan, and scans run when you ask for one. Nothing rescans on a schedule. After a change window, rescan the controller and regenerate the diagrams that matter. Verify checks an existing diagram against the model and lists every issue without changing the diagram.
A finished diagram can be shared with a link, embedded in the wiki your team already uses, or exported. Visio is one of the export formats, for anyone who still wants the file.
To take access away again, remove the connection in Eraser, then revoke the API key or delete the Catalyst Center user. Removing the connection changes nothing in Cisco.
Other ways to make a network topology diagram
- Use the topology view in your controller. The Meraki dashboard has a topology page with layer 2 and layer 3 views, and Catalyst Center has a Topology tool that exports a snapshot as SVG, PDF or PNG. As of November 2026, Cisco Cloud Control adds “a unified view of network infrastructure across multiple controller domains”. These are the right choice during an incident, in the console you already have open. Each draws the controller’s whole map in its own layout, and a diagram scoped to one question is a separate job.
- Run a discovery tool. LibreNMS is a GPL-licensed monitoring system that discovers a network “using CDP, FDP, LLDP, OSPF, BGP, SNMP and ARP” and draws a network map from what it finds. SolarWinds Network Topology Mapper is a commercial product that exports its maps to Visio, PDF and PNG. Either suits a network with several vendors or no controller. You install and run the tool yourself, with SNMP access to the devices.
- Draw it by hand with Cisco’s icons. Cisco publishes its network topology icons as Visio stencils, PowerPoint files and images, and says “You may use them freely, but you may not alter them.” draw.io has Cisco and network shape libraries. This suits a network that is not built yet. Nothing checks the drawing against the network, which is how the Visio file went stale.
If the old Visio file is still close to the truth, Eraser can convert it into an editable diagram to start from. See the guide to opening a .vsdx file without Visio.
FAQ
What access does Eraser need to my Cisco controller?
Read-only access. For Meraki that is an API key created by a read-only administrator, and for Catalyst Center it is a user with a read-only role. The key or password is stored encrypted and is never sent to AI.
Does the diagram show VLANs and subnets?
No. The scan holds devices, sites or networks, and the links between devices. Add VLANs and subnets by prompt or by hand, or start a logical diagram from a description with the logical network diagram generator.
Does this work with an on-premises Catalyst Center?
Yes, if it runs a supported release and Eraser can reach it over HTTPS. If it is only reachable on a private network, the docs say to ask your Eraser administrator about private connectivity.
Does the diagram update when the network changes?
Not on its own. Rescan the controller, then regenerate the diagram or run Verify on it.
Do Meraki and Catalyst Center have their own topology views?
Yes. Meraki has a topology page for each network and Catalyst Center has a Topology tool. As of November 2026, Cisco Cloud Control has a topology view that spans controllers. Each is a view inside its console.
Where to go next
If you would rather start from a description than a controller, the Cisco network diagram generator draws one from plain English. The network topology diagram generator and the network diagram generator are the general-purpose versions.
For reference diagrams, see a physical network security diagram, a network diagram for disaster recovery and a Jenkins network diagram. For the ideas behind the boxes, the glossary covers load balancers and zero trust architecture.