IT management
Business capability map
A business capability map is a one-page model of what an organization does, split into stable capabilities, used to plan where to invest in systems and change.
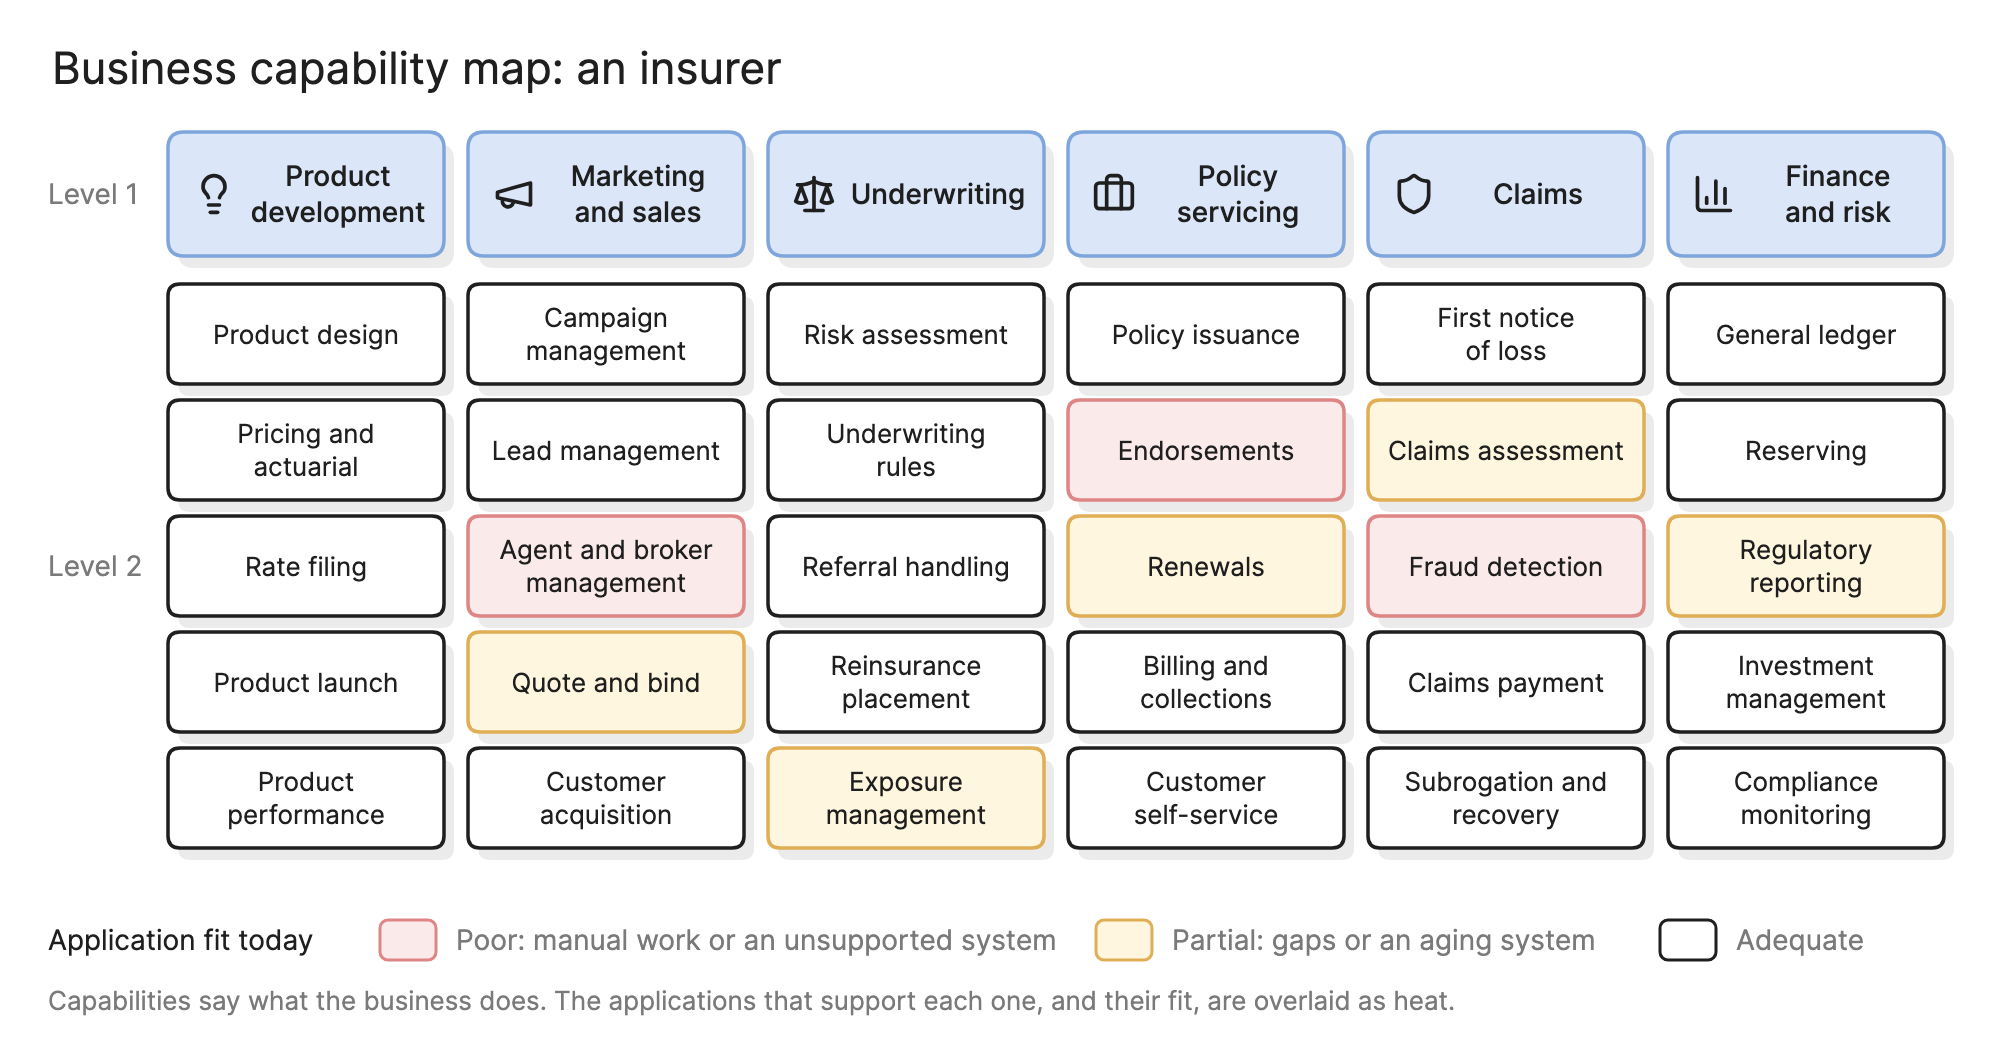
Executives, architects and finance need one picture of the business that none of them owns and all of them can read. Organization charts change every year, process maps run to hundreds of pages and application lists mean nothing to a divisional head. A capability map stays stable, fits on one page and lets a conversation about investment start from what the business does rather than from which system or team is asking.
Why use a business capability map?
- It is stable. Capabilities change when the business model changes, not when the organization reorganizes or a system is replaced. A map drawn five years ago is mostly still right.
- It is business language. Underwriting, claims payment and regulatory reporting mean the same thing to the chief operating officer and to an architect.
- It is an index. Applications, projects, costs and risks can all be attached to capabilities, which makes the map the organizing frame for enterprise architecture.
What is a capability, and what is it not?
A capability is something the business can do, named as a noun phrase, that exists whether or not it is done well, by whom or with what. The map only stays stable if it holds capabilities and nothing else.
| Concept | What it is | Example | Changes when |
|---|---|---|---|
| Capability | What the business can do | Claims assessment | The business model changes |
| Process | How it does it, as a sequence of steps | Receive first notice of loss, assign adjuster, assess, approve | The way of working changes |
| Function | Who does it, as an organizational unit | The claims department | The organization restructures |
| Application | What it does it with | The claims platform | A system is replaced |
A process can use several capabilities and an application can support several capabilities, while a capability often needs several of each. Those many-to-many links are what the map is for; naming a capability after a department or a system collapses them.
What are the levels of a capability map?
- Level 1 is the handful of top-level capabilities that describe the whole business, such as product development, underwriting and claims for an insurer. These are the column headers on the map.
- Level 2 breaks each one into five to eight capabilities a business leader would recognize as distinct, such as fraud detection and claims payment.
- Level 3 breaks those down again for detailed work such as application mapping or process design. It rarely appears on the one-page map.
How do you read a heat-mapped capability map?
The map at the top of this page is for an insurer, with six level 1 capabilities as columns and five level 2 capabilities under each. The heat shows application fit: red cells are capabilities run on manual work or an unsupported system, yellow cells have known gaps or an aging system and white cells are adequate today.
Three things stand out. Endorsements and fraud detection are red, so mid-term policy changes and fraud checks are the most exposed parts of the operation. The yellow runs through quote and bind, renewals and claims assessment, the steps a customer actually experiences, so the pain sits where it is most visible. And the finance column is white apart from regulatory reporting, so the back office is not where the next investment should go.
Heat can also show strategic importance, spend, the number of supporting applications or risk. Show one at a time.
How is a capability map used in planning?
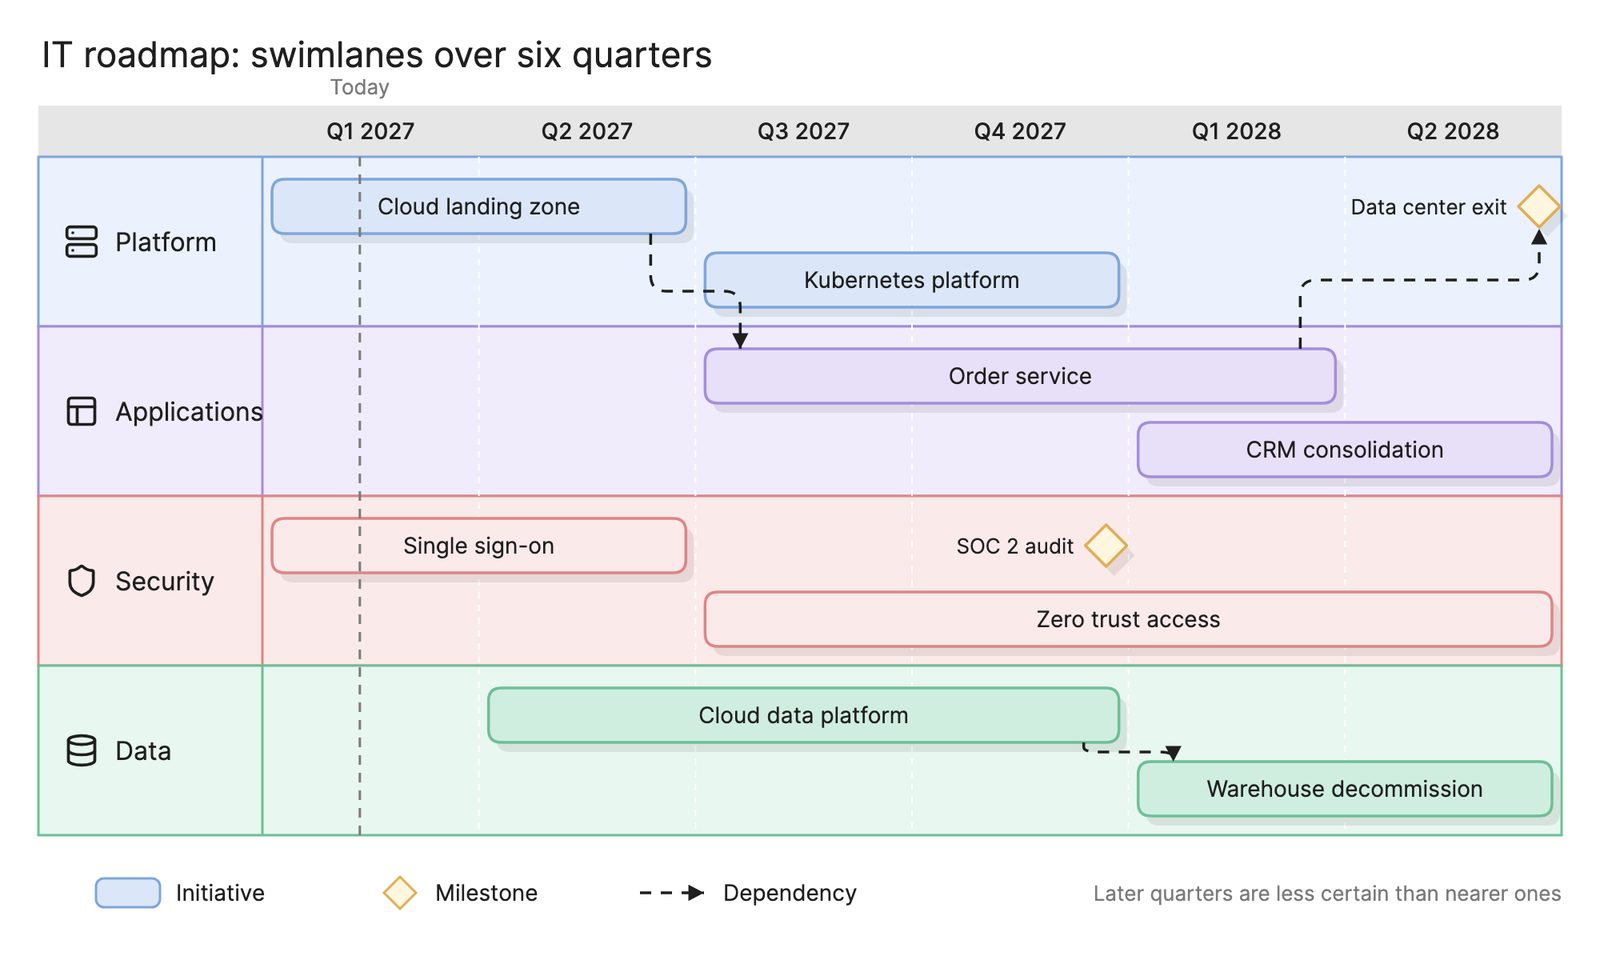
- Investment planning. Overlaying strategic importance on application fit finds the capabilities that matter most and are supported worst. Those become the IT roadmap the enterprise architect owns.
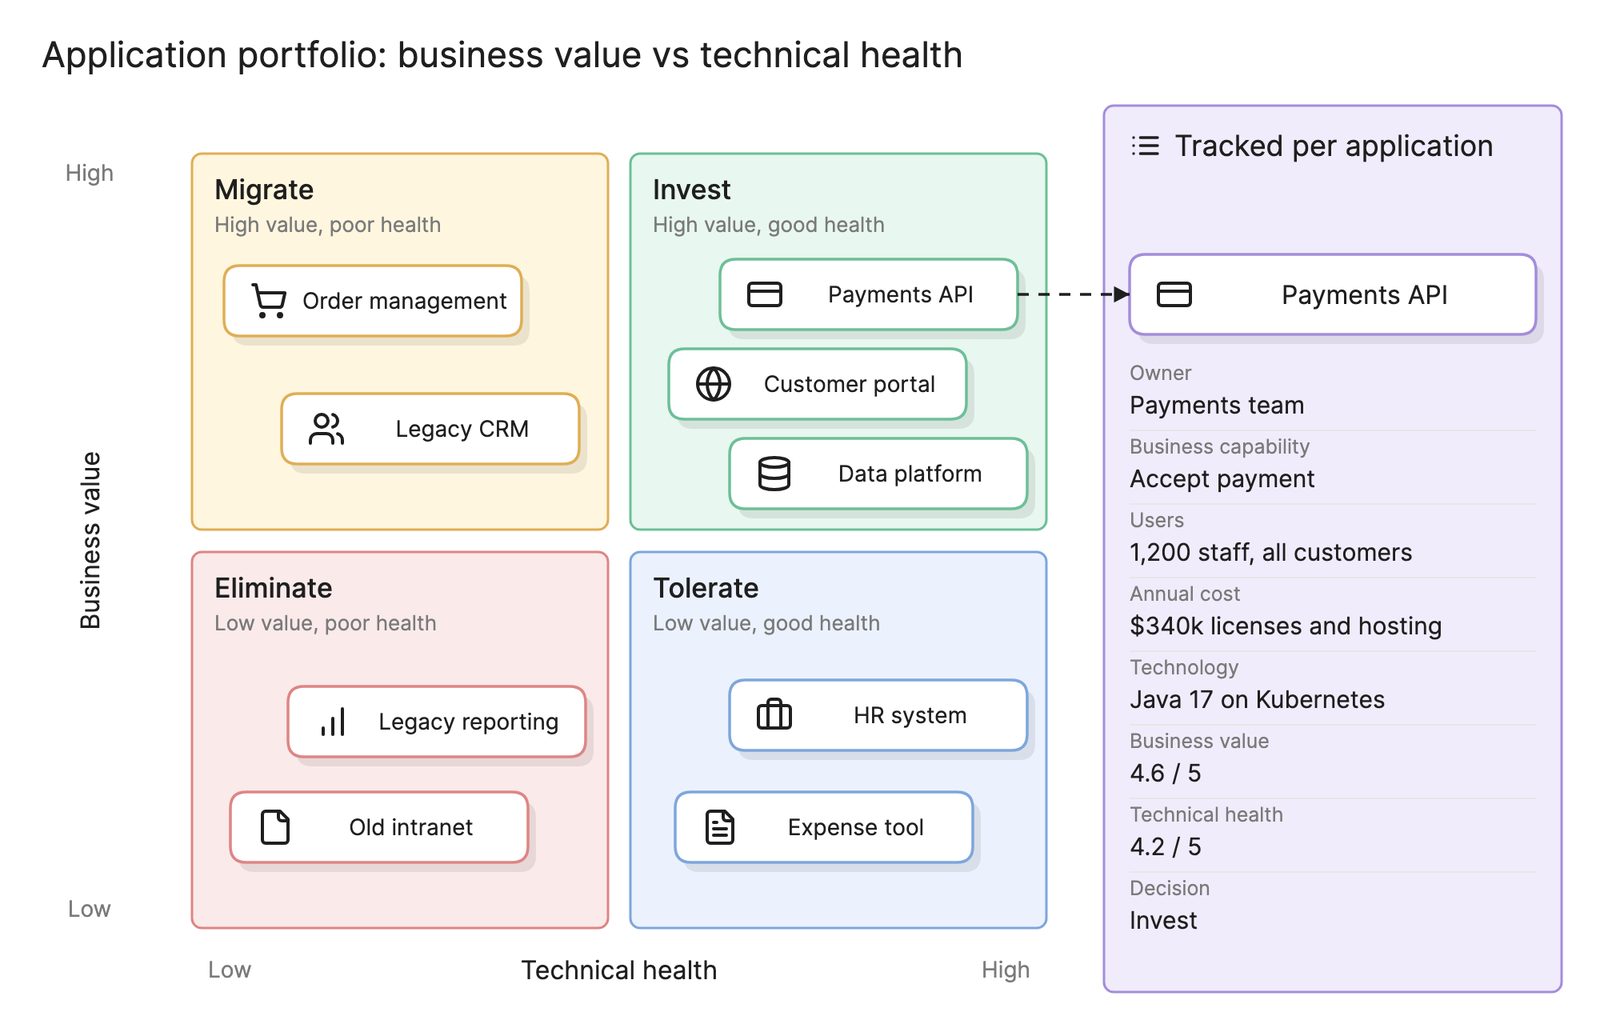
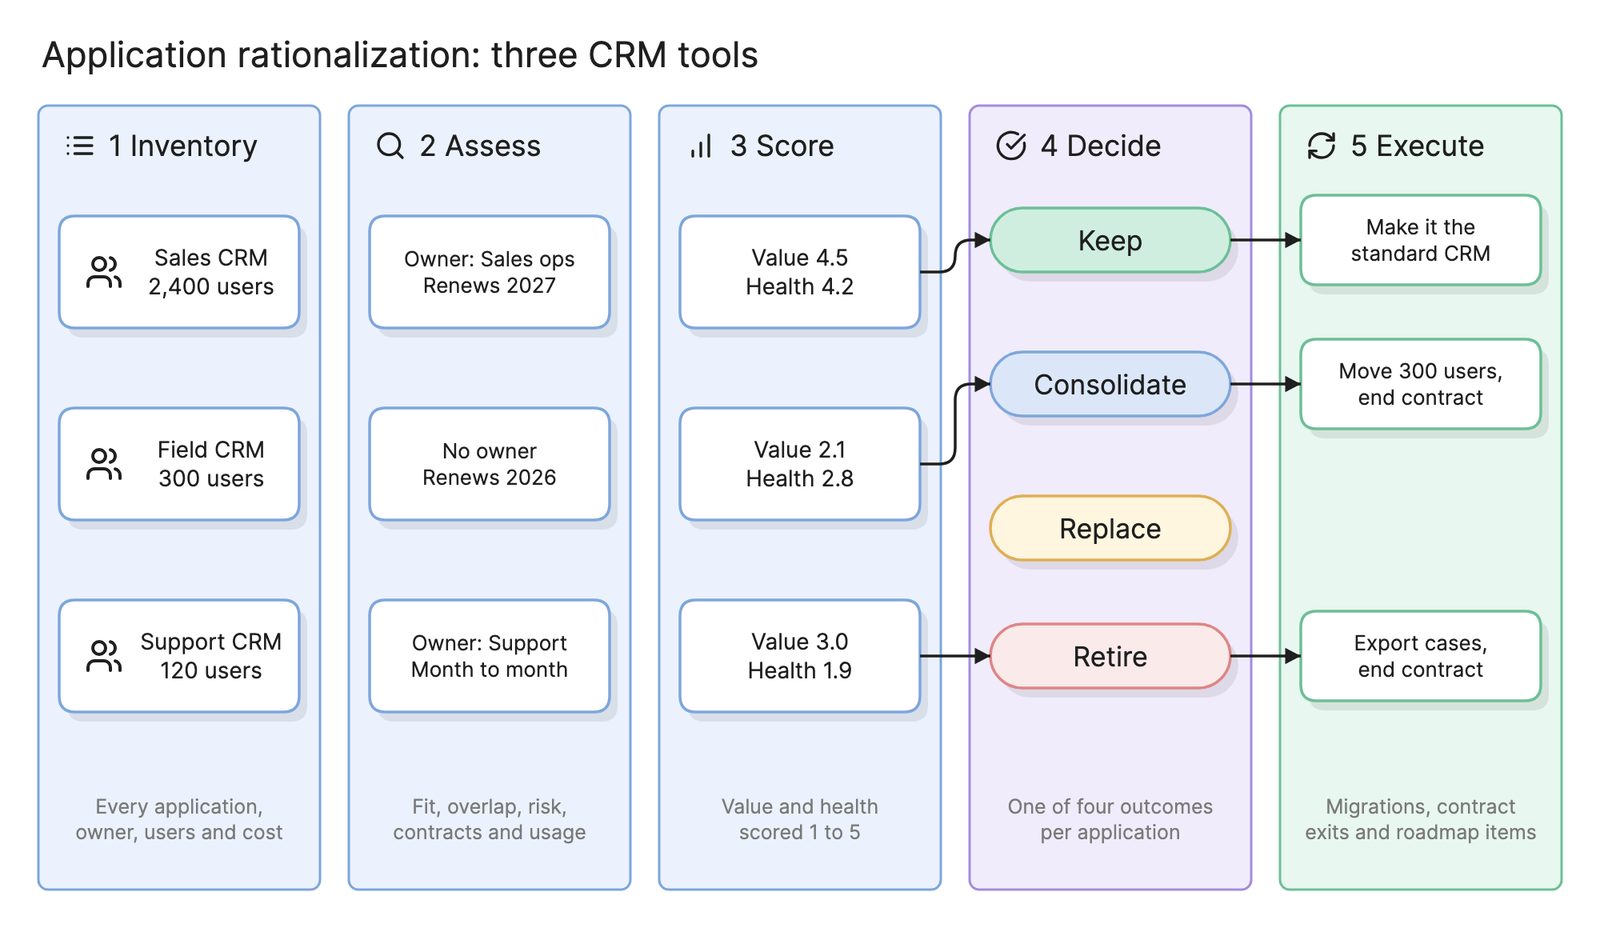
- Application portfolio management. Mapping every application to the capabilities it supports is the core step of application portfolio management. Cells with four applications are the starting point for application rationalization, and a design that adds a fifth is what an architecture review board exists to catch.
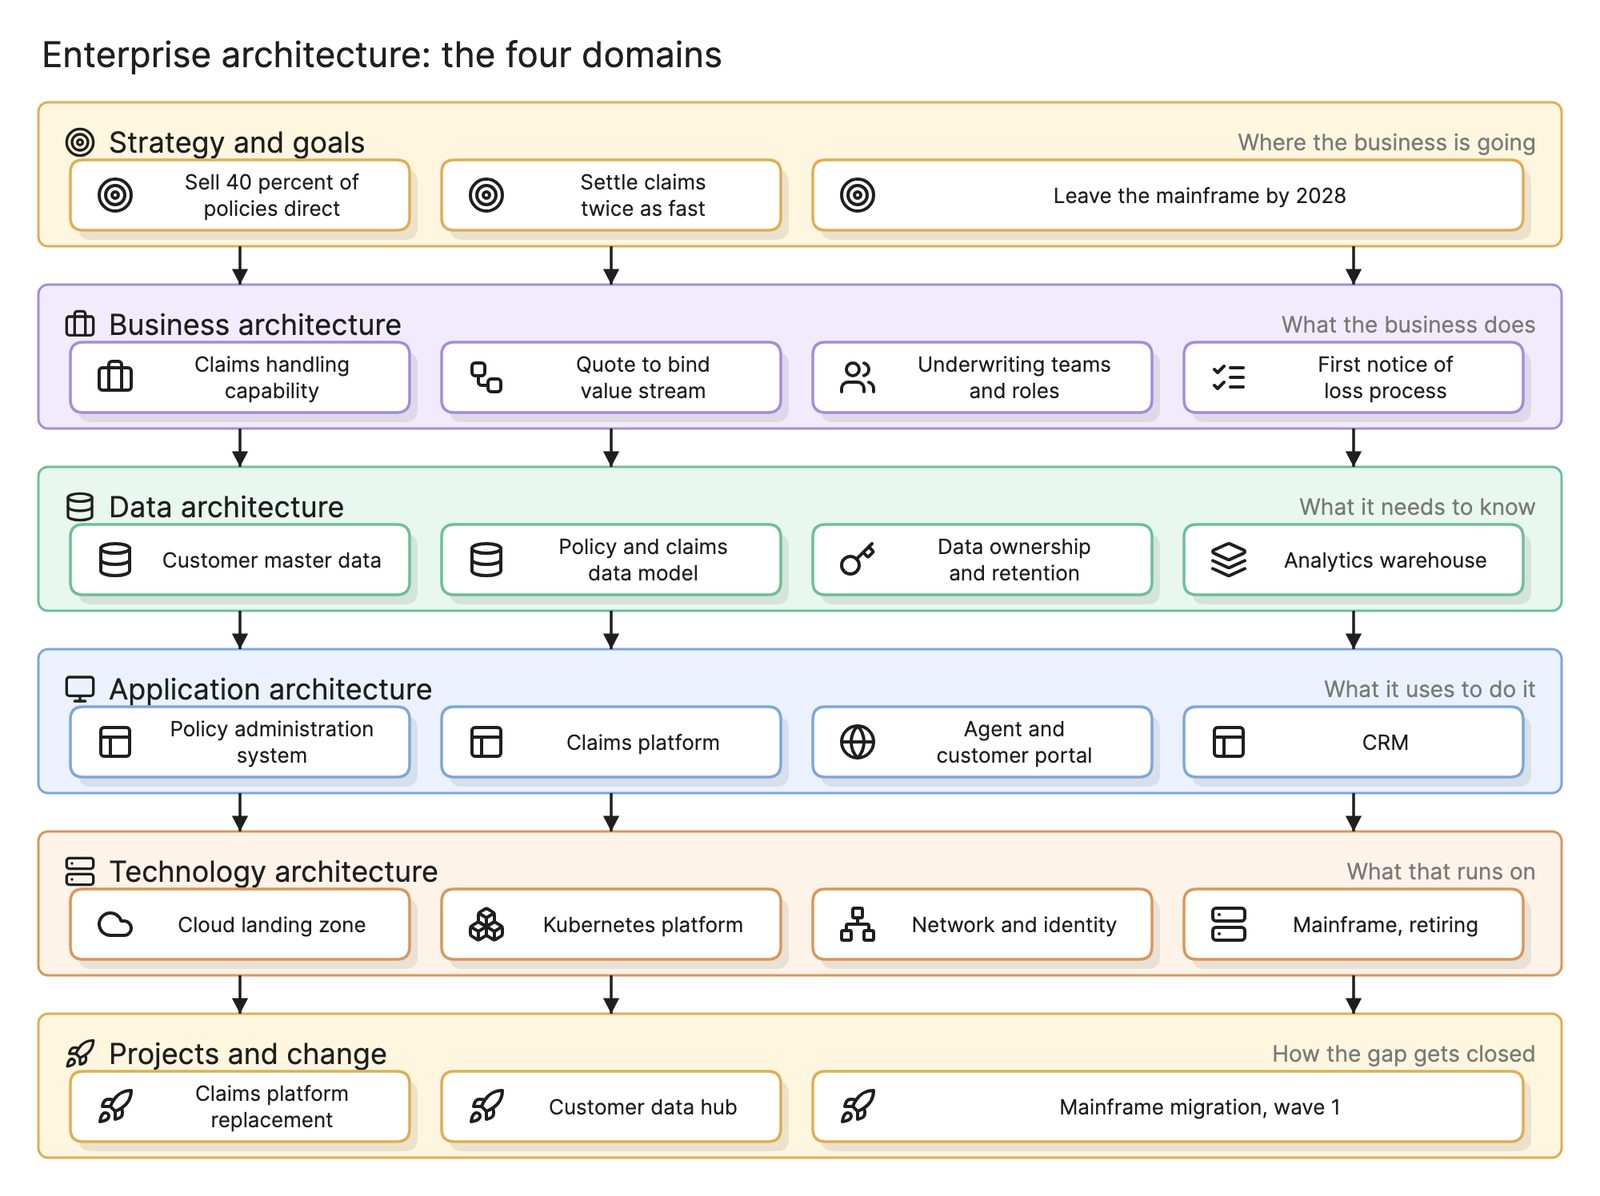
- Target state and transition. The target architecture is often the same map with a different heat: which capabilities will run on which platform in three years. See current vs future state architecture, or phase B of TOGAF.
- Impact analysis. When a capability’s applications are known and their infrastructure is in the CMDB, an outage or a change can be traced up to the capability it affects.
How do you build a business capability map?
- Start from a reference model for your industry if one exists.
- Run workshops with business leaders, not with IT, and push back on answers that name a department, a process or a system.
- Fix level 1 first. Six to twelve capabilities that cover everything with no overlaps.
- Fill in level 2 with five to eight children each, and define each capability in one sentence so two people mapping applications to it make the same call.
- Map the applications. Attach every application in the portfolio to the capabilities it supports. This is the step that makes the map useful.
- Add one heat layer for the decision at hand, agree the scoring with the people who will be judged by it and review yearly.
What are common capability map mistakes?
- Mapping the org chart. A map whose level 1 is the list of departments will be wrong at the next reorganization and encourages every department to defend its column.
- Naming applications or processes. “SAP” is not a capability and neither is “process a claim.” “Claims assessment” is.
- Heat with no scoring rules. Colors assigned by feel start arguments.
- No application mapping. A map with no applications attached is a poster, not a planning tool.
What tools help with a business capability map?
- EA repository tools. Dedicated platforms hold the capability hierarchy, the application mapping and several heat layers, and regenerate the map when the data changes.
- Spreadsheets and slides. Many first maps live in a spreadsheet, drawn as a slide for executives. It works until the mapping needs to stay current.
- Connected architecture maps. Tools like Eraser maps draw the applications and infrastructure behind each capability from live sources such as a CMDB and cloud accounts, so the map’s lower layers stay current without a second inventory.
For more on this kind of diagram, see architecture diagrams.
Frequently asked questions
-
What is the difference between a business capability and a business function?
A function is an organizational unit, such as the finance department. A capability is something the business can do, such as billing and collections, regardless of which department, process or system does it. Capabilities often cross functions: claims payment involves the claims team, finance and a payments platform. Mapping capabilities keeps the map stable through reorganizations.
-
How many capabilities should a capability map have?
At level one, between six and twelve for most organizations; more than that and the map stops fitting on a page. Level two usually runs to forty to eighty in total. If a level one capability has more than about eight children, it is probably two capabilities.
-
Are there standard capability maps by industry?
Yes. Industry bodies and vendors publish reference models for banking, insurance, telecommunications, retail, utilities and others, and the common ones share most of their level one capabilities. Expect to rename and reorganize a third of it to match how your organization talks about its work.
-
Is a capability map the same as a value stream map?
No. A value stream shows the sequence of stages that deliver value to a customer, such as quote, bind, issue and service for a policy. A capability map is a hierarchy of what the business can do, with no sequence. The two are often used together, with each value stream stage mapped to the capabilities it uses.