IT management
Current vs future state architecture
Current vs future state architecture compares the systems an organization runs today with the target it is moving toward, so the gap can be planned.
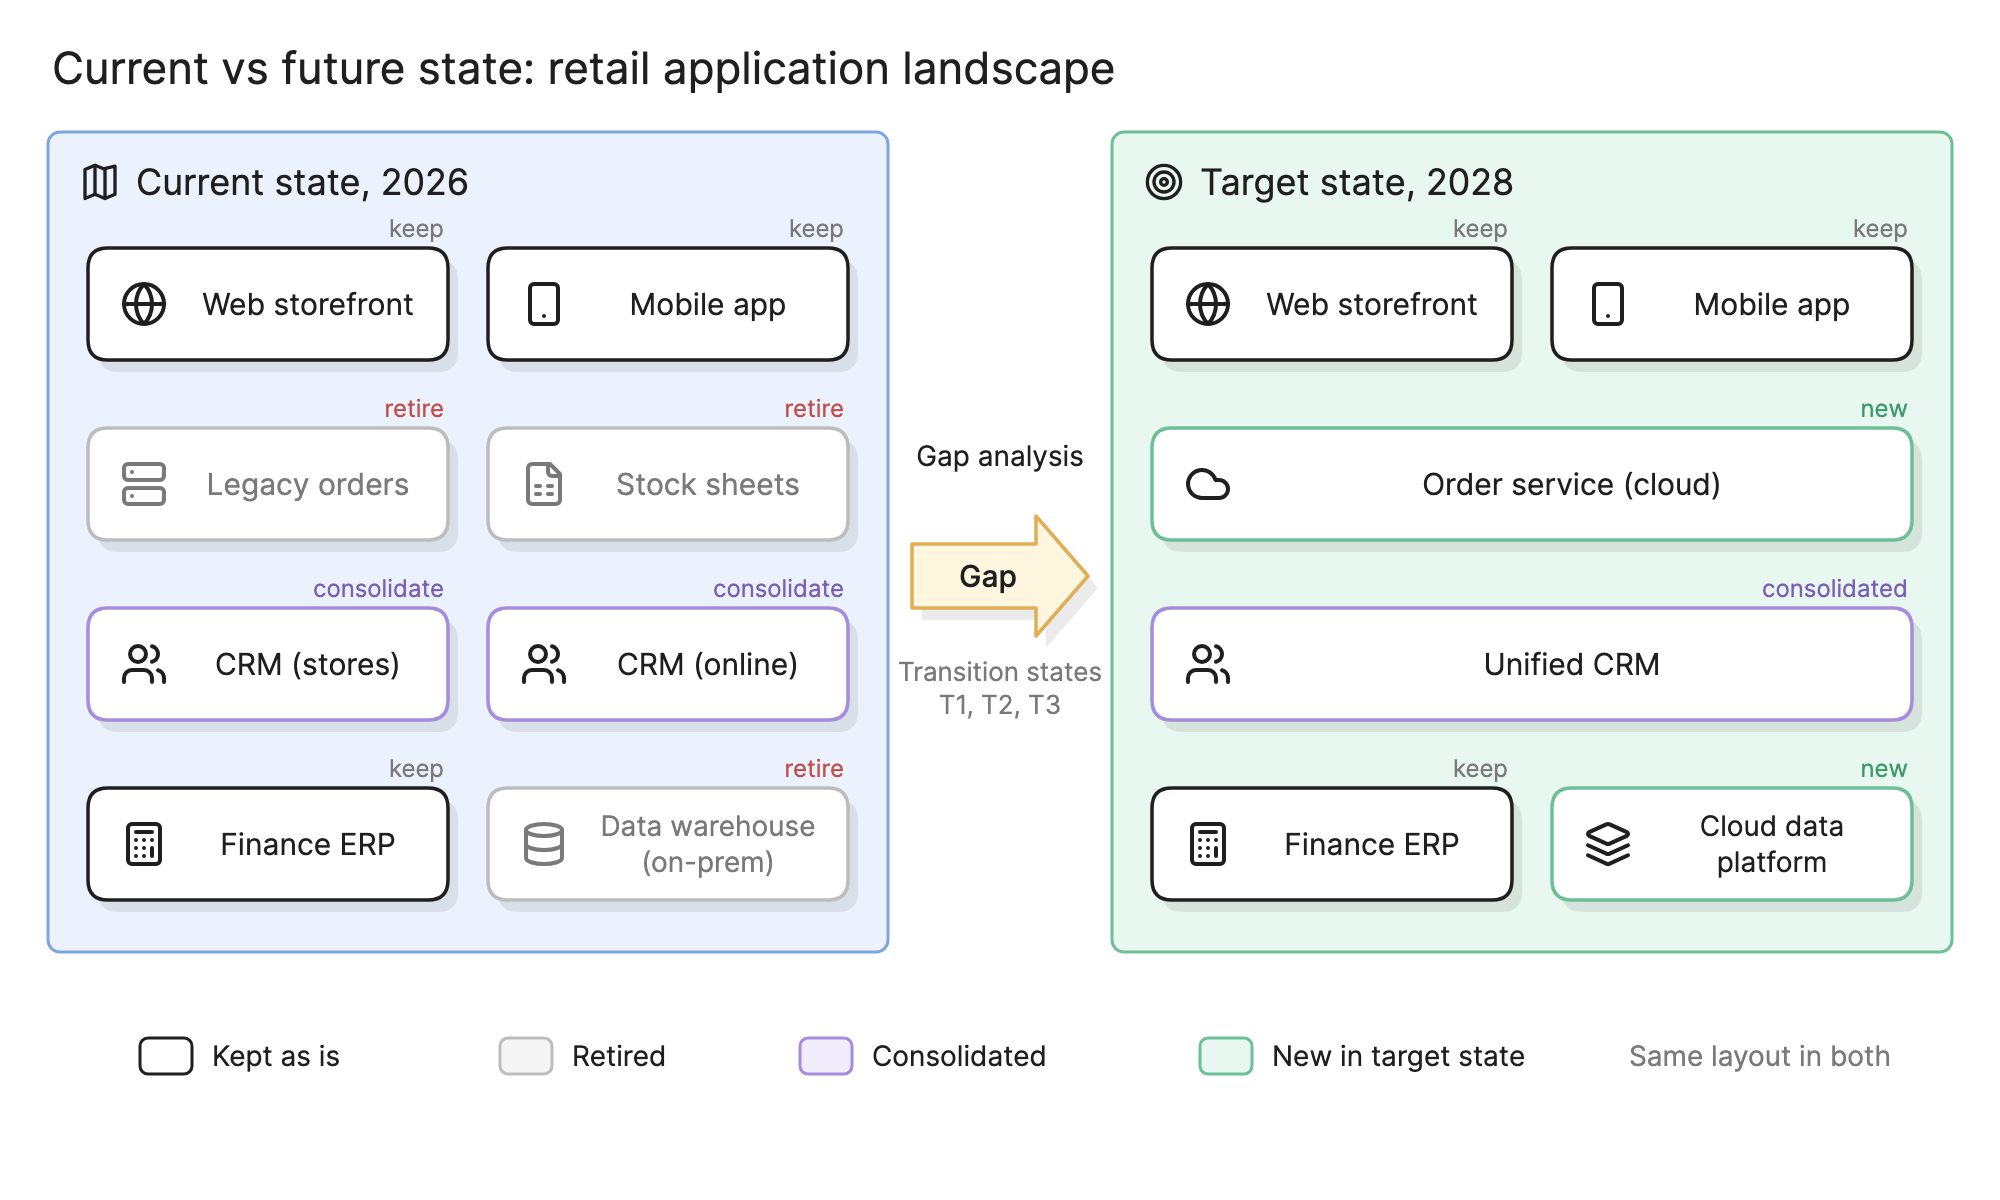
Teams draw current and future state architecture because a target on its own is a wish and a current state on its own is an inventory. Side by side, the difference becomes a list of work with an order, a cost and an owner.
Why draw both states?
- The gap is the plan. Every retired, new or consolidated system in the comparison is an initiative on the IT roadmap.
- It makes trade-offs visible. Stakeholders who would agree to “modernize the order platform” react differently when they see the legacy order system grayed out and the integrations that depend on it.
- It gives enterprise architecture a shared picture. Portfolio reviews, capability planning and application rationalization start from the same pair of diagrams.
How do you capture the current state honestly?
- Start from data, not memory. Pull applications from the application portfolio, infrastructure and dependencies from the CMDB and cloud accounts and owned hardware and licenses from IT asset management.
- Draw what runs, including the embarrassing parts. The spreadsheet that holds stock levels, the second CRM the online team bought, the warehouse nobody admits to still querying. Leaving them out makes the gap look smaller than it is.
- Record the technical debt. Mark the systems that work but cannot change. They are often the first things the target replaces.
- Pick one level of detail. An application landscape, a capability map or an infrastructure view, not all three in one picture. Use the same level for the target.
How do you define the target state?
The target state is designed, not discovered. It answers “what should we run in two or three years to support the business strategy?”
- Start from business capabilities. A business capability map shows which capabilities need to improve.
- Set principles before systems. “One system of record per data domain” is the kind of rule the target follows. An architecture review board usually ratifies them.
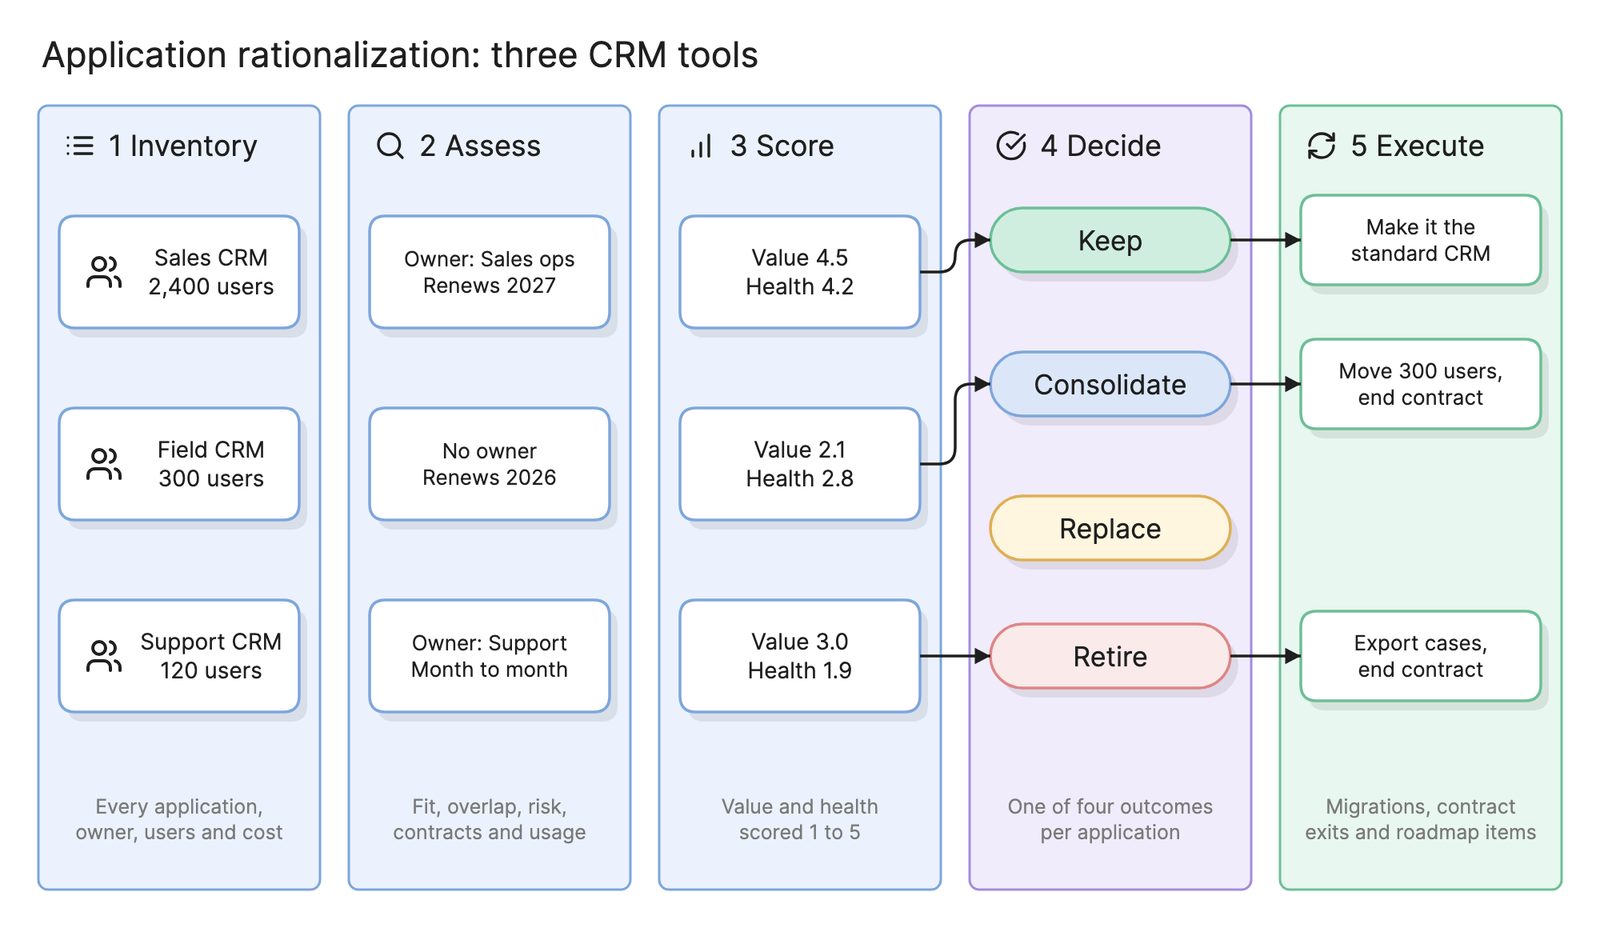
- Decide the fate of every current system. Each one is kept, retired, replaced or consolidated. A system with no decision is a hole in the target.
- Keep the same layout. Draw the target on the same grid as the current state, so a reader’s eye finds the same row and sees what changed.
- Put new kinds of system through their own gates. New AI systems, for example, pass AI governance intake before they are drawn as approved.
What is gap analysis?
Gap analysis is the systematic comparison of the two diagrams. For every element it asks what is different and what closing the difference will take.
| Gap type | Example from the diagram | What closing it involves |
|---|---|---|
| Retire | Legacy orders, stock sheets, on-prem warehouse | Data migration, contract exit, parallel run, decommission |
| New | Cloud order service, cloud data platform | Build or buy, integration, cutover, a new operating model |
| Consolidate | Two CRMs into one | Data reconciliation, process alignment, one team losing its tool |
| Keep | Web storefront, mobile app, finance ERP | Nothing today, but new integrations to the systems around them |
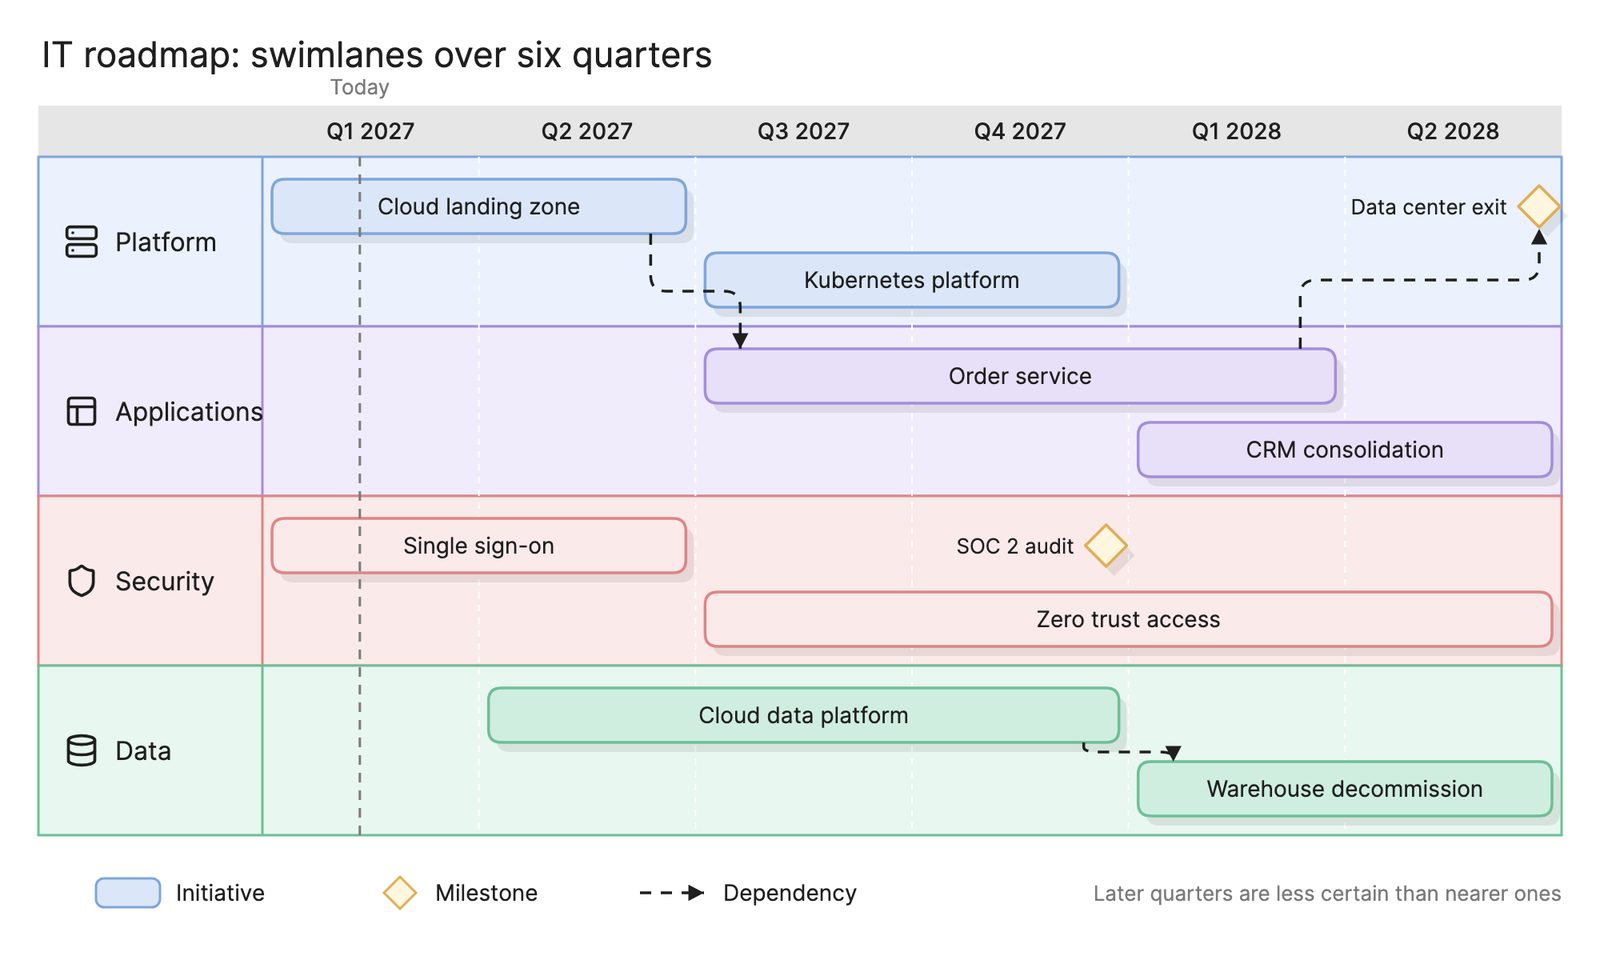
The output is a list of initiatives with dependencies between them, and that list sequenced over time is the IT roadmap.
What are transition states?
Few organizations jump from current to target in one move. Between the two sit transition states, each an architecture the organization will actually run for months. In the example, T1 has the cloud data platform live but fed from the old warehouse. T2 has the order service taking new orders while the legacy system still handles returns, and the store CRM migrated while the online one waits. T3 is the target. Each deserves its own diagram when the program is large.
How do you read the diagram?
The diagram at the top of this page shows a retail application landscape in 2026 and its target for 2028.
- Row one, channels. The web storefront and mobile app are kept and appear unchanged on both sides.
- Row two, orders. The legacy order system and the stock spreadsheets are grayed on the left and tagged “retire”. On the right a single cloud order service replaces both, highlighted as new.
- Row three, customers. Two CRMs, one for stores and one for online, are tagged “consolidate” and become one unified CRM.
- Row four, finance and data. The finance ERP is kept. The on-prem warehouse is retired and a cloud data platform takes its place.
- The middle. The block arrow is the gap, with its three transition states noted below it.
How do you keep the two diagrams in sync?
- Redraw the current state on a schedule. Quarterly is typical. Better still, generate it from the CMDB, cloud accounts and portfolio data so it redraws itself.
- Version the target. When the strategy changes, publish a new target with a date and keep the old one. The roadmap should point at a specific version.
- Mark progress on the comparison. As initiatives land, the current state moves toward the target. If it does not, the roadmap is fiction.
What are common current vs future state mistakes?
- A flattering current state. Leaving out workarounds and shadow systems makes the gap look small and the program under-funded.
- A target with no dates or owners. Without them, the target is a slide and not an architecture.
- No transition states. The program then discovers parallel runs and bridge integrations when it has to pay for them.
What tools help with current and future state architecture?
- Enterprise architecture platforms. They hold the application portfolio and can tag each application with a lifecycle status, which gives a reportable gap.
- General diagramming tools. Two hand-drawn architecture diagrams on one page are the most common form and the most readable. They go stale as soon as the current state changes.
- AI diagramming tools. Tools like Eraser draw the current state from live sources such as a CMDB and cloud accounts, and architects design the target beside it. See Eraser for enterprise architects.
For more on this kind of diagram, see architecture diagrams.
Frequently asked questions
-
What is the difference between current state and future state architecture?
The current state is the architecture as it exists today, verified against real data. The future state, also called the target state, is the architecture the organization intends to have at a chosen date. The difference between them is the gap, and closing it is the work an IT roadmap schedules.
-
How far ahead should the future state be?
Two to three years is common. Closer than that and the target is just the next release. Further out and the business and the technology both change too much for the picture to hold. Many teams draw a long-range target lightly and one or two nearer transition states in full detail.
-
What is a transition state?
A transition state is an intermediate architecture between current and target that the organization will actually run for a while, such as the point where a new order service is live but the legacy system still handles returns. Drawing them shows which parallel runs and temporary integrations the program must fund.
-
Who owns the current and future state diagrams?
Enterprise architecture usually owns both, with the current state kept accurate by the teams and tools that know the real systems and the target agreed through an architecture review board. Ownership matters because a target nobody owns drifts into a wish list and a current state nobody owns goes stale.