Guide
How to generate an AI agent architecture diagram from your code
Connect the repository that holds your agent, ask for its architecture diagram, and check it for model calls, tools, memory, approvals and data leaving.
An agent is quick to demo and slow to explain. A security reviewer asks which model receives what data. A new engineer asks which tools can change something without approval. The answers are spread across a graph definition and a folder of tool functions, and the whiteboard sketch stopped matching them a while ago.
This guide starts from the code. You connect the repository that holds the agent, ask Eraser for the AI agent architecture diagram, and check the result against a list of seven things. Plan on fifteen minutes, most of it checking. The steps are the same for one agent or several.
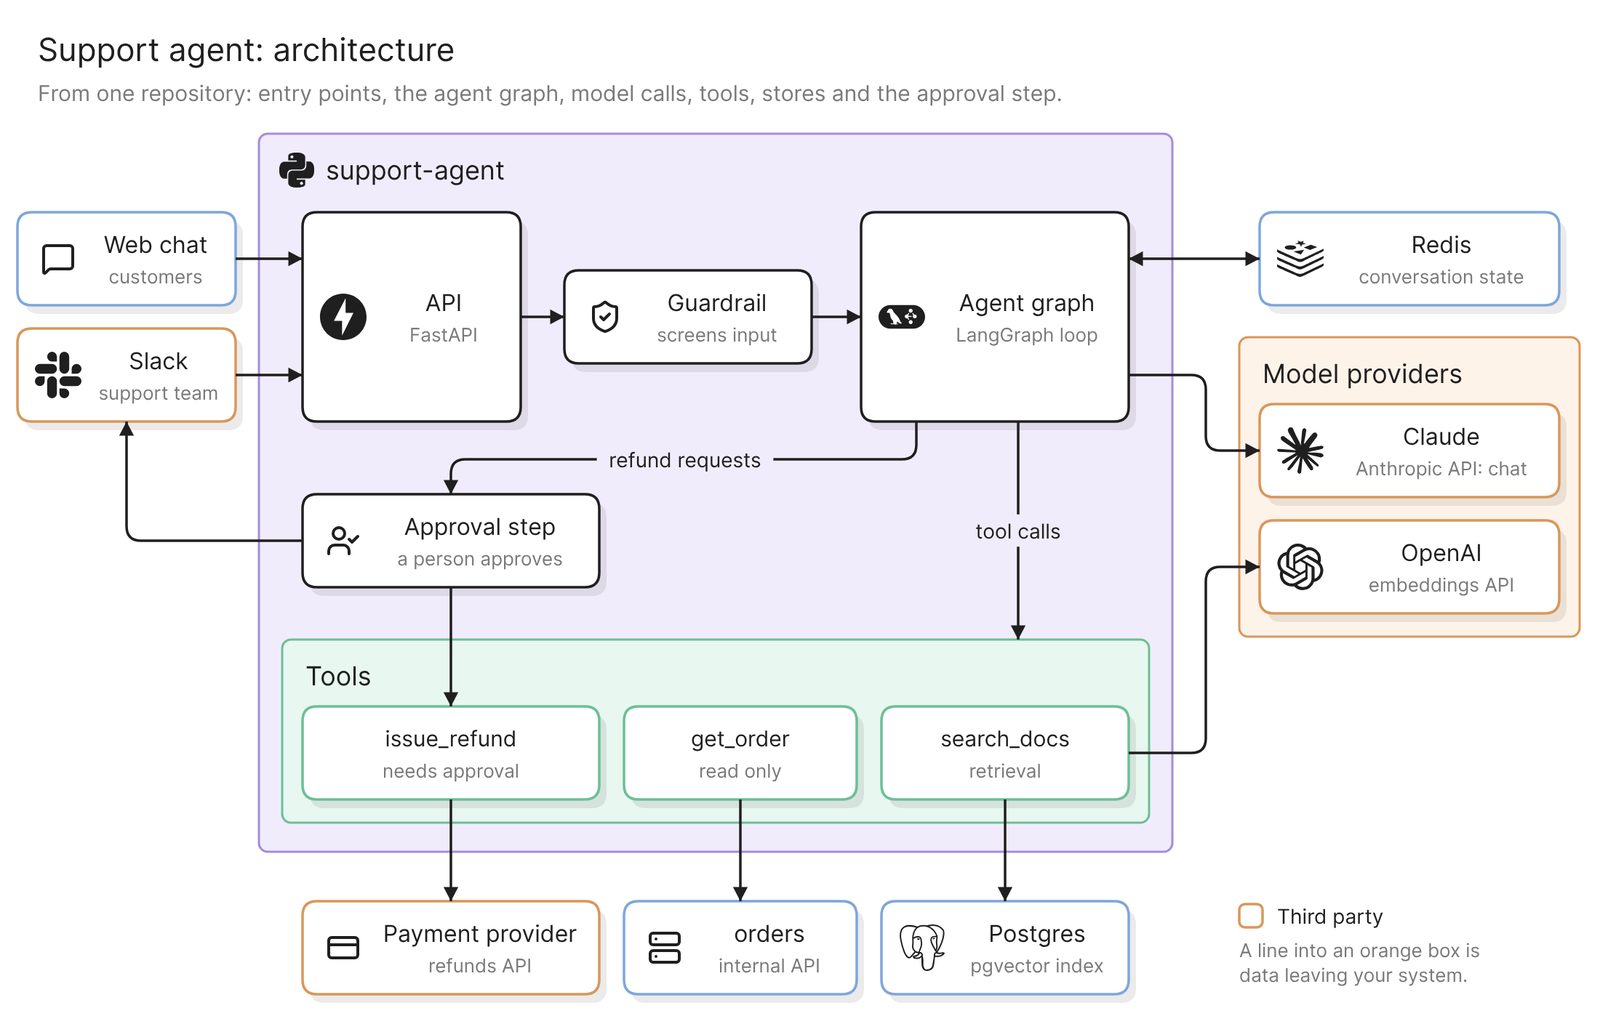 Example: a support agent for an online store
Before you start
You need two things:
- Access to Eraser
- Access to the repository that holds the agent’s code. A public repository needs no connection
Eraser reads the files in that repository: the orchestration code, the tool functions, the model clients and the config. It does not see prompts stored in another system, runtime traces, or which tools were called in production. Treat the result as a map of what the code allows.
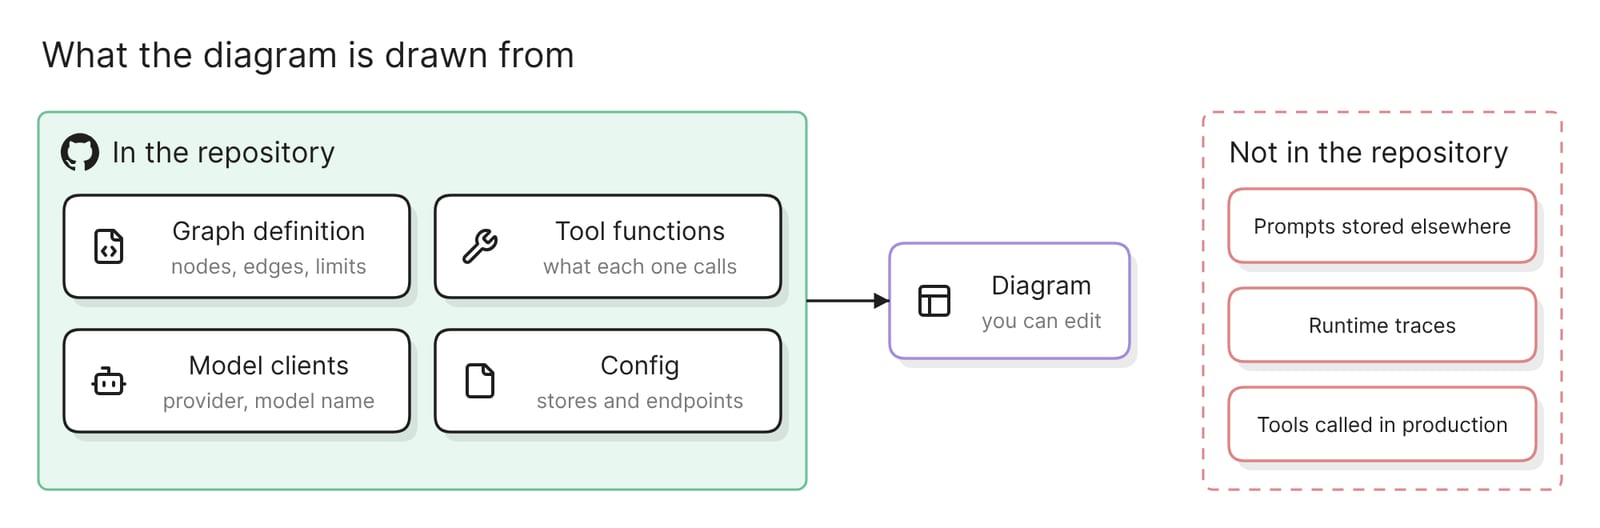 What a repository can tell a diagram, and what it cannot
Step 1. Connect the repository
For a private GitHub repository, you install the Eraser GitHub App and choose which repositories it can read. GitLab and Azure DevOps repositories connect with an access token instead. The docs have the steps for each.
Connect the repository the agent is deployed from. Eraser cannot see services that live in other repositories, so a tool that calls one is as far as the diagram can follow.
Step 2. Ask for the architecture diagram
Start a new AI diagram, attach the repository, and name every part you want drawn:
Draw an architecture diagram of the AI agent in this repository. Show the
entry points, the orchestration loop or graph, every model call and its
provider, each tool and the system it touches, the memory and retrieval
stores, and any guardrail or human approval step.
The list matters. An agent’s repository also holds a web server, a deploy pipeline and tests, and a prompt that only says “architecture” leaves open which to draw.
Naming files helps too. Say where the graph and the tools live in a follow-up prompt:
Use agent/graph.py for the orchestration and agent/tools/ for the tools.
Group the diagram into entry points, the agent service, model providers,
data stores and external systems.
A LangGraph project is a good source. In LangGraph you define workflows as “graphs of shared state, nodes, and edges”, so the orchestration is already written down in one place.
The result is an ordinary diagram. Move, rename and regroup anything by hand, or keep prompting.
Step 3. Check it against the code
Go through the diagram with the person who knows the agent best. Seven things belong on it:
- Entry points. Every route, webhook, queue consumer and scheduled job that can start a run.
- Orchestration. The loop or graph that decides what happens next. For LangGraph, compare the boxes with the nodes the graph file adds.
- Model calls. Each place the code calls a model, with a line to its provider. Embedding calls count.
- Tools. Each tool and the system it reads or changes. A tool that writes should stand out from one that reads.
- Memory and retrieval. The store for conversation state, any long-term memory, and the index behind RAG.
- Guardrails and approvals. Where input is checked, and which actions wait for a person. In LangGraph, search for
interrupt, the function that pauses a graph to wait for outside input. - Data leaving the system. Every line that ends at a third party, whether a model provider, a SaaS tool or a tracing service.
Look hardest at the edges. A model provider or a SaaS tool shows up in code as an SDK import or a URL in a config file, which makes it the easiest thing for a read of the code to miss.
A weak result has a box called “LLM” and a box called “Tools”, and could describe any agent. Name the files and the missing part, and ask again.
More diagrams from the same repository
Each of these prompts asks for a different diagram of the same code.
One request through the tool-calling loop
Draw a sequence diagram of one refund request through the agent: the
user message, each model call, each tool call and its result, the
approval step and the final reply.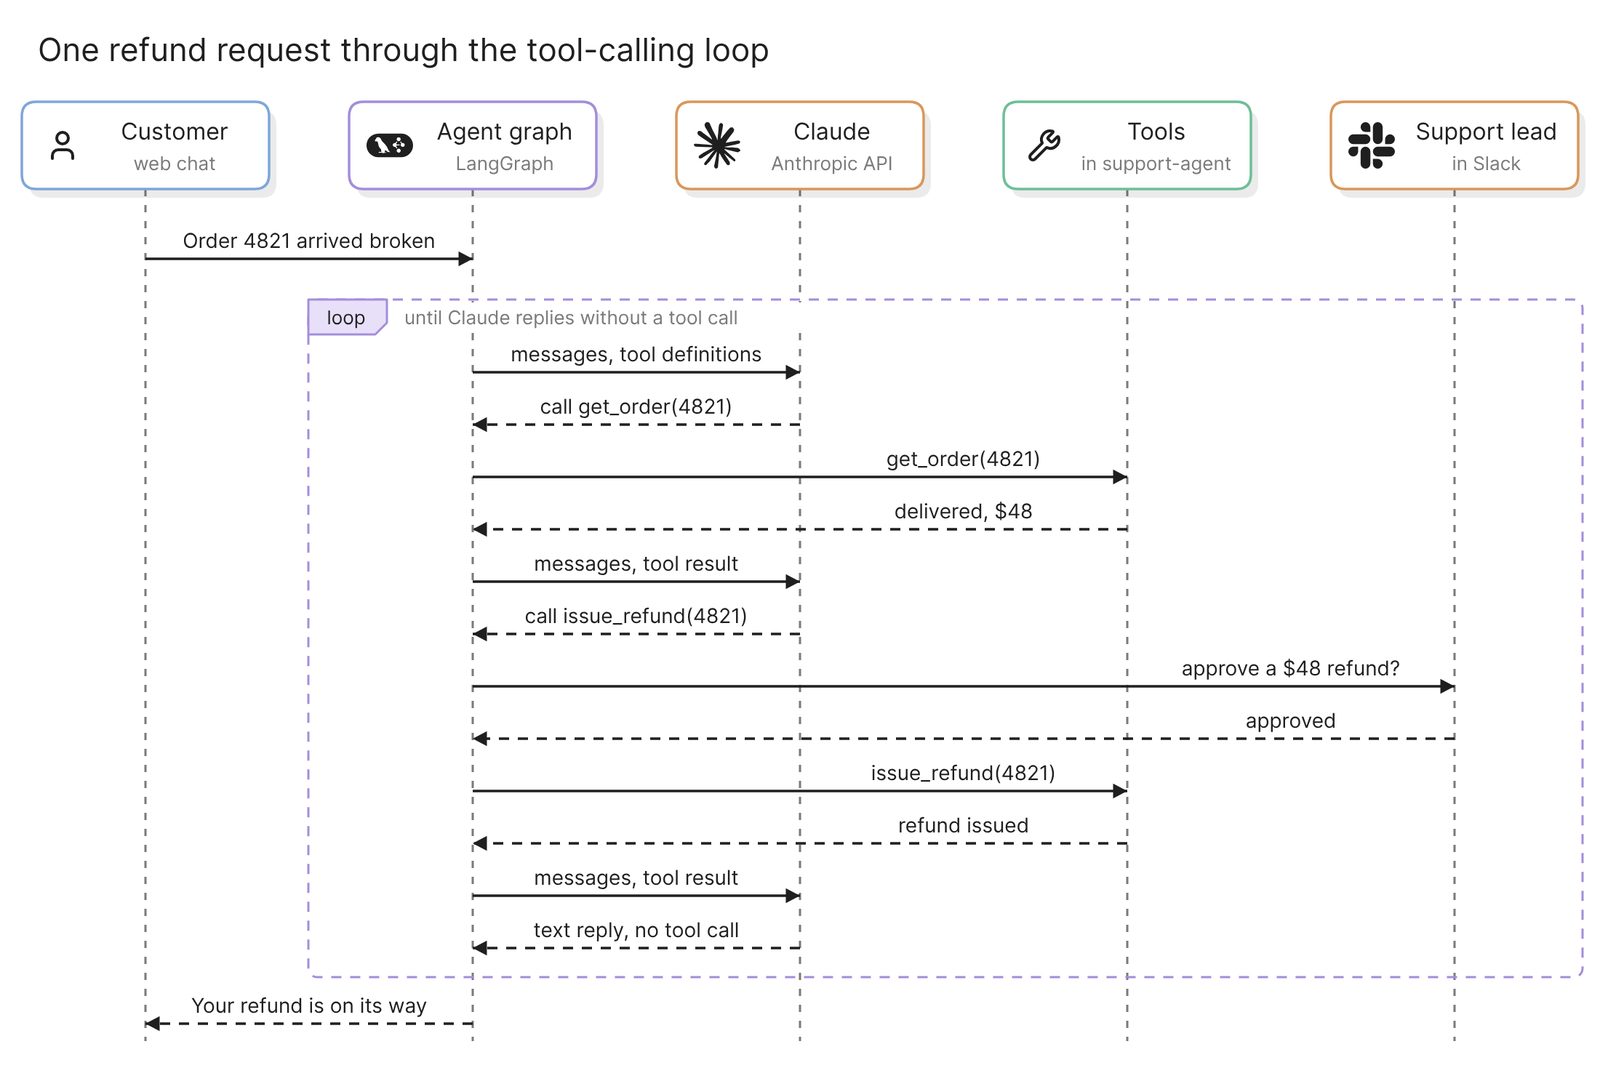 What happens when a customer asks for a refund
This is the diagram for onboarding. A sequence diagram puts the loop in order. The model is called again after every tool result, and the approval sits between the model’s request and the tool running. It shows the paths the code allows. A recorded run comes from a tracing tool.
Handoffs between agents
Draw the agents in this repository and the handoffs between them. For
each agent show its model and its tools. Label each handoff with the
condition that triggers it.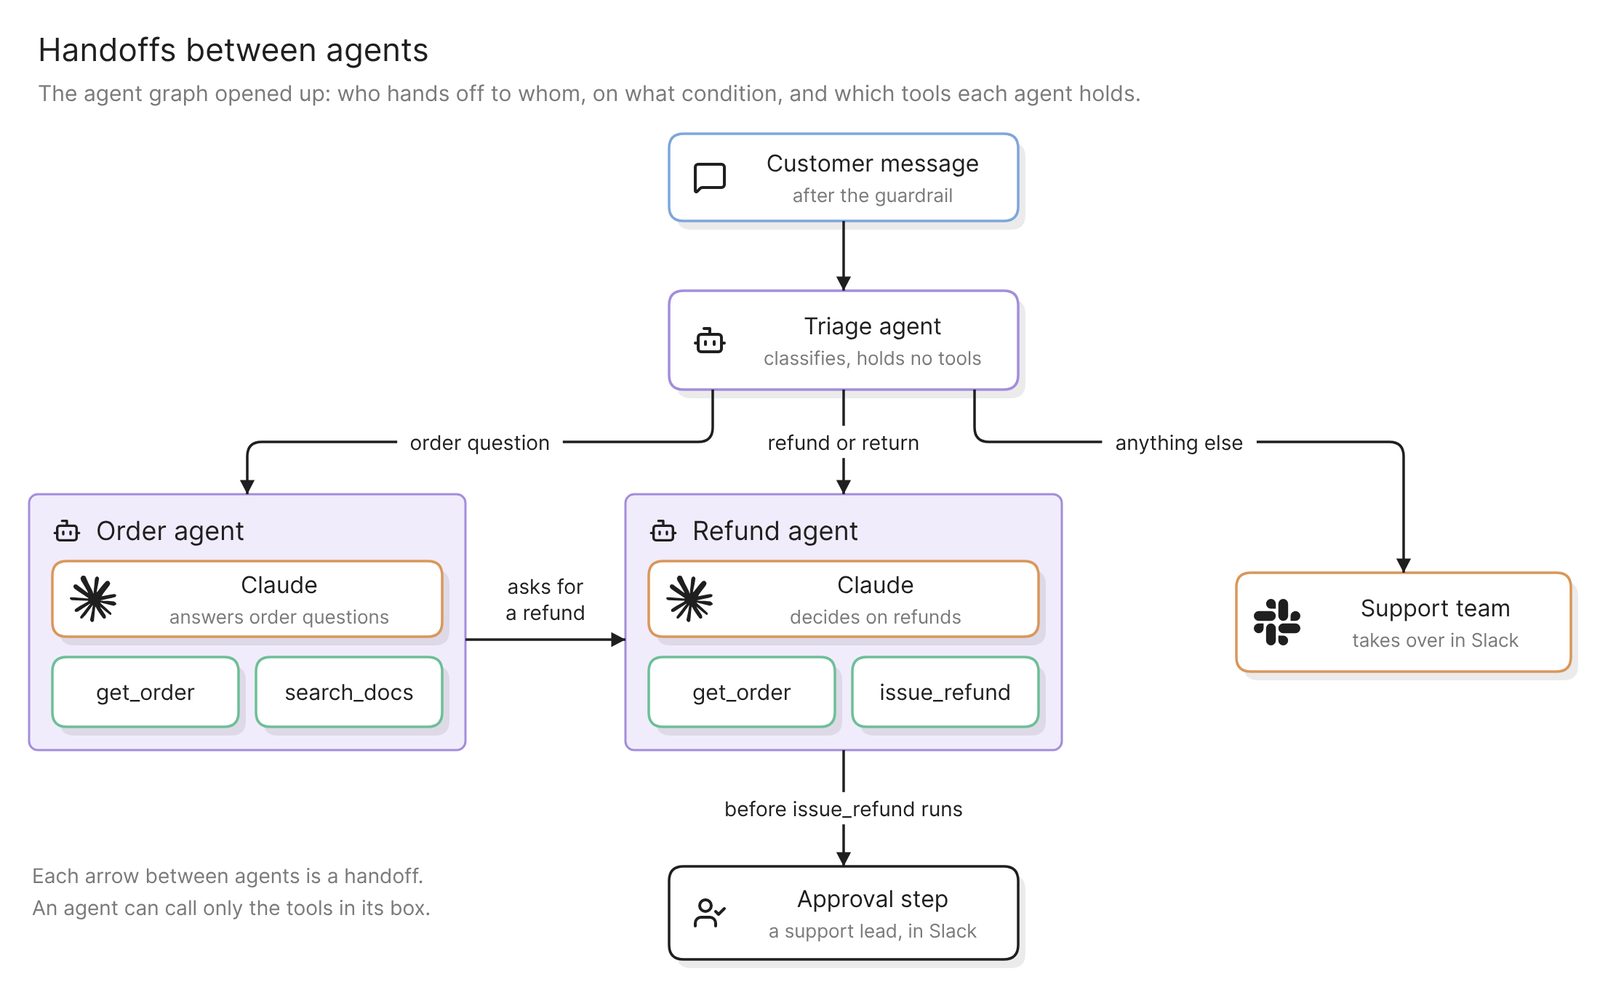 Example: each agent’s tools, and the condition on each handoff
For a multi-agent architecture, review this diagram before adding another agent. Check that each handoff has a condition and that no agent holds a tool its job does not need.
What data reaches which provider
Draw a data flow diagram for a security review. Show every place data
leaves our systems: model providers, third-party APIs and SaaS tools.
Label each flow with the data it carries and draw the trust boundary.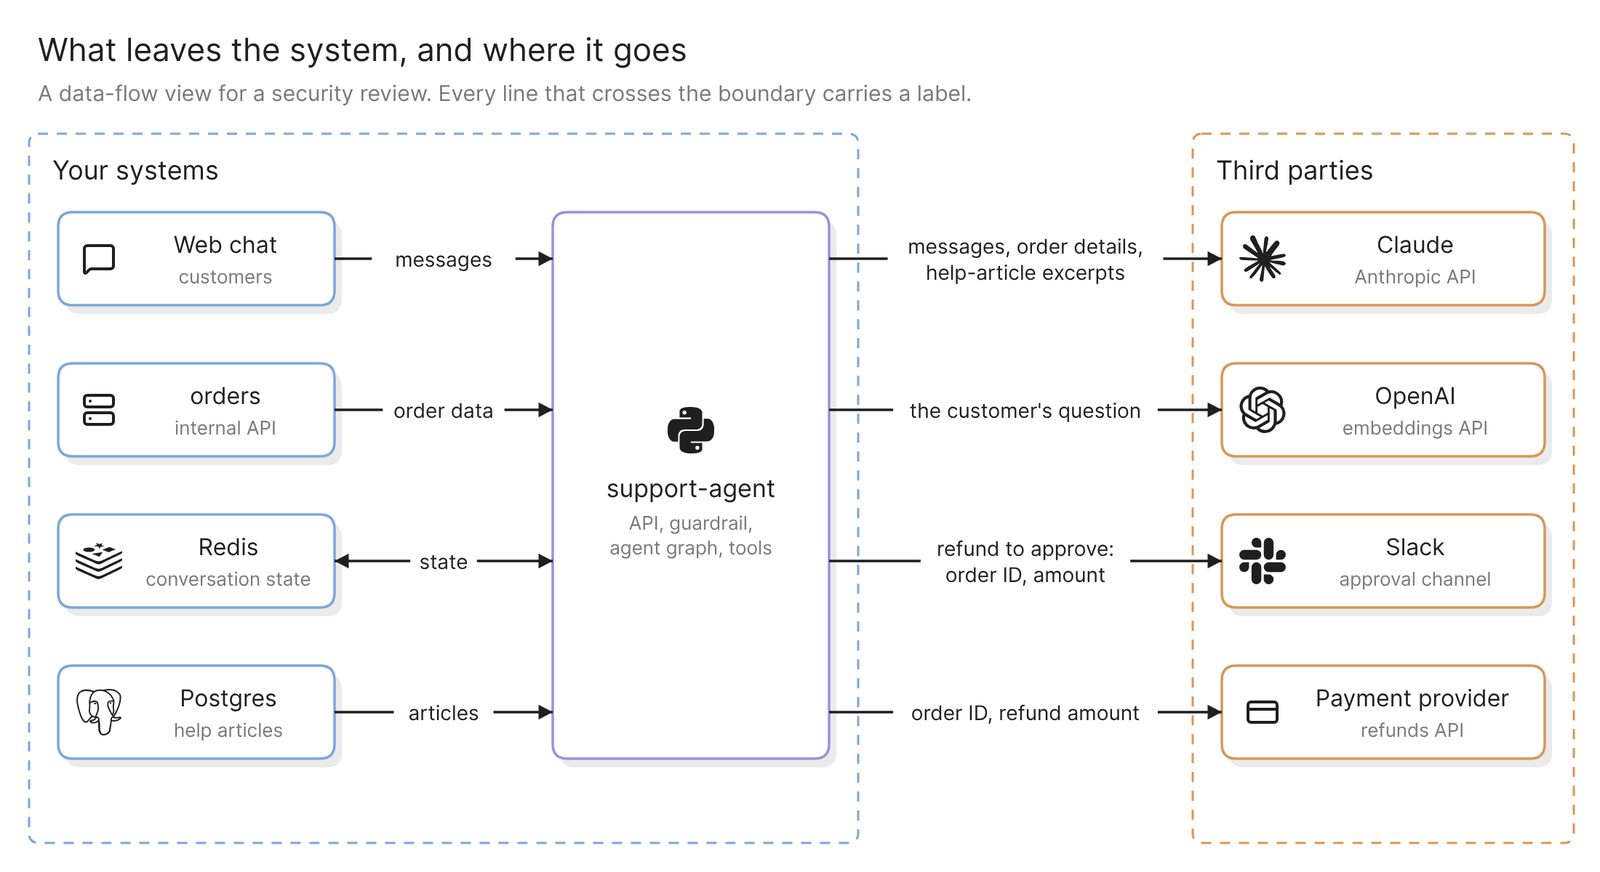 Example: every flow that crosses the boundary, labeled with what it carries
This is the diagram for a security review or a customer questionnaire. A data flow diagram of an agent answers what leaves your systems and who receives it. Check each label against the code that builds the request. It is also where threat modeling the agent starts.
Keep it current
An agent gains a tool one week and swaps a model the next. Eraserbot keeps the diagram in step. You give it a prompt and the files to watch, such as the graph file and the tools folder. When a pull request changes those files, Eraserbot redraws the diagram and posts it as a comment within a minute or two. The saved diagram updates on merge. It works with GitHub and GitLab.
A finished diagram can be shared with a link, exported as an image or a PDF, or embedded in your team’s docs. On GitHub you can also commit the diagram file to the repository.
Other ways to diagram an AI agent
- Let the framework draw its own graph. As of November 2026, LangGraph documents
draw_mermaid()anddraw_mermaid_png(), and the OpenAI Agents SDK hasdraw_graphfor agents, tools and handoffs. Use them to check that the graph you wired is the graph you meant. They draw the graph only, with no data stores and nothing about what a tool touches. - Read the traces. In LangSmith, a trace is “a collection of runs for a single operation”, and Langfuse is an open-source option. This is how you find out which tools ran in production. A trace covers one run, so the paths that run did not take are missing.
- Ask your coding agent. Claude Code or Cursor can read the repository and draw through a diagramming MCP server, which suits a team that already works there. Drawing your codebase from Claude Code walks through it, and Best diagramming MCP servers in 2026 compares the servers. It reads the same code, so it has the same blind spots.
FAQ
Can LangGraph draw its own architecture diagram?
It can draw its graph. Per LangGraph’s docs, draw_mermaid() returns Mermaid syntax and draw_mermaid_png() renders an image, by default through the Mermaid.ink API. That covers nodes and edges. Providers, data stores and tool targets are outside it.
Does this work for a multi-agent architecture?
Yes. Ask for the agents and the handoffs between them, with each agent’s model and tools. Agents that live in another repository need a diagram of their own.
Does the diagram show which tools the agent used in production?
No. It shows the tools the code defines and what each one calls. Which tools ran, and how often, is in your traces.
What if our prompts are not in the repository?
Then Eraser does not read them. The model call is in the code, so it can still be drawn. Check what goes into the prompt wherever the prompts are kept.
Where to go next
If the agent is not built yet, the architecture diagram generator draws one from a description. The glossary’s AI agent architecture page covers the parts of an agent and the common patterns.
For reference diagrams, see the Generative AI Application Builder on AWS and an image recognition app using a vector database. For the system around the agent, see How to generate C4 diagrams from a GitHub repo.