Guide
How to build a business capability map from a spreadsheet
Upload your capability and application tables to Eraser as a file, then ask for the map in levels, the applications under each capability and a heat map.
The capability list usually lives in a spreadsheet, with one row per capability and a second tab for the applications that support each one. The business capability map people look at is a slide that someone draws from those rows and re-colors by hand before each planning cycle. The two drift apart, and the application to capability mapping rarely reaches the slide at all.
This guide draws the map from the rows. You upload the spreadsheet to Eraser as a file, Eraser builds a model from it, and you ask for the map and its overlays in plain words. Nothing connects Eraser to the workbook. The upload is a copy, so the map is as current as the last file you uploaded. Allow about half an hour the first time, most of it spent tidying the spreadsheet.
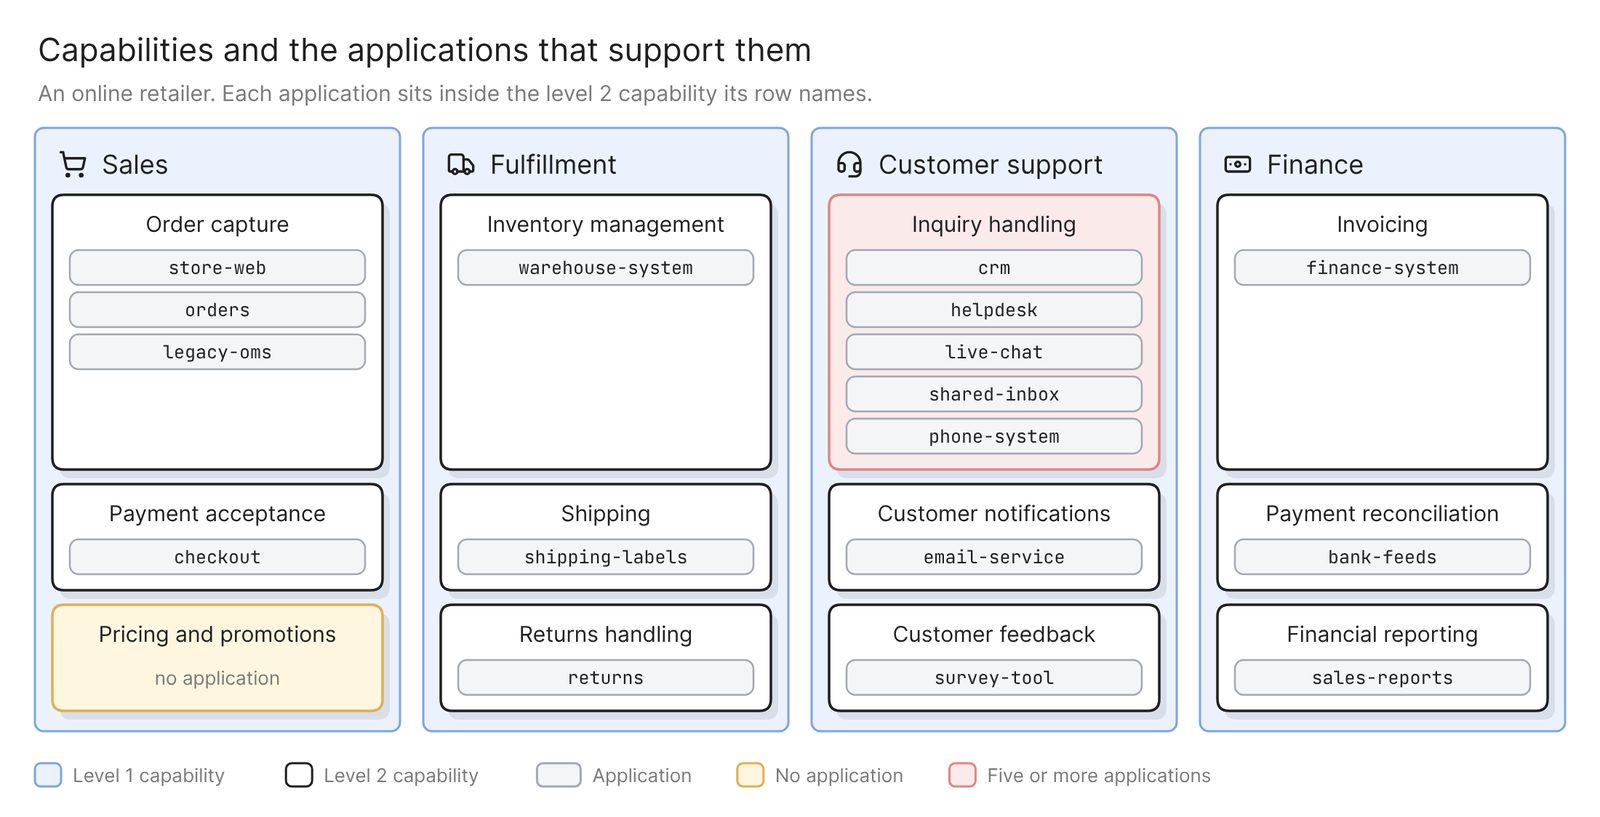 Example: a two-level capability map of an online retailer, with the applications that support each capability
Before you start
You need two things:
- Access to Eraser, and a team admin for the upload
- The spreadsheet that holds your business capability model, with a table of capabilities and a table of applications
Eraser reads what the file holds and nothing more, so a wrong parent in the spreadsheet is a wrong tile on the map. Secrets are left out when the file is read. Everything else goes into a model the whole team can use, so first delete any column that should stay private, such as contract values.
Step 1. Shape the spreadsheet
Eraser turns each table into a record type and each row into a record. A column that holds another record’s id becomes a link between the two. The map needs two tables. The first lists capabilities:
id,name,level,parent_id
sales,Sales,1,
order-capture,Order capture,2,sales
payment-acceptance,Payment acceptance,2,sales
parent_id holds the id of the capability one level up, and is empty at level 1. The second table lists the applications, with the capability each one supports and any column you want to color by:
id,name,capability_id,lifecycle,owner
app-01,orders,order-capture,active,commerce
app-02,legacy-oms,order-capture,end-of-life,commerce
app-03,checkout,payment-acceptance,active,payments
Check two things before you upload:
- Every row has an id that never changes. Eraser matches records by id when you replace the file later, so use a short code and never the row number.
- Every
parent_idandcapability_idmatches an id. A typo leaves a capability or an application with nowhere to go.
An application that supports several capabilities needs a third table with one row per pair, holding the application id in a source column and the capability id in a target column.
Eraser reads JSON, CSV, Excel, YAML and XML files of up to 10 MB. Keep each table on its own sheet, or in its own CSV file, and upload the CSV files together. From Google Sheets, download a copy as Excel or CSV.
Step 2. Upload it as a data source
A team admin adds the file as a data source, and Eraser builds a model from it, with a record for every capability and application and the links between them.
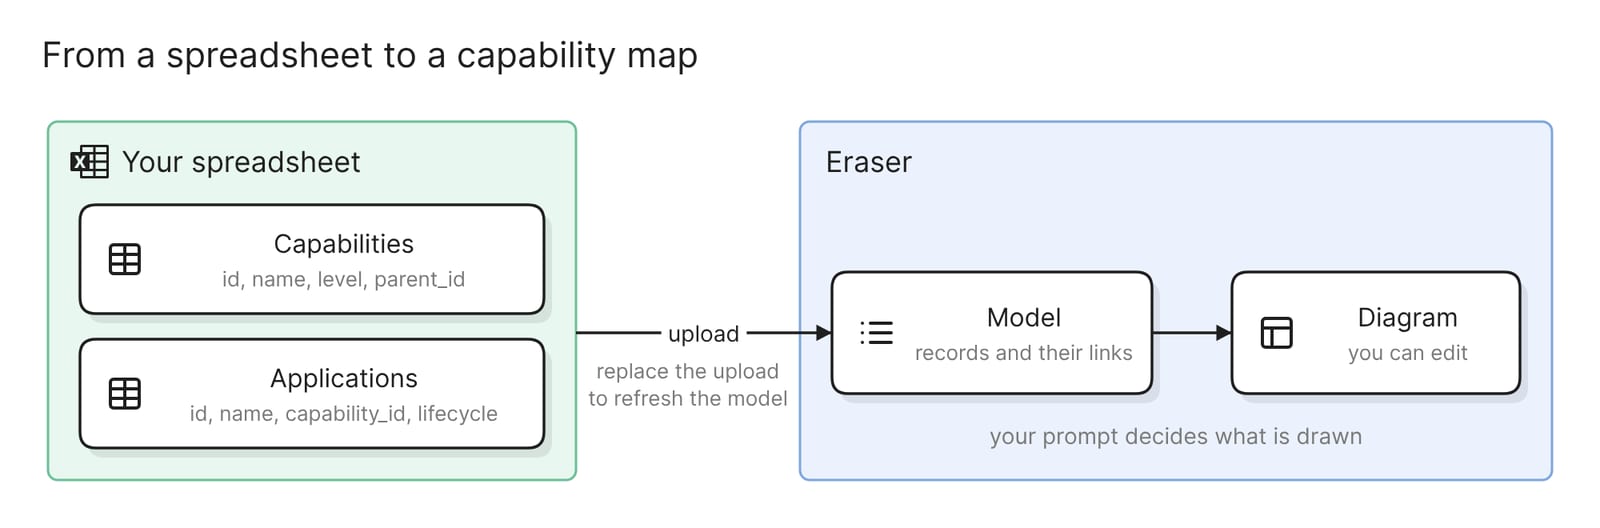 What the upload sets up
Open the model before you draw anything. Check that it holds as many records as the spreadsheet has rows, then open one application and confirm that it connects to its capability. If it does not, fix the spreadsheet first.
The docs have the click-by-click steps. Each format comes with an example file, and a prompt for reshaping an export with an AI assistant.
Step 3. Ask for the capability map
Open AI chat, attach the model, and ask for the levels alone:
Draw a business capability map from this model as a freeform diagram.
Make each level 1 capability a group, and put its level 2 capabilities
inside it as tiles, following parent_id. Draw no lines or arrows. Put
any capability whose parent is missing in a group named Unplaced.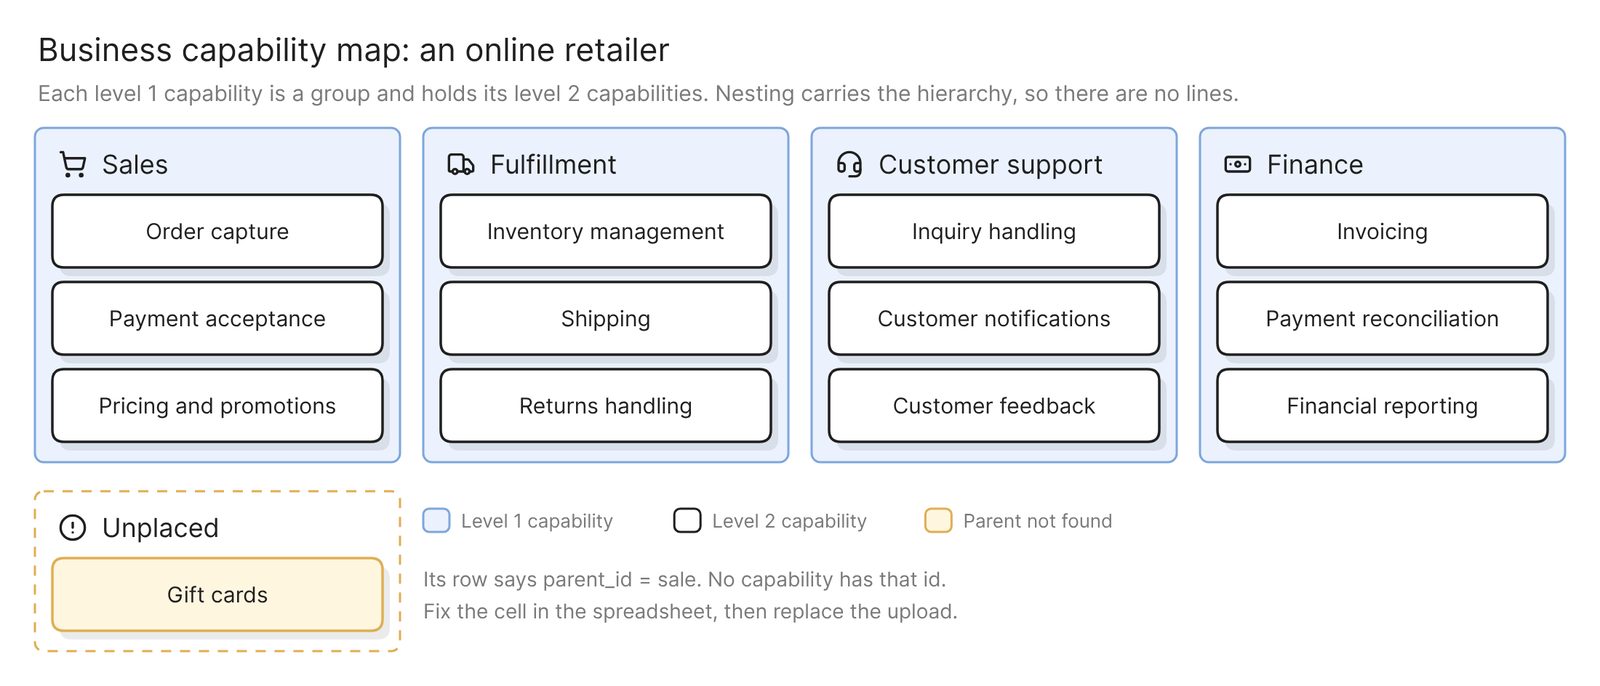 Example: the levels alone, with one capability whose parent matches nothing
Check three things before you add anything to it:
- Every capability appears once, at the right level. Count the tiles against the rows. A capability in Unplaced has an empty or mistyped
parent_id. In the example, the Gift cards row points atsale. - Every tile is something the business does. A capability is named as a noun, such as Order capture. A tile named after a project, a system or a department is a row to rename or remove.
- Nothing is joined by a line. Nesting carries the hierarchy. An arrow between two capabilities belongs on a process diagram.
Fix what you find in the spreadsheet, replace the upload and ask again. A tile corrected only on the canvas is wrong again the next time anyone draws from the model.
Step 4. Put the applications under each capability
Then add the applications:
Add the applications from the model. Put each application inside the
level 2 capability its capability_id names, as a small box with the
application's name. Color a capability with no application yellow and
one with five or more applications red. Below the map, add a key with
one labeled box for each color.
This leads to the map at the top of the page. Ask for the key as labeled boxes, because legends do not render in a freeform diagram. Then read the map as a planning document:
- Every application sits under the capability it supports. Look for five applications you know well. One in the wrong tile has the wrong
capability_id. - A capability with no application is a finding. Either the work is done by hand or its application was never mapped. The owner of Pricing and promotions knows which.
- So is a capability with five. Some of the overlap under Inquiry handling is deliberate, and the rest is where application rationalization starts.
- Every color has a key entry. If the groups came out blue, the key says what blue means.
You can keep prompting, or edit the diagram by hand.
Ask a different question of the same model
Each prompt draws a different diagram from the same upload.
A capability heat map
Draw the same capability map without the application boxes. Color each
level 2 capability by the lifecycle of its applications: red if any is
end-of-life, yellow if any is phase-out and none is end-of-life, white
if all are active, gray if it has no application. Under each colored
capability, name the application that set the color. Add a key.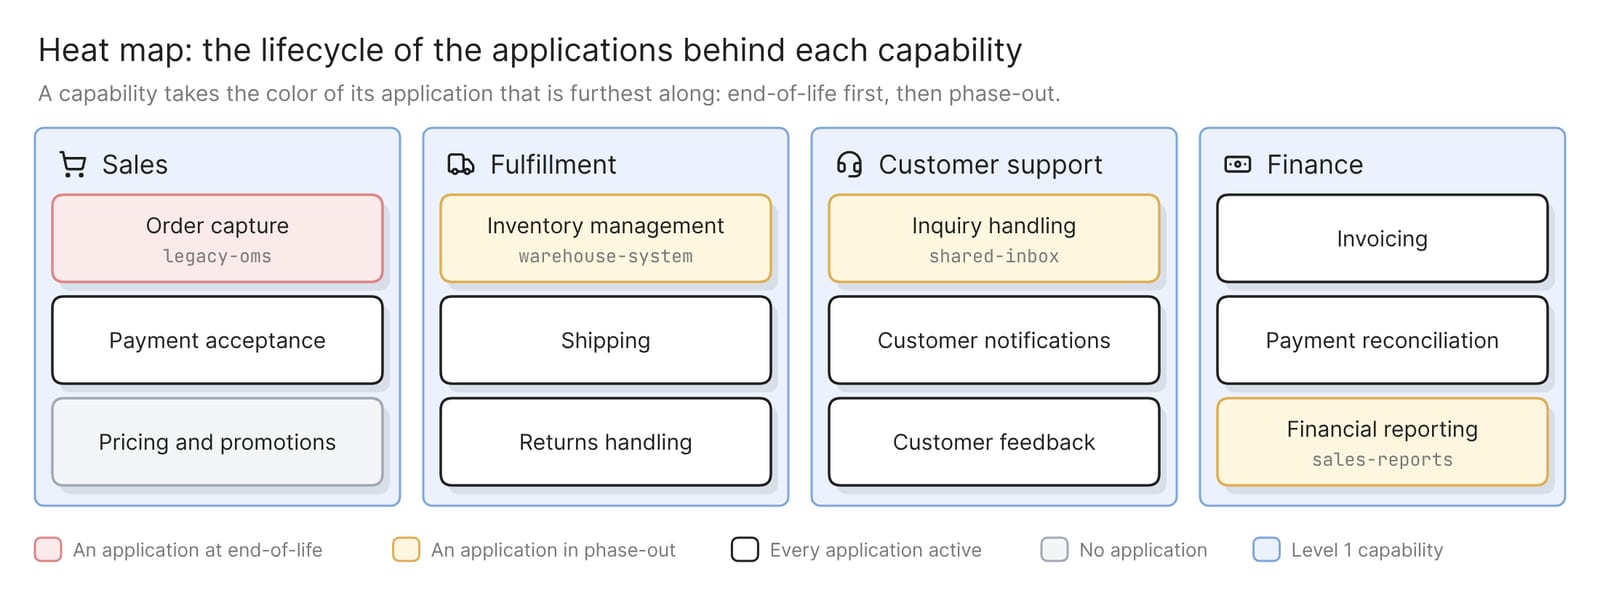 Example: the same map as a heat map of application lifecycle
Write the rule for each color into the prompt, so the same spreadsheet gives the same colors next cycle. Keep to one overlay per map.
One capability in depth
Draw only the Customer support capability. Show its level 2
capabilities as tiles, and inside each one its applications with
their owner and lifecycle. Leave out the rest of the map.
This is the page for the workshop on those five applications.
A list instead of a picture
List every level 2 capability as a table, with its level 1 parent, its
applications and their lifecycles. Put capabilities with no
application first.
With the same model attached, AI chat writes a document instead of a diagram.
For a one-off, Eraser can also turn a spreadsheet or the old slide straight into a diagram, with no model behind it.
Keep it current
The map is as current as the last upload. When the spreadsheet changes, replace the upload with a file in the same format. Records keep their identity by id, and records left out of the new file are removed. Then regenerate the map, or run Verify, which checks an existing diagram against the model and lists every issue without changing it.
For the planning deck, export the map as a PowerPoint or Google Slides slide, share it with a link, or embed it in Confluence or Notion. For a landscape people click into, build a map from the same model. There, a filter on a field such as owner fades the boxes that do not match.
Other ways to build a business capability map
- Keep the spreadsheet and draw the slide by hand. This suits a first workshop, when capabilities are renamed every hour. Excel can draw the hierarchy as a treemap chart, which Microsoft describes as “a hierarchical view of your data”. Excel picks a color for each top-level category, so the heat is still colored by hand.
- Use an enterprise architecture management suite. As of November 2026, SAP LeanIX says it imports data from Excel spreadsheets and offers “industry-specific business capability maps you can import and adapt”. A suite is the right choice when capabilities, applications and their owners need one governed home. It is a product to buy and roll out, and the spreadsheet stops being the source.
- Model it in an ArchiMate tool. Archi is an open-source modeling tool for the ArchiMate language, and its user guide lists a Capability Map viewpoint and a CSV import. It suits a team that already keeps an ArchiMate model, within TOGAF or another framework. The spreadsheet has to be reshaped first into the CSV files Archi expects, for elements, relations and properties.
FAQ
What columns does the spreadsheet need?
The capability table needs an id, a name, a level and the id of the parent. The application table needs an id, a name and the id of the capability it supports.
Can an application sit under more than one capability?
Yes. Keep the mapping in a third table with one row per pair. Then ask for the application to be drawn inside every capability it supports.
Does the map update when the spreadsheet changes?
Not on its own. Replace the upload with the new file, then regenerate the map or run Verify on the one you have.
Can I color the map by something other than lifecycle?
Yes, by any column in the upload, such as owner, criticality or a score. Write the rule for each color into the prompt and ask for a key.
Can I get the map into PowerPoint?
Yes. Export the diagram to PowerPoint or Google Slides and it arrives as one slide, with shapes and text you can still edit.
Where to go next
To sketch the systems behind one capability before any data exists, the architecture diagram generator draws one from a description. The glossary covers what the map feeds, from application portfolio management to the IT roadmap, and where it sits in enterprise architecture.
For what sits behind a retailer’s applications, see an e-commerce app on Azure and an e-commerce data model. If your applications are in a CMDB, the ServiceNow dependency map guide draws what each one runs on. When they are about to change, the current and target state guide draws the before and after.