Guide
How to draw current state and target state architecture diagrams
Scan a cloud account for the current state, verify it, then draw the target state on the same layout with every added, removed and changed part marked.
A review board or a steering group wants a proposed change as two pictures, where we are and where we are going. Most teams have the second and a stale copy of the first. A current state and a target state only work as a pair. A target drawn over an old current state hides work, such as the forgotten server that still reads the database you plan to retire.
This guide draws both from what is deployed. You connect a cloud account to Eraser read-only, scan it, and ask for the current state architecture. Then you describe the change and ask for the target state architecture as a second diagram, with the same names and layout and every change marked. The example is a cloud migration diagram for an online store on Azure, and the steps are the same on AWS and Google Cloud. Allow half an hour.
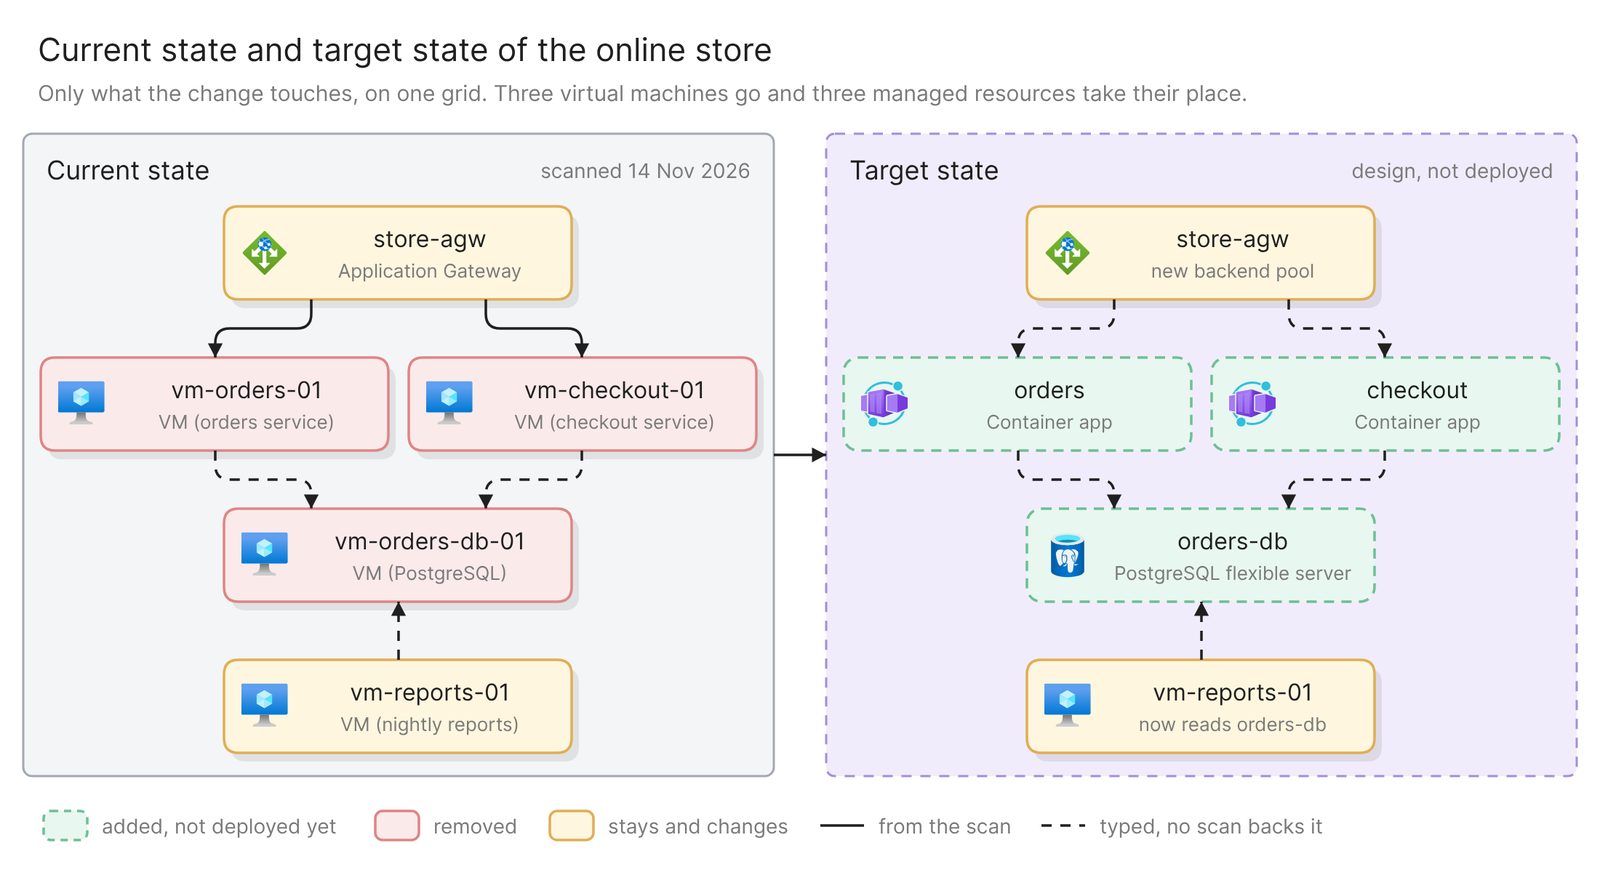 Example: the current and target state of an online store on Azure, side by side
Before you start
You need three things:
- Access to Eraser
- Access to the cloud account, with permission to create a read-only identity in it
- The proposed change, written as a list of what is added, removed and changed
A scan can back only one of the two diagrams. It reads how deployed resources are configured, so the current state comes from data. The target state is a design drawn from your description, and the steps below mark it as one.
Step 1. Connect the account and scan it
Eraser reads a cloud account through a read-only identity that you create in it, on Azure an app registration with the built-in Reader role. The first scan runs when you connect and builds a model, an inventory of what the account holds and how it connects. Later scans run when you start one, never on a schedule, so rescan on the day you draw.
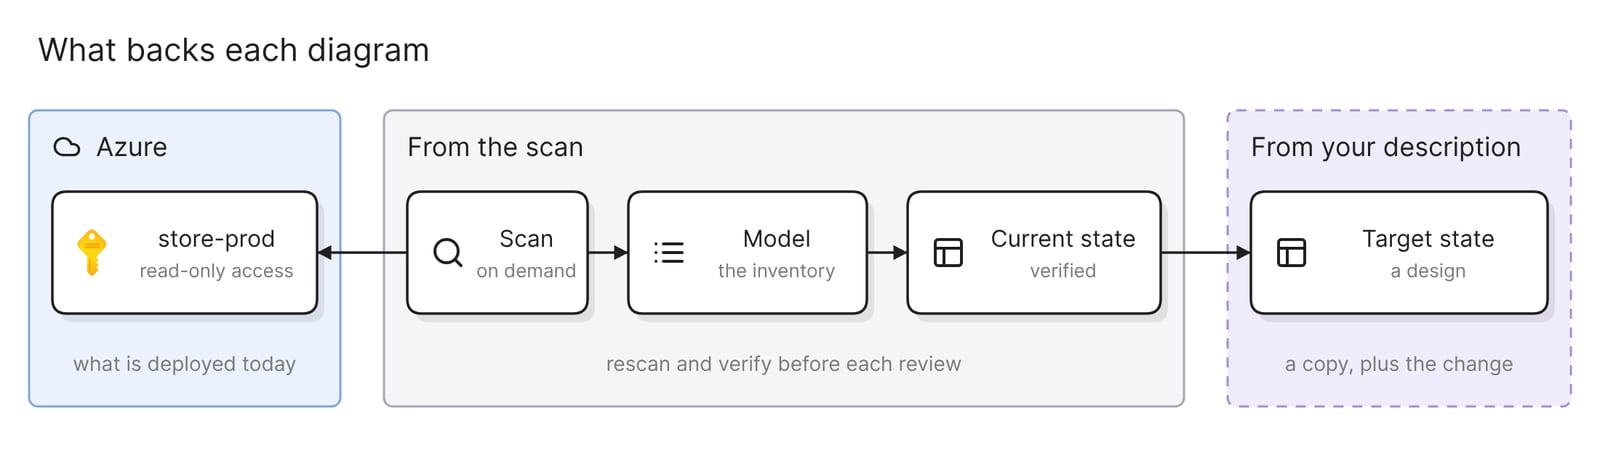 What backs each diagram: the scan for the current state, your description for the target
The docs link the click-by-click steps for every source.
Step 2. Ask for the current state, then verify it
Open AI chat, attach the account’s model and name the scope, because a model covers everything its connection imports:
Draw the current state of the online store in the store-prod
subscription. Group resources by virtual network and subnet, and put
whatever is not in a subnet outside the network. Use each resource's
name exactly as Azure has it, and draw only connections the scan found.
Title it "Current state: store-prod, scanned 14 November 2026".
A scan reads configuration, so do not count on the model knowing what a virtual machine runs or which machine it calls. Open a record and look. Add what is missing by prompt, marked so readers can tell it from the scan:
vm-orders-01 and vm-checkout-01 call vm-orders-db-01. vm-reports-01
reads it every night and writes to storereports. Draw those calls as
dashed lines. Under each virtual machine, add what it runs in brackets:
orders service, checkout service, PostgreSQL, nightly reports.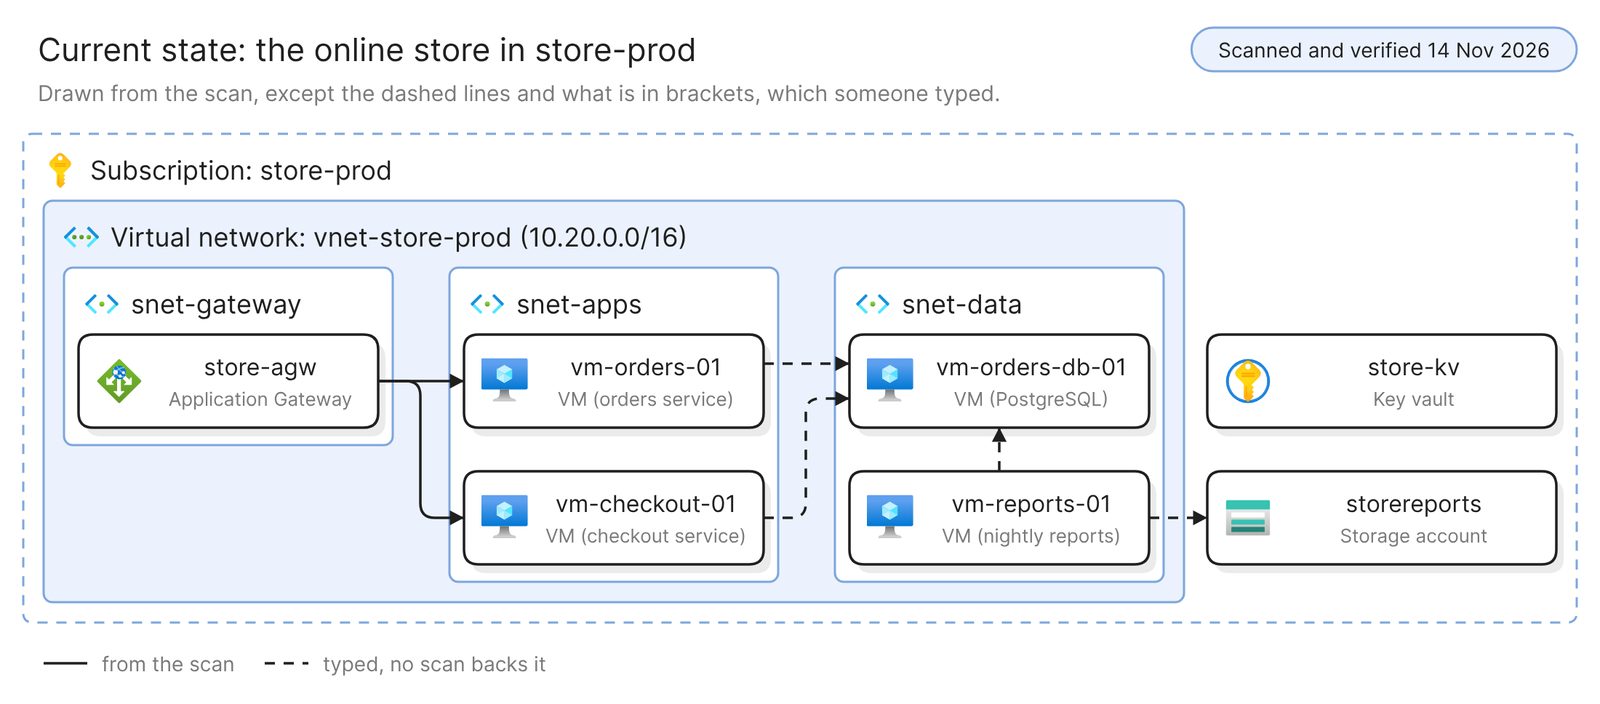 Example: the current state, dated, with what was typed dashed or in brackets
The target is judged against this diagram, so check three things first.
- Verify has run today. Verify checks a freeform diagram against the model and lists every issue without changing it. Rescan first if anything has been deployed since. No model backs the dashed lines, so confirm those by hand.
- The parts nobody mentioned are on it. The example’s
vm-reports-01was in no proposal. The scan found it, and its owner said what it reads. - The scan date is in the title. A model shows its last scan, and Microsoft’s guidance on diagrams asks for metadata such as “last updated date, author, version”.
Step 3. Describe the change and ask for the target state
The example moves two services from virtual machines to container apps and a self-managed database to a managed one. Microsoft’s Cloud Adoption Framework calls that a replatform, which “moves workloads to a modern hosting environment with minimal code changes”.
Make a copy of the current-state diagram, select the copy, and describe the change in the same chat. A copy starts with every name and position in place.
Turn this copy into the target state. Keep every name and position.
Add: container apps orders and checkout in a new subnet
snet-containers, and a PostgreSQL flexible server orders-db behind a
private endpoint pe-orders-db in snet-data.
Remove: vm-orders-01, vm-checkout-01, vm-orders-db-01 and the subnet
snet-apps. Keep them on the diagram.
Change: store-agw routes to the container apps, and vm-reports-01 reads
orders-db.
Color added parts green with a dashed outline, removed parts red and
changed parts yellow. Under each red or yellow box, say in a few words
what happens to it. Draw new connections dashed. Add a legend as small
labeled boxes, and title it "Target state: design, not deployed".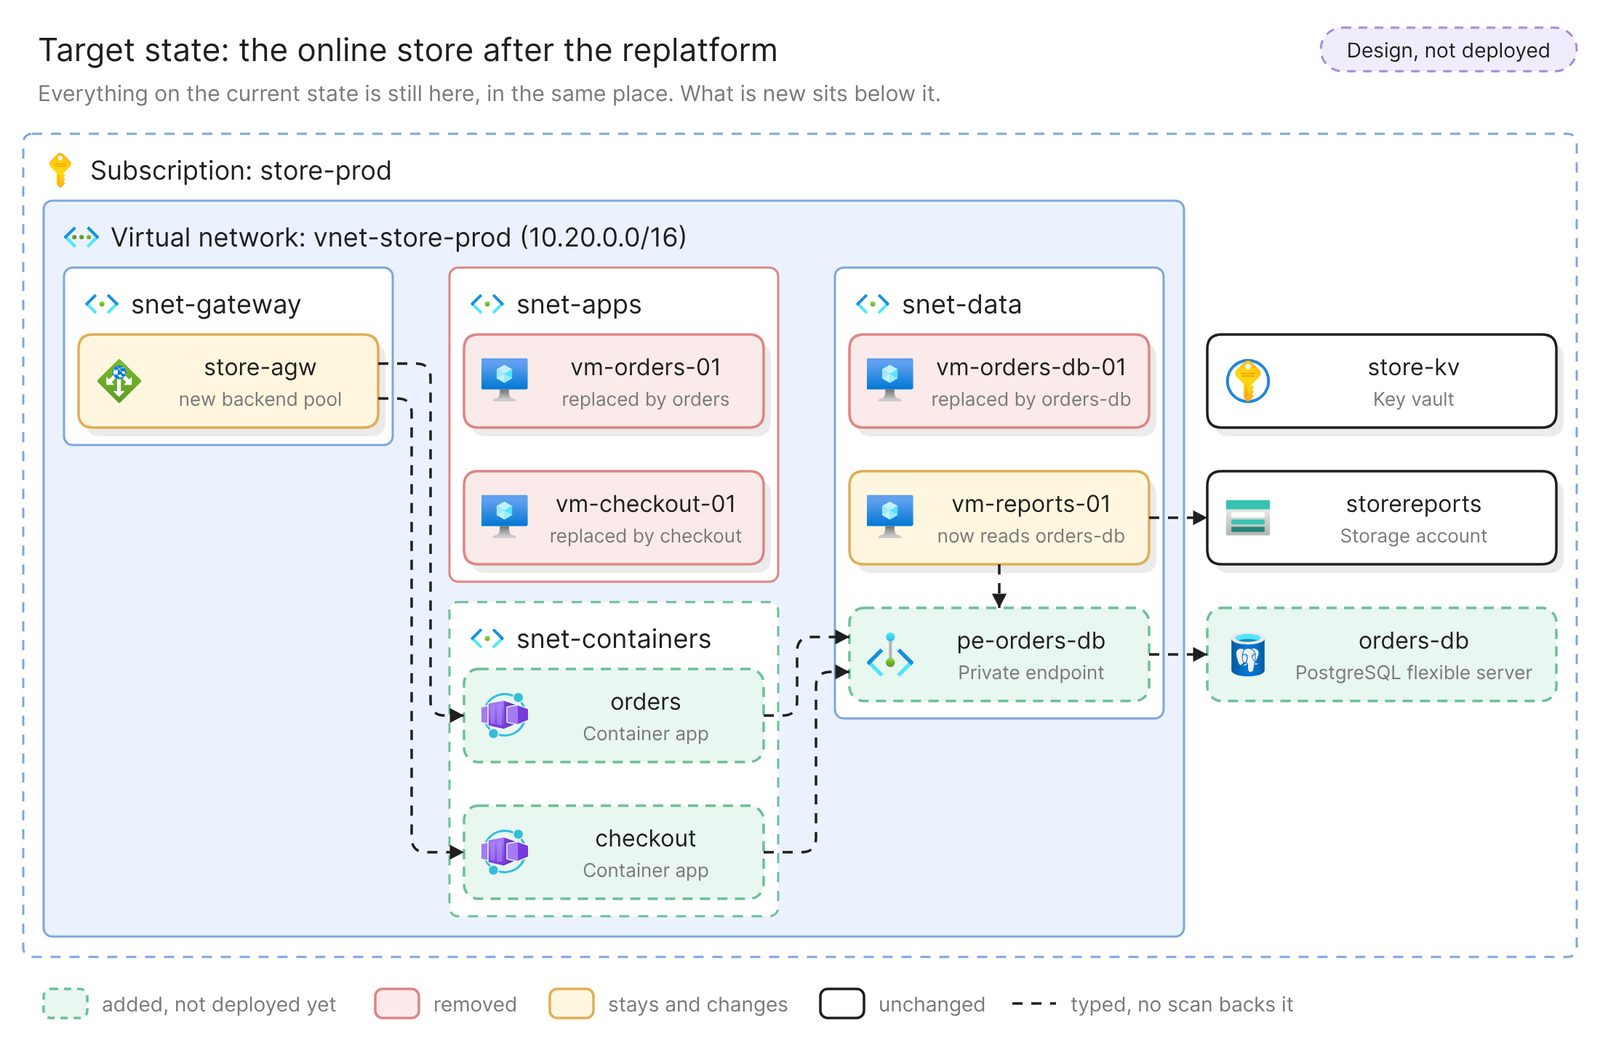 Example: the target state, with every change marked
No scan holds a container app that does not exist yet, so nothing backs the green parts or the new lines, and the title and the dashes say so. A freeform diagram does not render a legend of its own, hence the boxes.
Then compare it with the current state, box by box.
- Names are identical. Whatever does not change has the same name on both diagrams, letter for letter. A renamed box reads as a removal and an addition.
- Every difference has a color. Each one is added, removed or changed, and the legend says which. A box that moved or lost a line with no color is a change nobody explained.
- Nothing is missing. Find every box of the current state on the target, unchanged, yellow or red. One that vanished is a decision nobody made, as with
vm-reports-01when the change list leaves it out. - Every removal names its replacement.
vm-orders-db-01says “replaced by orders-db”. A red box with no replacement needs a reason. - Color is not the only cue. Microsoft’s guidance is to “consistently pair color with pattern”, and the dashed outlines and the notes still read on a gray printout.
Step 4. Add a transition architecture if the change lands in stages
If the change stops at a state you will run for weeks, draw that state too. Copy the target-state diagram, select the copy and ask:
Turn this copy into transition state 1, the database cutover. orders-db
and pe-orders-db are live, and vm-orders-01, vm-checkout-01 and
vm-reports-01 all connect to orders-db. vm-orders-db-01 stays,
read-only, for rollback. The container apps and snet-containers do not
exist yet, so take them out. Keep the colors and the legend, and title
it "Transition 1: database moved, design".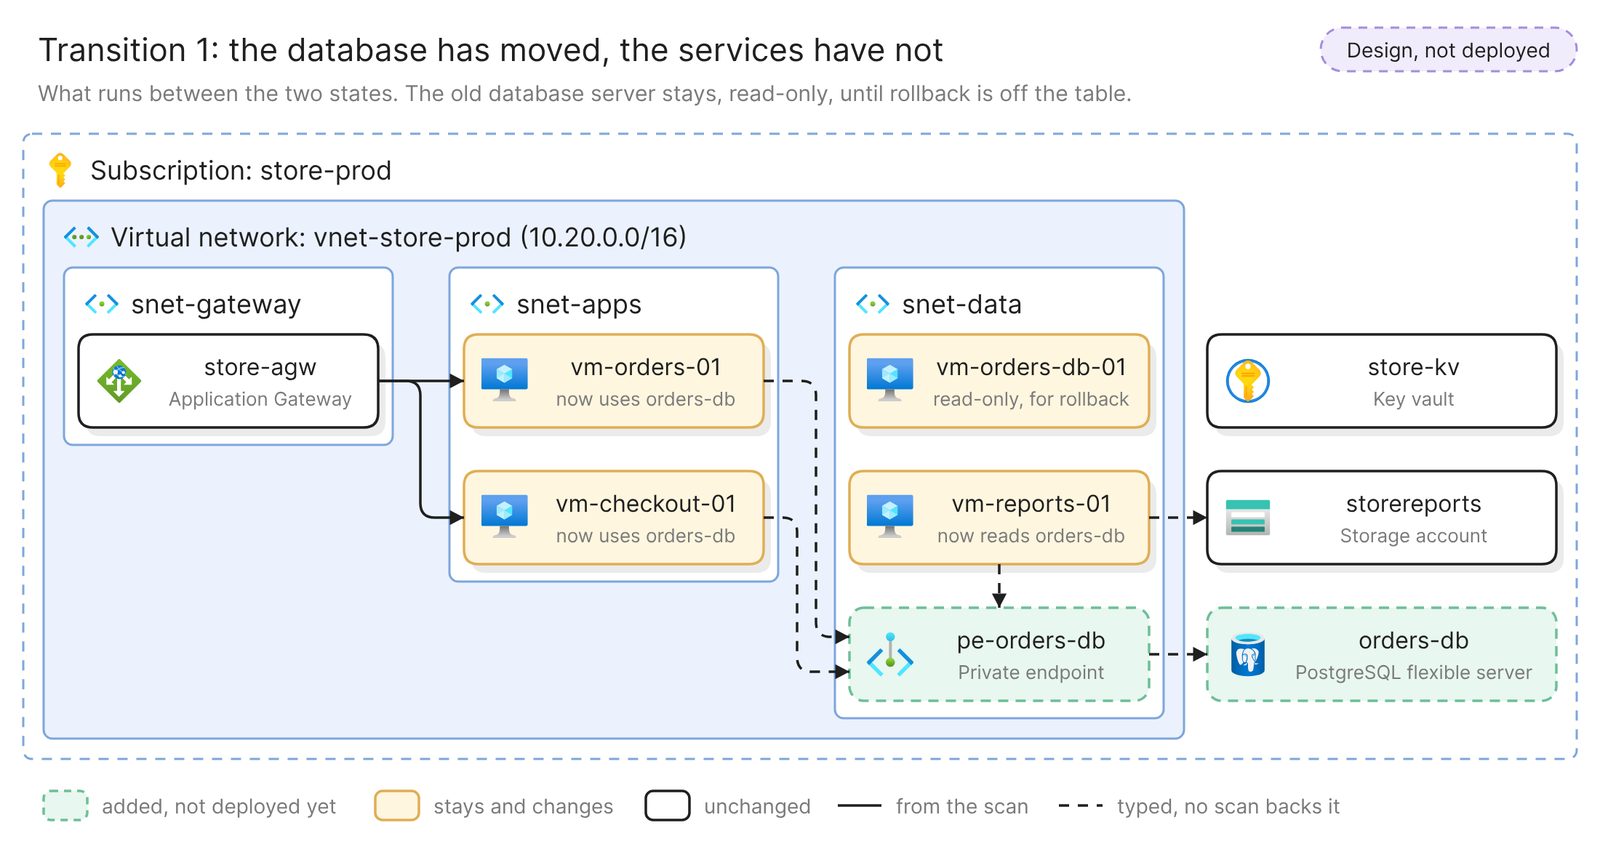 Example: a transition state, with the old database server kept for rollback
A transition view shows what the program has to run and pay for, here a database server kept read-only until rollback is off the table. Check it as you checked the target. Each transition state is a milestone on the IT roadmap.
Get the pair ready for the review
A steering group reads one slide. Ask for it last:
Draw the current state and the target state side by side at the same
size, with only the resources the change touches. Keep the colors, the
notes and the legend.
The example at the top of this page is that view.
- Write the gap list from the colors. Each colored box is a piece of work. Eraser can write a description of a selected diagram into the file’s document, ready to edit into one line per box.
- Use a map for a large estate. A map is a file of views built from the same models, and a reviewer clicks from the big picture into one system. The enterprise architecture diagram guide builds one.
Keep it current
The current state is as old as its scan. Before each review, rescan and run Verify on the current-state diagram. An issue means the system has moved since the target was drawn, so fix the current state and redo the comparison.
When the last red box has left the account, attach the model and run Verify on the target itself. A scan backs it now, and each issue is a difference between the design and what was built.
Share either diagram with a link, embed it in your wiki, or export it. A PowerPoint or Google Slides export gives one slide per diagram.
Other ways to draw current and target state diagrams
- Model both states in ArchiMate. Archi is an open-source modeling tool that, as of November 2026, supports ArchiMate 3.2. The Open Group’s reference cards for that version define a plateau as “a relatively stable state of the architecture” and a gap as the difference between two plateaus. ArchiMate 4, published in April 2026, removed the gap element. Choose this when an architecture team keeps one model of many systems. The baseline is as current as that model’s last update.
- Run the cloud vendor’s migration assessment. Azure Migrate discovers on-premises servers through an appliance and assesses them for Azure readiness, sizing and cost. Its dependency analysis captures the TCP connections between servers and shows them in a map view. It is the better choice when the current state is in a data center and the first questions are what talks to what and what the move costs. Its assessments belong beside the two diagrams.
- Draw both by hand. Microsoft publishes the Azure architecture icons, and draw.io has an Azure shape library and layers you can show and hide, so one drawing can hold both states. This suits a target for a system that is not built at all. Nothing checks either drawing against the account.
Best cloud diagram tools in 2026 compares other tools that read a live account.
FAQ
Can Eraser draw the target state from the scan?
No. A scan holds what is deployed, and the target is not. Eraser draws it from your description of the change, on a copy of the verified current state.
Is this the same as an as-is and to-be architecture diagram?
Yes. As-is and to-be, baseline and target, and current and future state architecture all name the same pair. Use your review board’s words in both titles.
How do I draw a cloud migration architecture diagram from on-premises?
Start from a source that holds it. VMware and ServiceNow are data sources too, and the hybrid cloud guide draws a data center and a cloud account in one diagram. Steps 3 and 4 apply unchanged.
Should the current and target state be one diagram or two?
Two. Each then reads alone, and the current one can be verified against the model. Draw the side-by-side version last.
Where to go next
To design a target architecture for a system with nothing deployed yet, describe it to the architecture diagram generator. For reference architectures to aim at, see a basic web app on Azure, an e-commerce app on Azure and a serverless web app on Azure.
The glossary covers enterprise architecture, TOGAF and solution architecture. To get the pair past your board’s own standard, see how to prepare a solution architecture diagram for review.