Guide
Enterprise architecture diagram: build one from your own systems
Connect your cloud account and CMDB, upload your application inventory, and build a map that goes from business capabilities down to one system.
An enterprise architecture diagram shows how a whole estate fits together, from what the business does down to the servers it runs on. No single system holds that picture. The cloud console knows the infrastructure, the CMDB knows the servers, and a spreadsheet knows the applications and their owners. So the diagram is drawn by hand for a slide and goes stale one part at a time.
This guide builds it from those sources. Each one becomes a model in Eraser, and a map built from the models goes from every application down to one system. The glossary covers enterprise architecture itself. Setup takes ten to fifteen minutes for each source, and most of the work after that is checking.
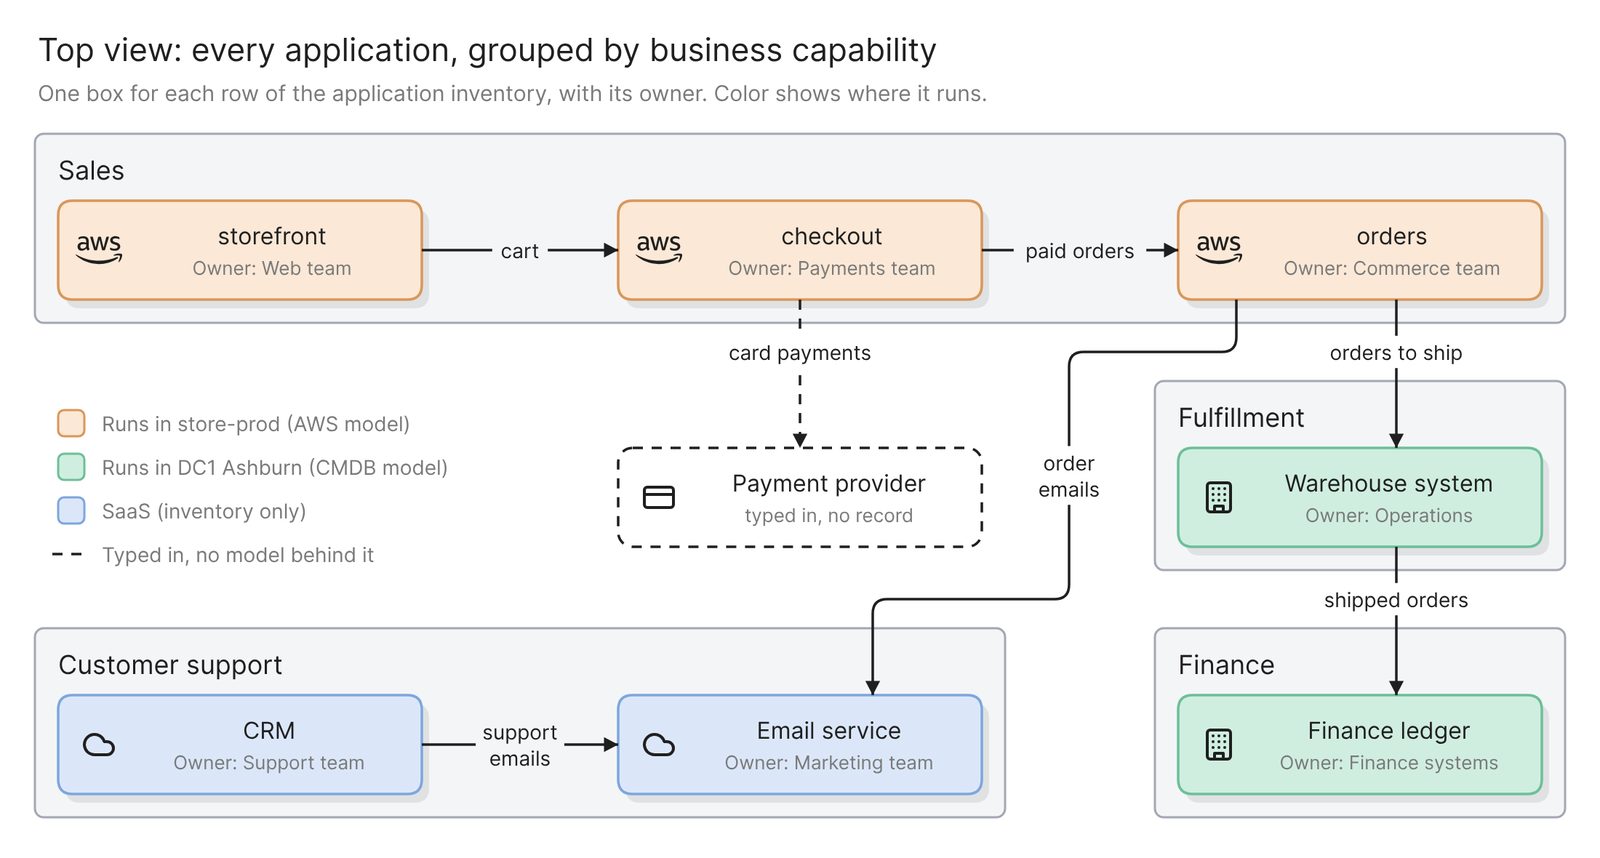 Example: a retailer’s seven applications by business capability, colored by where each one runs
What the diagram has to show
The diagram has four layers, and each one lives in a different place.
| Layer | What it shows | Where the facts live |
|---|---|---|
| Business capabilities | What the business does | A tab in the inventory |
| Applications | Each application and its owner | The application inventory |
| Data | What each application holds | A column in the inventory |
| Technology | What each application runs on | The cloud account and the CMDB |
The top two layers are a business capability map with the applications attached, also called an application landscape diagram. The C4 model’s version is the system landscape diagram, “a map of the software systems within the chosen scope”. An IT architecture diagram usually means the applications and what they run on.
Before you start
You need three things:
- Access to Eraser
- Access to the cloud account, and a ServiceNow admin for the CMDB
- The spreadsheet that lists your applications, with a capability for each one
Every connection is read-only, and a model holds the last scan or upload, not the live source. Eraser has no connector to a spreadsheet or to a SaaS application such as a CRM. The spreadsheet goes in as an uploaded file, and a SaaS application exists only as a row in it.
Step 1. Turn each source into a model
Each source ends up as a model, an inventory of records and the connections between them.
- The cloud account. Eraser scans it through a read-only identity you create. See the cloud architecture diagram guide.
- The CMDB. Eraser scans it as an integration user that holds only read roles. See the ServiceNow guide.
- The application inventory. You upload it as an Excel workbook or as CSV files. Each table becomes a record type and each row a record.
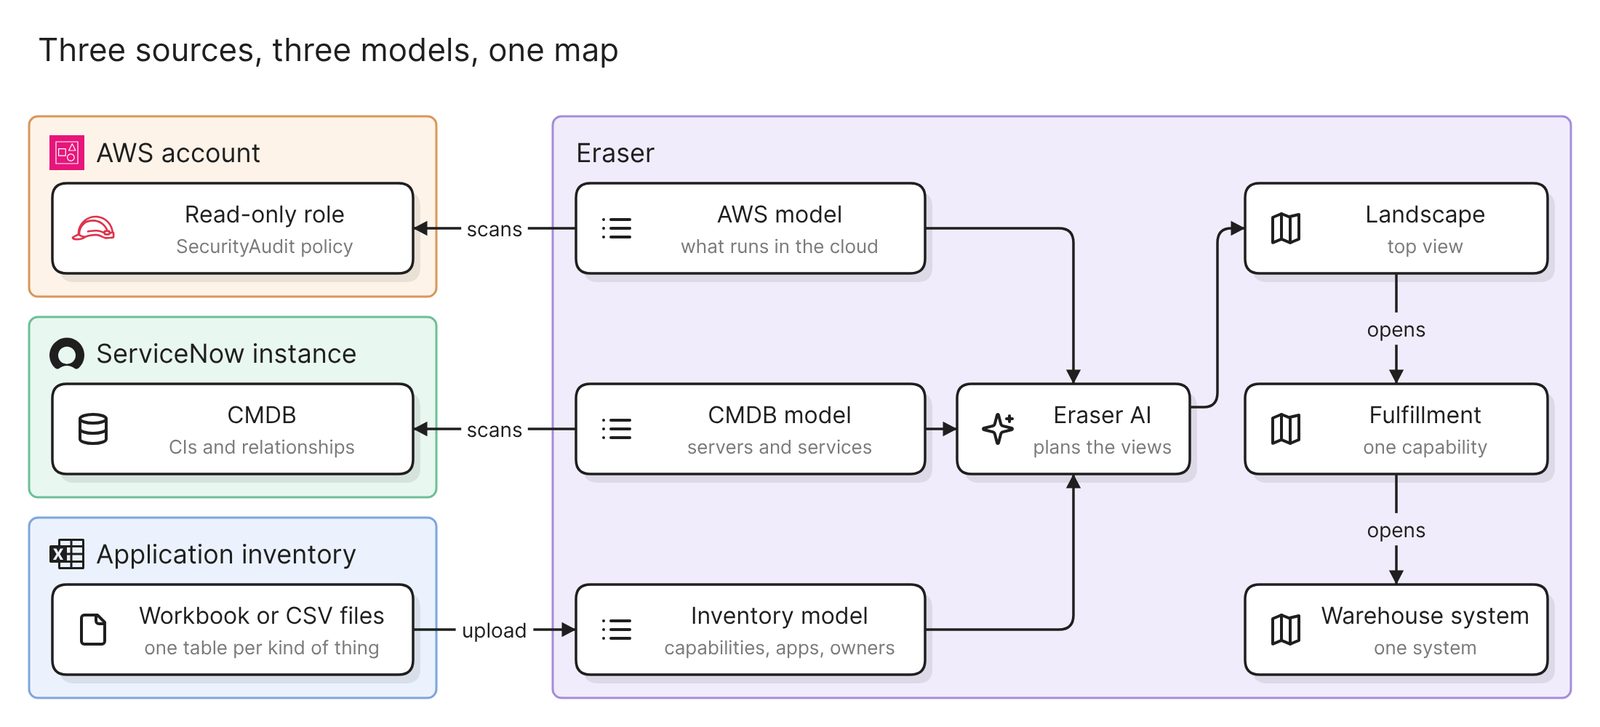 What each source sets up, and how one map draws on all three
The applications table needs an id that never changes, and a column for each fact you want on the diagram:
id,name,capability_id,owner,lifecycle,runs_on,data
orders,orders,sales,Commerce team,active,store-prod,Order records
wms,Warehouse system,fulfillment,Operations,active,DC1 Ashburn,Stock levels
crm,CRM,customer-support,Support team,active,SaaS,Customer cases
capability_id points at a row in a capabilities table, and runs_on names the account or data center as the other sources name it. A third table, integrations, has source and target columns for which application sends data to which. The capability map guide covers shaping these tables.
Secrets are left out when a file is read. The rest lands in a model your whole team can use, so first delete any column that should stay private. The docs link the click-by-click steps for every source.
Step 2. Ask for the top view
Start a new map, which is a file of linked views, and add the three models to it. Then tell Eraser AI how the models relate:
Build a map of our application landscape from these three models. The
inventory model is the list of applications: draw one box for each row
of its applications table and no others. Group the boxes by capability
and label each with its owner. Color each box by its runs_on column,
and add a key made of one labeled box for each color. Draw each row of
the integrations table as a line, labeled with what it carries. Under
this view, plan one view for each capability.
Eraser AI answers with a plan that has a card for each view. Read it before you build, and change it in the chat if a view is missing or too broad.
Making the inventory the only source of boxes matters. The other two sources know the same applications under other names, and without that rule one application can turn up twice.
Step 3. Ask for the views under it
The views under the top view add what each application runs on, which comes from the other two models. Ask for one capability at a time:
Add a view for the Fulfillment capability, and link the Warehouse system
box on the top view to it. Show the capability's applications and the
applications that send them data, in three layers: the applications,
the data each one holds, and what each one runs on. Take what orders
runs on from the store-prod account in the AWS model, and the servers
for the Warehouse system from the CMDB model. Use the same names as the
top view.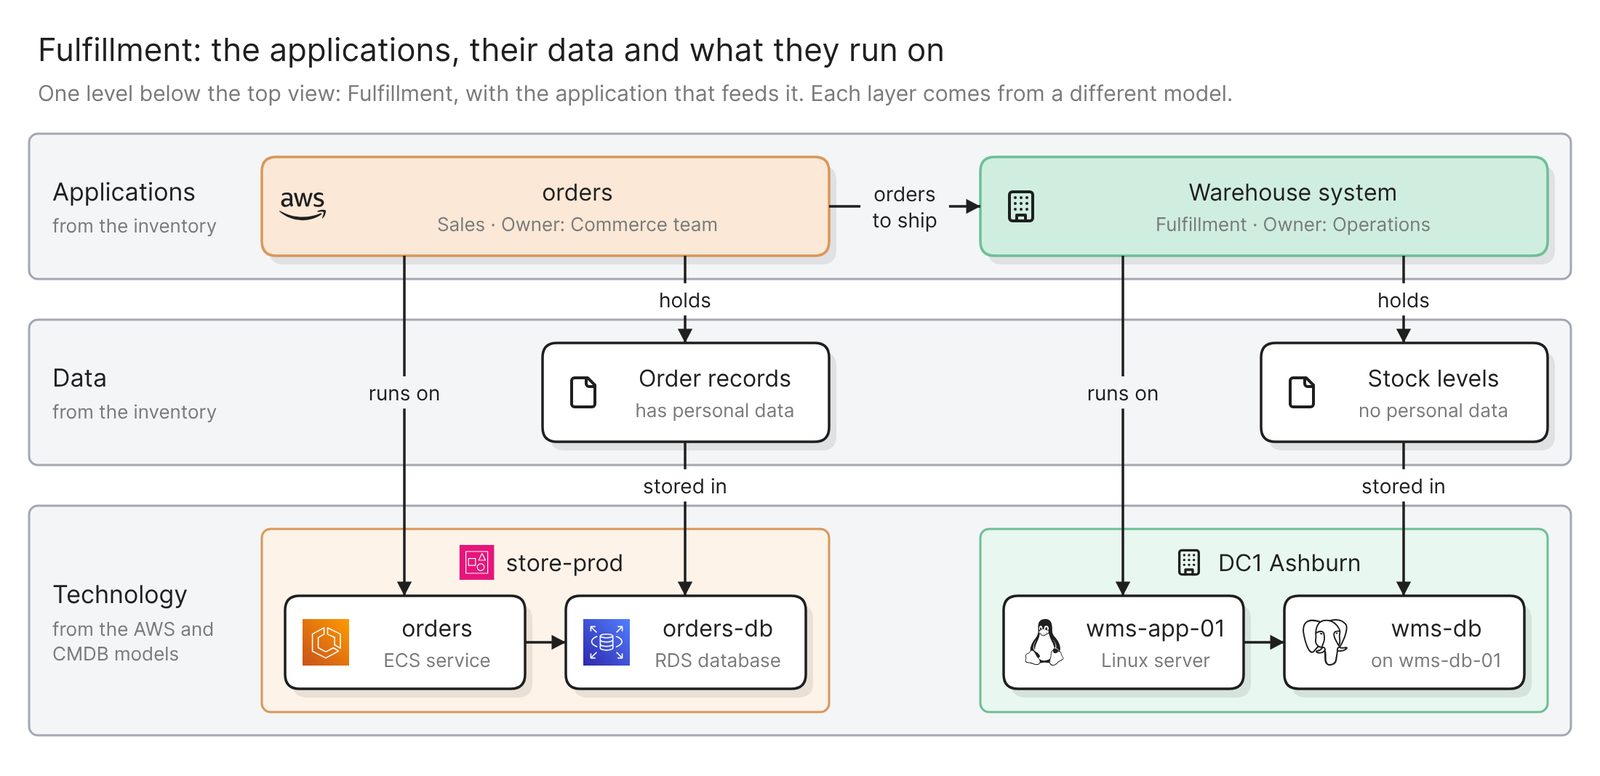 Example: one capability, drawn from all three models
Then go one level further for the systems people ask about most:
Add a view of the Warehouse system, linked from its box on the
Fulfillment view. Show its application service from the CMDB model, the
servers and database it runs on, and the applications it exchanges data
with.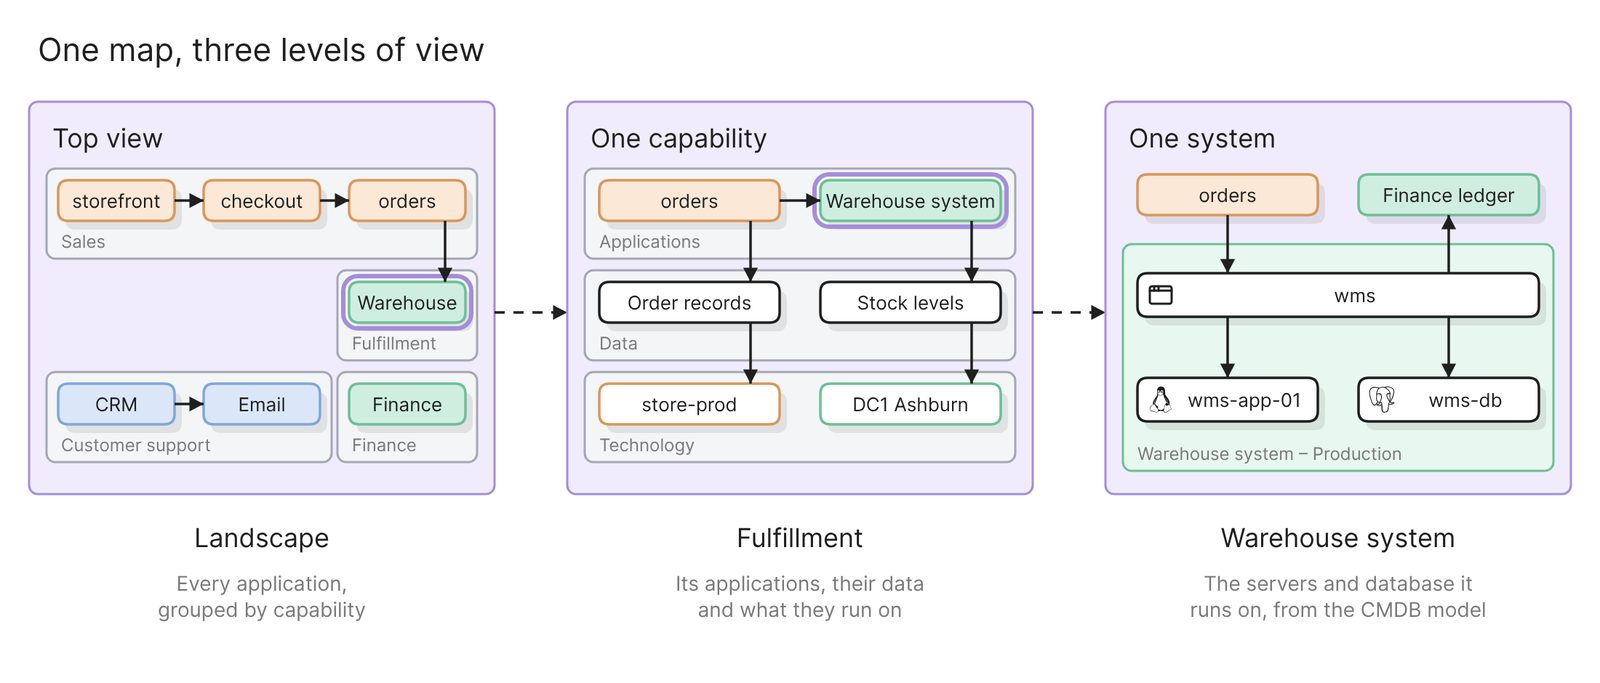 Example: three levels of one map, each opened from a box on the level above
A box can link to a deeper view, and a box can stand for a record in a model. Give every application on the top view one or the other. With a record behind it, clicking the box when presenting opens that row of the inventory.
Anything that is in none of the three sources has to be typed. In the example that is the payment provider:
Add a Payment provider box to the top view, outside the capability
groups, with a line from checkout labeled "card payments". No model
holds it, so draw the box and the line dashed, and add a dashed line to
the key labeled "typed in".
Step 4. Check the map
Check five things before anyone relies on the map.
- Every application appears once. Count the boxes on the top view against the rows of the inventory. Two boxes for one application usually mean two sources spell its name differently.
- Every application has an owner. A box with no owner is a blank cell. Fix it in the spreadsheet and replace the upload.
- Every box on the top view opens something. Switch to presenting and click each one. It should open a deeper view or a record.
- The same name is used at every level.
orderson the top view isorderson the Fulfillment view and theordersservice in the account. - What was typed is marked as typed. A dashed box or line came from a prompt, and no scan or upload backs it. Check those by hand.
Do not count on any model holding the link between an application in the inventory and a server in the CMDB. When a match looks wrong, open both records and compare them.
Ask more of the same map
Each prompt adds to a view without redrawing it.
Filter the top view
Add filters for owner and lifecycle to the top viewFilters use the fields of the records behind the boxes. Check a value, such as a lifecycle of phase-out, and every box that does not match fades.
Walk through one flow
Add a flow to the top view that follows one order: from storefront to
checkout, to orders, to the Warehouse system and on to the Finance
ledger
A flow steps through a view one stage at a time. It suits a review that asks what happens to an order after checkout.
A map can also start from a description, with no model behind it (docs).
Keep it current
Each model is as old as its last scan or upload, and nothing scans on a schedule. Rescan the cloud account and the CMDB after a change, and replace the upload when the spreadsheet changes. Do not count on a view redrawing itself. Open it, compare it with the model and ask Eraser AI for the change. Eraser saves a version of the map before each AI change.
People who cannot edit the map open it in a presenting mode, where they click into views and open records. Share the whole map or a link to one view, or export views as images, a PDF or an interactive HTML page.
Other ways to make an enterprise architecture diagram
- Model it in ArchiMate. ArchiMate is The Open Group’s modeling language, and version 4 “continues to align closely” with TOGAF. Archi is an open-source tool for it that runs on Windows, macOS and Linux, and as of November 2026 its site says it supports ArchiMate 3.2. Choose this when your practice needs a formal model with defined element types. The model holds what people enter into it.
- Use an enterprise architecture management suite. As of November 2026, SAP LeanIX offers “a continuously updated view of your IT landscape” and prices by the number of applications. ServiceNow’s own Enterprise Architecture product, formerly Application Portfolio Management, keeps business capabilities and business applications in the CMDB. A suite is the right choice when the portfolio needs a governed system of record. Expect a rollout before the first diagram.
- Draw it by hand. A slide or a diagram editor is enough for one board presentation, and draw.io’s reference lists two ArchiMate shape libraries. Nothing ties a box to the system it stands for, so the drawing is right only on the day it was made.
FAQ
Is an application landscape diagram the same thing?
It is the top view of one. An enterprise architecture diagram adds the capabilities above and the data and technology below.
Do I need all three sources?
No. The application inventory alone gives the top view. A cloud account or a CMDB adds the technology layer.
Does the map update when a source changes?
The models do not refresh on their own. Rescan or replace the upload, then open each view and ask Eraser AI for what changed.
Who can see the records behind the boxes?
Anyone who can open the map. Guests and people with a link see the records on the map, and not the models behind them.
Where to go next
To sketch a landscape before any source is connected, describe it to the architecture diagram generator. The maps page shows a finished one.
The glossary covers application portfolio management, the work of an enterprise architect and the step down to solution architecture. To plan a change, duplicate a view and draw the target beside the current state. For the inside of one application, see an e-commerce app on Azure and the e-commerce website data model.