Guide
Cloud architecture diagram: draw one from your live accounts
Connect each cloud account read-only, scan it, and ask for one diagram across accounts and providers, with every line that crosses a boundary labeled.
A cloud architecture diagram shows what a system runs in the cloud and how the parts connect. A real system rarely sits in one place. Production is in one account, shared services in another, and analytics with a second provider in a multi-cloud estate. The diagram that shows all of it is stitched together by hand from several consoles, and each part goes stale separately.
This guide draws it from the accounts themselves. You connect each cloud account to Eraser as a read-only data source, scan it, and ask for one architecture diagram across all of them. The method is the same on AWS, Azure and Google Cloud. Allow ten to fifteen minutes of setup for each provider.
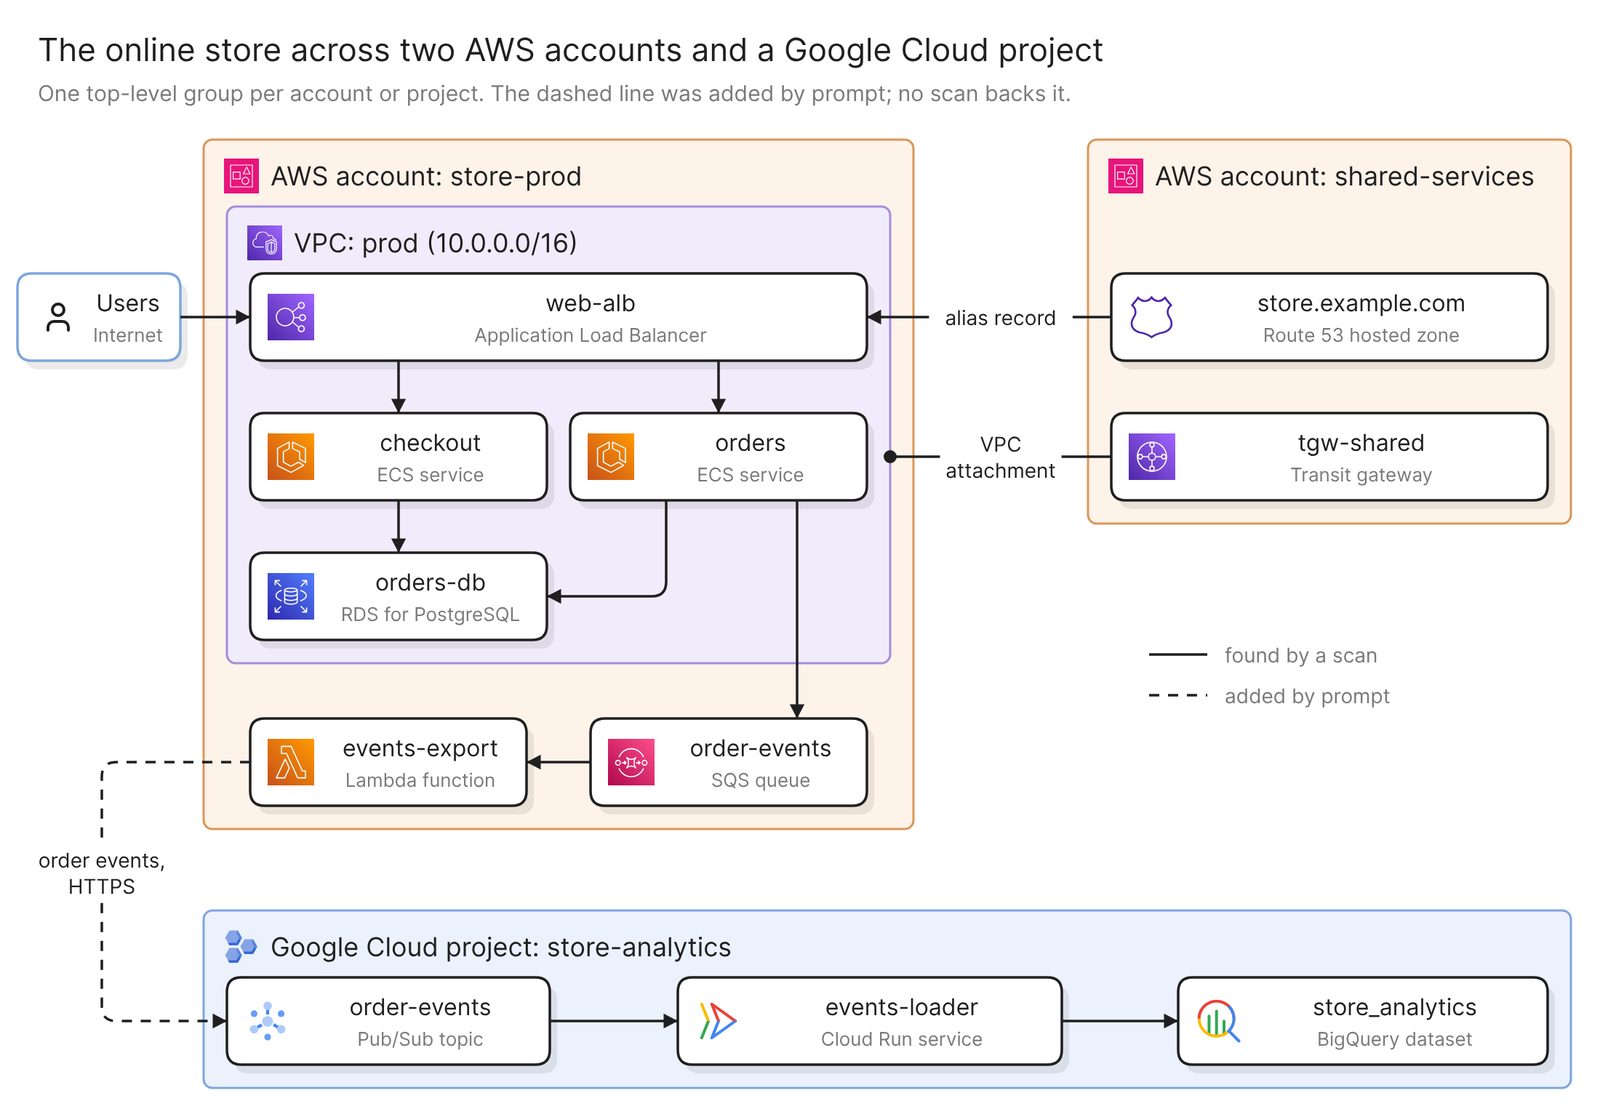 Example: an online store across two AWS accounts and one Google Cloud project
Before you start
You need two things:
- Access to Eraser
- Access to each cloud account you want on the diagram, with permission to create a read-only identity in it
Every connection is read-only. A scan reads how resources are configured, and nothing stored in your buckets, databases or secrets. Each scan also reads one provider, so plan to add what crosses between providers yourself, in step 3.
Step 1. Connect each cloud
Each provider connects through a read-only identity that you create in your own cloud: a role in AWS, an app registration in Azure, a service account in Google Cloud. Eraser checks it and refuses one that can write.
One connection can cover many accounts: an AWS organization, every subscription in an Azure tenant, or everything under a Google Cloud folder or organization. You pick what to import.
Each connection scans when you set it up and builds a model, an inventory of what it found and how the pieces connect. A model covers everything its connection imports. Five accounts in one AWS organization are one model, and AWS plus Google Cloud are two.
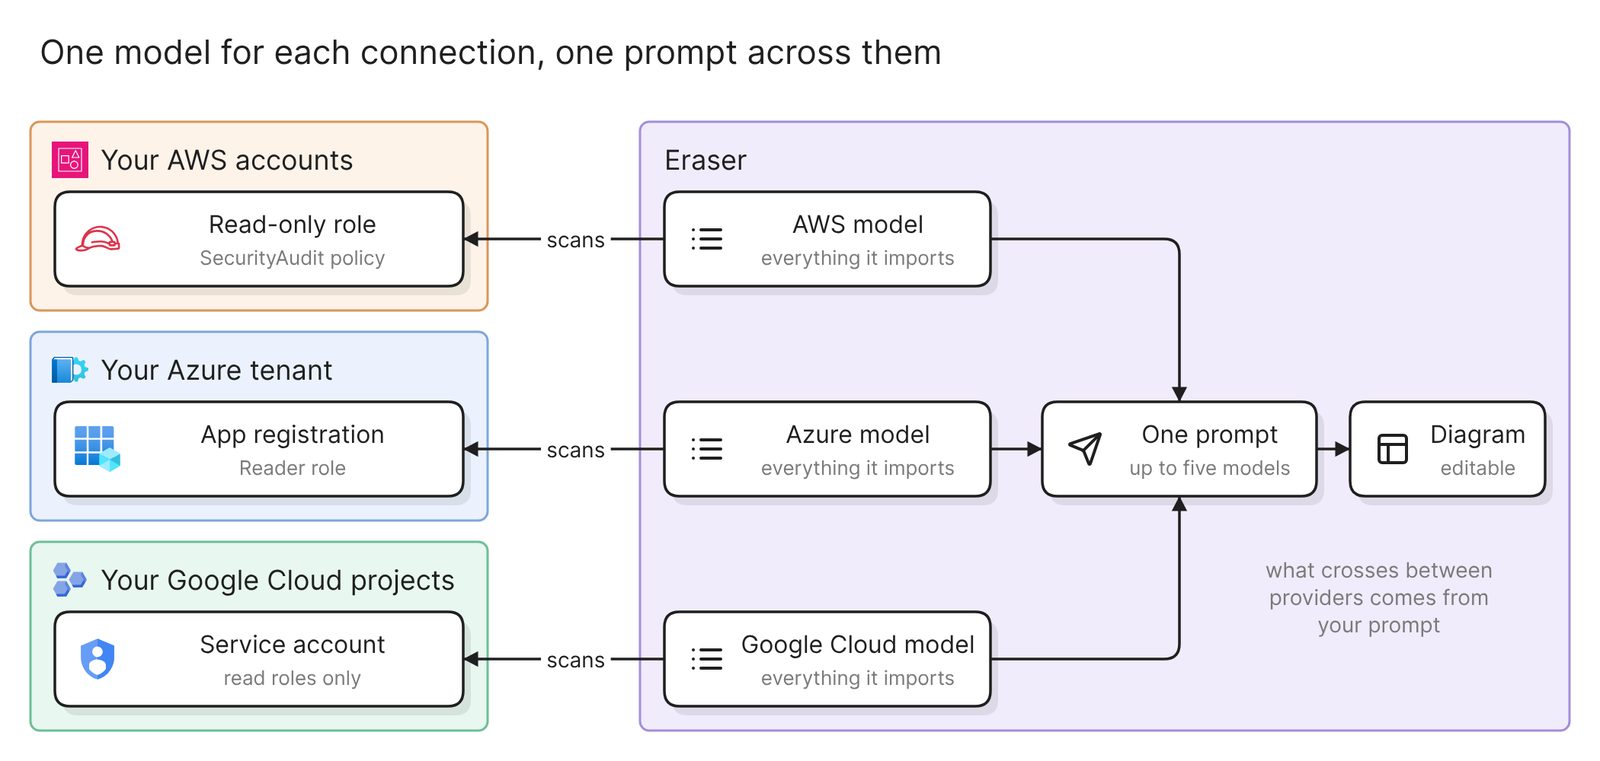 What each connection sets up, and how one prompt reads several
The docs link the click-by-click steps for every source, and the AWS, Azure and Google Cloud guides each cover one provider in depth. VMware and Cisco are data sources too, for a hybrid cloud.
Step 2. Ask for one diagram across them
Open AI chat and attach the models. One request reads up to five. A model holds everything its connection imported, so name each account and project you want:
Draw one architecture diagram of the store-prod and shared-services AWS
accounts and the store-analytics Google Cloud project. Make each account
and the project a top-level group, labeled with its provider and its
name. Inside each group, nest resources by network. Draw the connections
the scans found, and nothing between AWS and Google Cloud yet.
The first result reads like a cloud infrastructure diagram. It shows what is deployed and where, before you have said what matters. You can edit it by hand or keep prompting.
Whatever the provider, check that it shows what every cloud architecture diagram has to show.
- Who owns what. Every resource sits in the group of its account, subscription or project. AWS calls an account “the basic container for all the AWS resources you create”, Microsoft says the Azure equivalent is the subscription, and in Google Cloud it is the project.
- The network boundary. Anything on a private network is inside that network’s group, and what users reach first is easy to find.
- Where the data lives. Each database, bucket and queue is on the diagram, joined to what reads and writes it.
- What each line means. “Label lines when relationships aren’t immediately obvious from context,” says Microsoft’s guidance on diagrams.
Then compare one account with its console. Anything created since the last scan is missing until you rescan.
Step 3. Add what crosses between providers, then check it
Do not count on either model holding the call from a function in AWS to a topic in Google Cloud. Open the model, look at the function’s connections, and add what is missing by prompt:
Add the connection between AWS and Google Cloud. The events-export Lambda
function in store-prod publishes order events over HTTPS to the
order-events Pub/Sub topic in store-analytics. Draw it as a dashed line
labeled "order events, HTTPS", and add a small text box as a key that
says dashed lines were added by hand.
The dashed line tells the next reader which connections a scan backs and which somebody typed. Microsoft’s guidance asks for “a compact legend” whenever a line style carries meaning. Freeform diagrams do not render legends, so ask for a text box.
Check four things before you share the diagram:
- Every account, subscription or project is a labeled group. The label names the provider as well as the account.
- Nothing is drawn twice. Look for the same resource in two groups. Likely candidates are a resource one account owns and another uses, such as a transit gateway shared across accounts, and an account that two connections both import. Ask for each to be drawn once.
- Every line that crosses a boundary is labeled. A line between two accounts or two providers says what it carries, such as a DNS alias, a network attachment or order events over HTTPS.
- The level of detail suits the reader. “Resist the urge to encode every subsystem, data classification, and runtime path in a single diagram,” Microsoft advises. If nobody can read it without zooming, split it, as the next section does.
Ask for the view you need
Each prompt below draws a different diagram from the same scans.
One environment across accounts
Draw the production environment across the store-prod and shared-services
accounts: the prod VPC and what runs in it, and the shared services it
depends on. Label every line that crosses an account with what it
carries.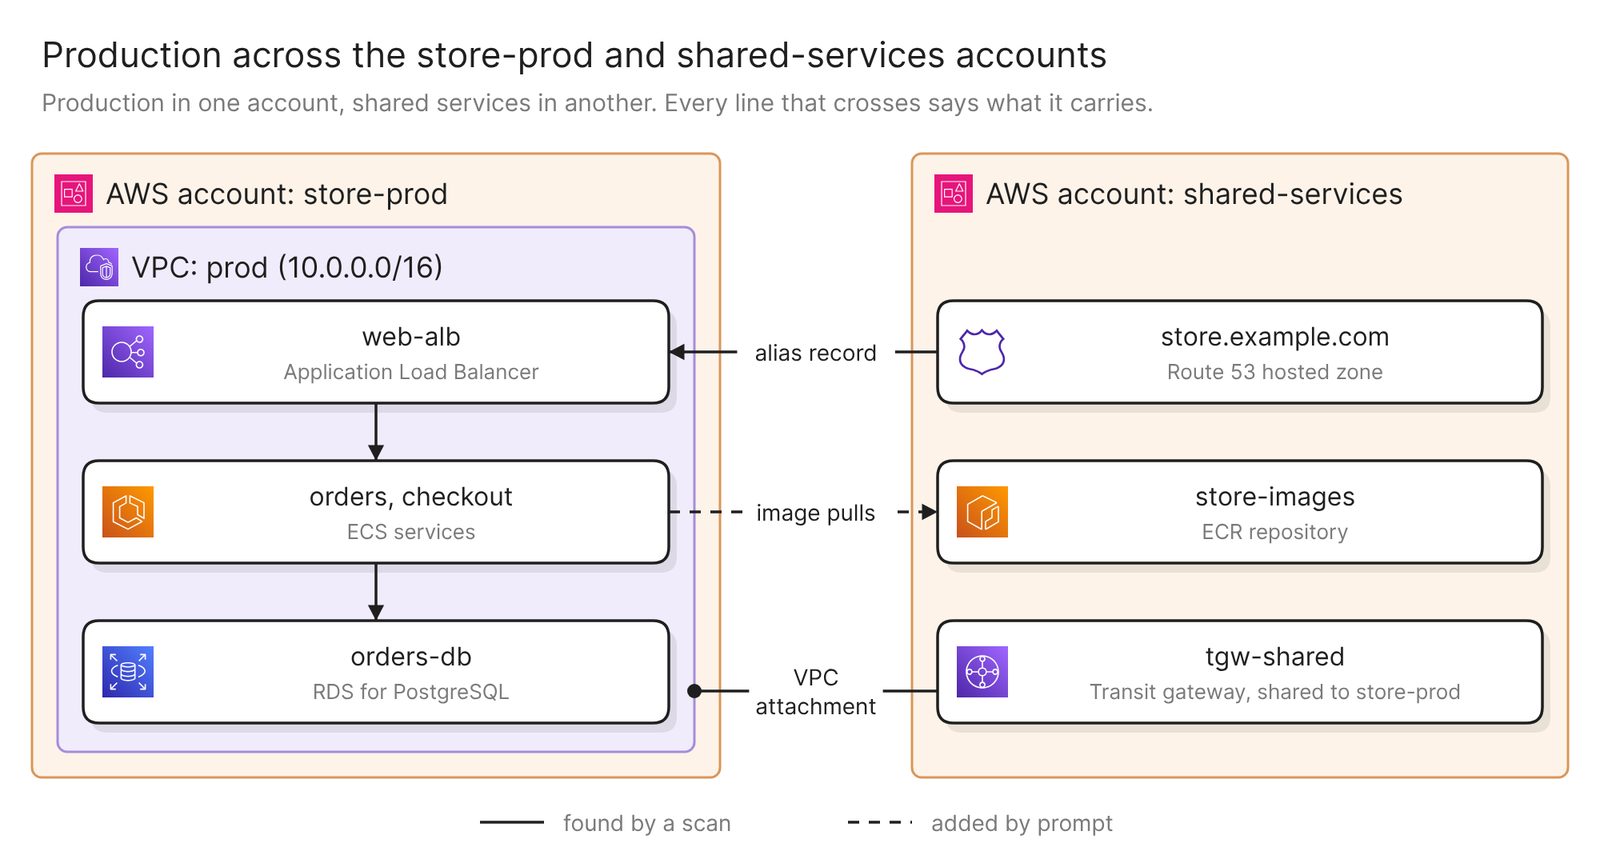 Example: production in one account and shared services in another, with the crossing added by prompt dashed
A landing zone splits an environment this way on purpose, so a diagram of one account always has loose ends. Both accounts are in one AWS model here, so start from the crossings the scan found. Do not count on it joining a service in one account to an image repository in another. Open the model and look, then add it as a dashed line.
An overview for leadership
Draw an overview of the same estate for a leadership review: one box per
workload, grouped by provider and account. Leave out subnets and single
resources. Keep the connections between workloads and label each with
what flows over it.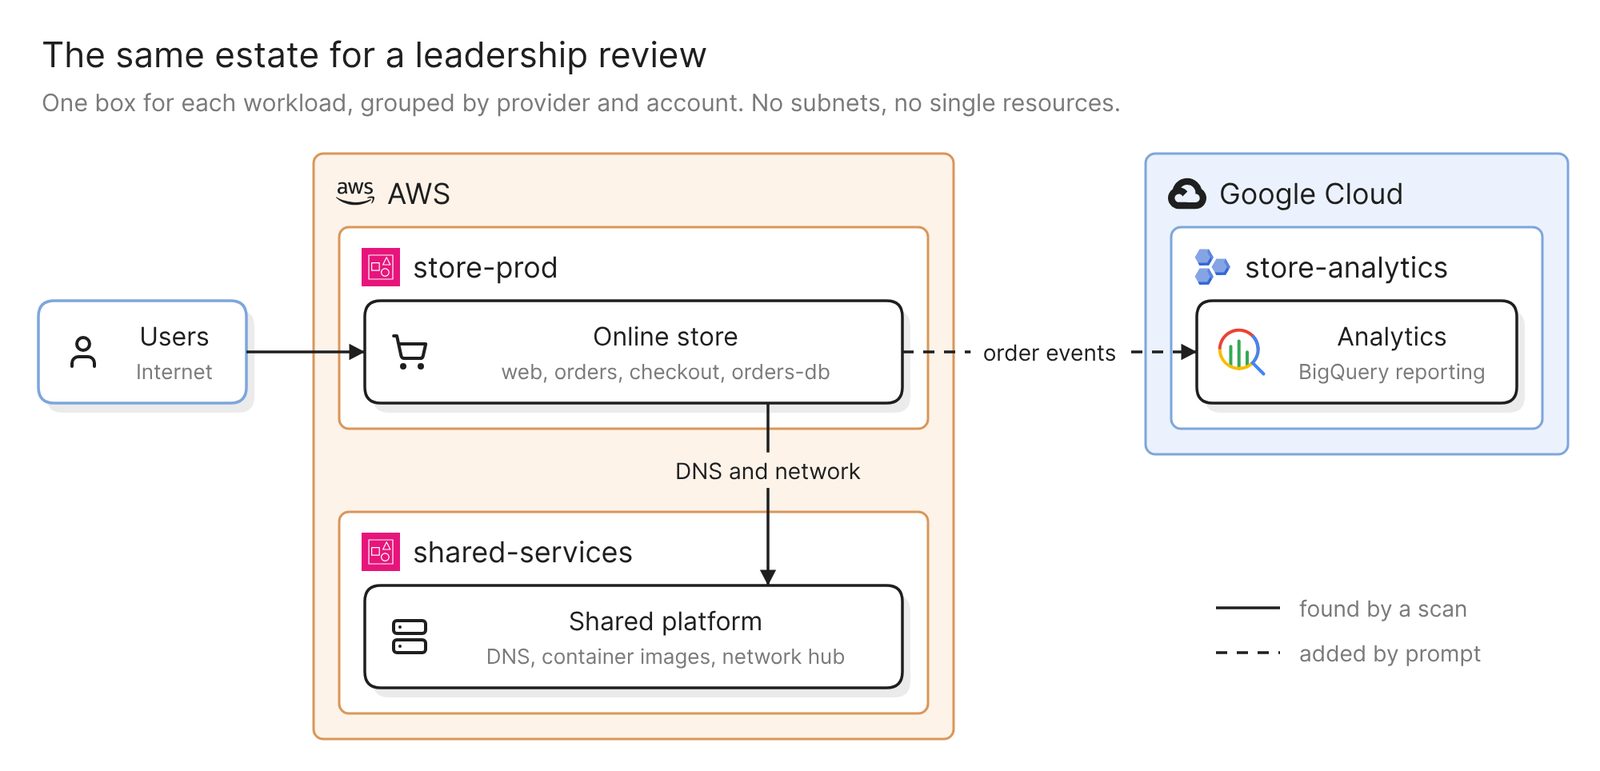 Example: the same estate with one box per workload
The detailed diagram is for the engineers who run the system. This one shows which providers the company depends on, and for what. Keep names identical on both. A map built from the same models holds both levels in one file, where a box opens the view below it.
Everything one team owns
Draw everything tagged team=payments across all three, grouped by
account or project. Outside the groups, list what it depends on that
another team owns.
This works when ownership is recorded on the resources, as a tag in AWS and Azure or a label in Google Cloud. Open each model and confirm the key is there, spelled the same way in every cloud. A resource with no tag is left off, so compare the result with what the team expects.
Keep it current
A diagram is as old as the scans behind it, and nothing scans on a schedule. Each connection rescans separately, so the two sides of a diagram can be weeks apart. Every model shows its last scan. After a change, rescan that side and regenerate, or run Verify, which checks a freeform diagram against its models and lists every issue without changing it. No model backs a line you added by prompt, so recheck those yourself.
Share the result with a link, embed it in Confluence or Notion, or export it as an image, a PDF or a Visio file.
To take access away, remove each connection in Eraser, then delete the identity you created in that cloud.
Other ways to make a cloud architecture diagram
- Use the providers’ own tools. Each console has views of its own cloud, and the provider guides in step 1 cover them. Across providers, Microsoft’s multicloud connector enabled by Azure Arc represents AWS resources in Azure, and as of November 2026 Google Cloud resources in preview, where Azure Resource Graph can query all three. It suits a team that already governs from Azure. What you get is an inventory, and drawing from it is a separate job.
- Write it as code. The open-source Diagrams library draws an architecture from Python, with node sets for AWS, Azure, GCP and more that one script can mix. It needs Python and Graphviz, and suits teams that review diagrams in pull requests. Its own page says it “does not control any actual cloud resources”, so it is as accurate as the code someone writes.
- Draw it by hand with the official icons. AWS, Microsoft and Google each publish an icon set, and draw.io has shape libraries for AWS and Google Cloud and for Azure. Choose this for a design that is not built yet. Nothing checks the drawing against any account.
Best cloud diagram tools in 2026 compares other tools that draw from a connected cloud.
FAQ
Can one diagram show AWS, Azure and Google Cloud together?
Yes. Attach each provider’s model to the same request, up to five. Ask for one top-level group per account, subscription or project, and add what crosses between providers by prompt.
How do I diagram several accounts at once?
Connect them together where you can, as an AWS organization, an Azure tenant, or a Google Cloud folder or organization. That one connection builds one model, and the prompt names the accounts you want.
How do I get a cloud infrastructure diagram instead?
Ask for the resources and the network: every VPC or virtual network, its subnets, and what is deployed in each. An architecture diagram shows how one system works and leaves most resources out.
Does the diagram update when my infrastructure changes?
Not on its own. Rescan the connection that changed, then regenerate the diagram or run Verify on it.
Where to go next
To draw a design that is not deployed yet, describe it to the architecture diagram generator. The AWS, Azure and Google Cloud generators do the same for one provider.
For reference architectures on each cloud, see Kubernetes on AWS, an e-commerce app on Azure and a three-tier web app on Google Cloud. The glossary’s cloud computing architecture page covers the parts every provider shares.