Guide
How to generate a Kubernetes diagram from your manifests
Connect the repository that holds your manifests, Helm charts or Kustomize overlays, then ask for the Kubernetes cluster diagram you need.
A Kubernetes diagram is hard to get because the system is described in dozens of YAML files and kubectl answers in lists. Someone has to read every Deployment, Service and Ingress, then work out which one points at which.
This guide starts from those files. You connect the repository that holds your manifests, Helm charts or Kustomize overlays, and ask for the diagram you need: a whole environment, one namespace or the path of one request. It takes about ten minutes, and the glossary’s Kubernetes architecture page explains any object that is new to you.
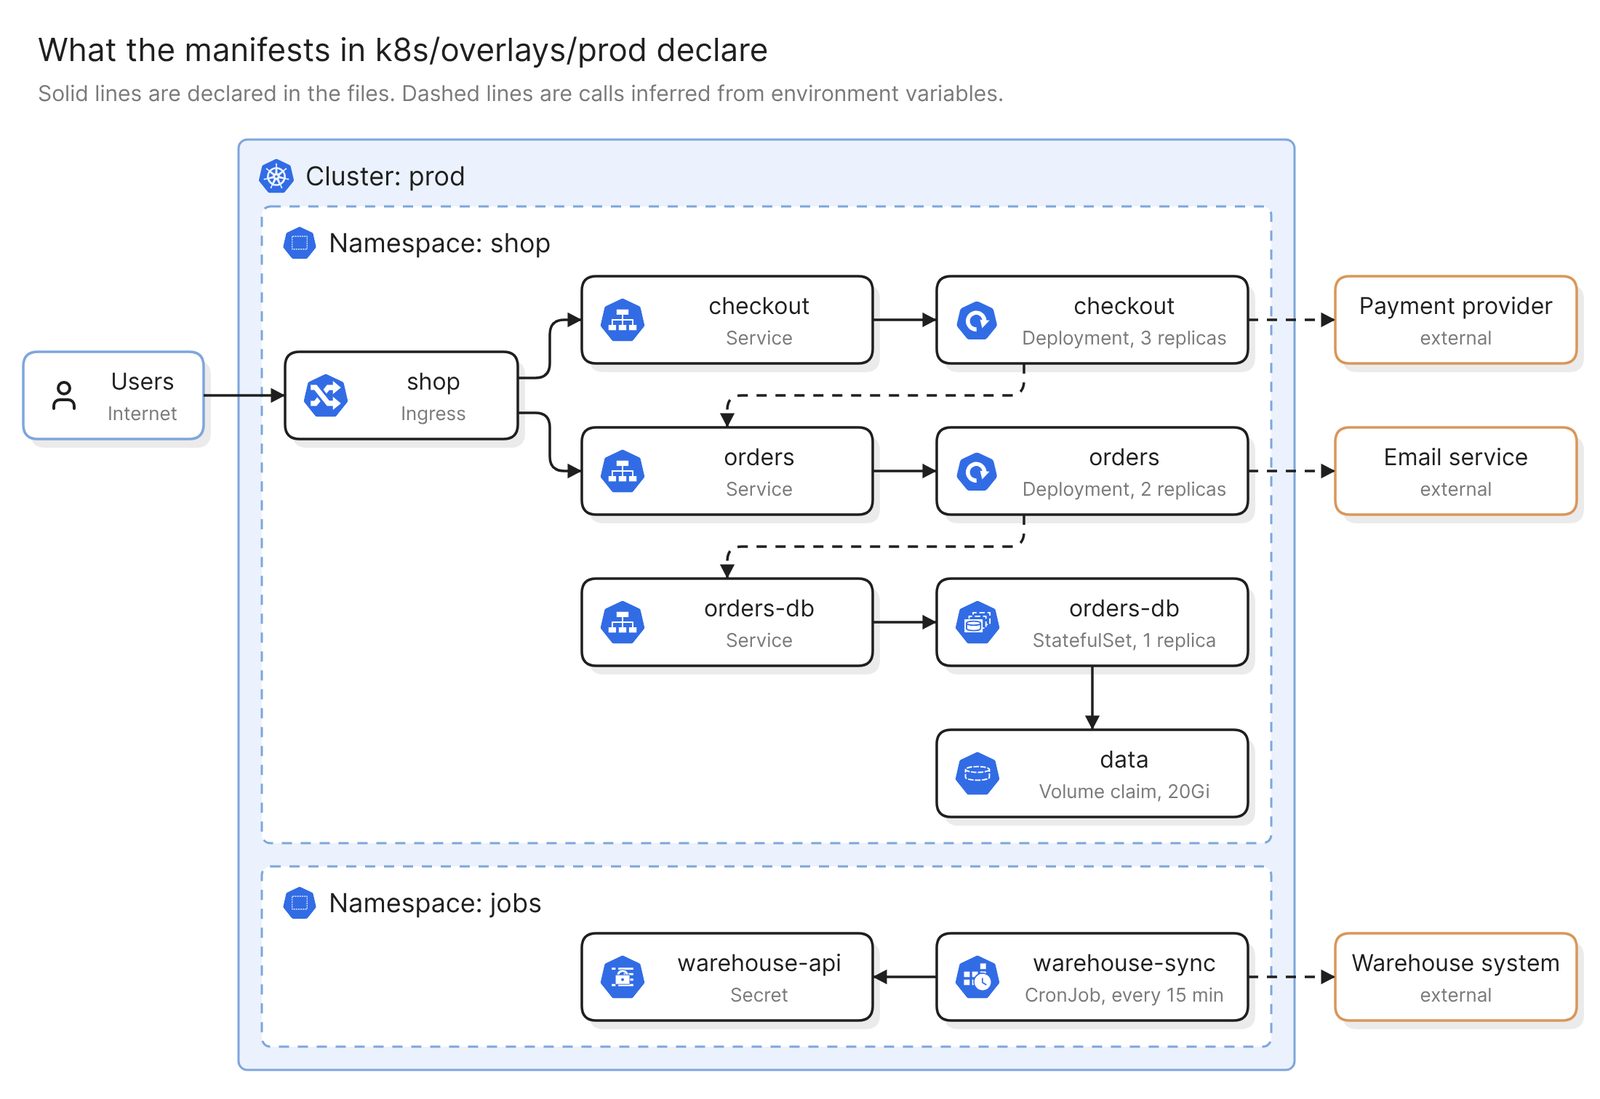 Example: what one repository declares for production, grouped by cluster and namespace
Before you start
You need two things:
- Access to Eraser
- Access to the repository that holds the manifests. A public repository needs no connection
Eraser has no connector into a running cluster. This method reads the files in the repository, so the diagram shows what is declared there, and anything applied by hand, installed from another repository or changed at runtime is missing.
Step 1. Connect the repository
For a private GitHub repository, you install the Eraser GitHub App and choose which repositories it can read. GitLab and Azure DevOps repositories connect with an access token instead. The docs have the steps for each.
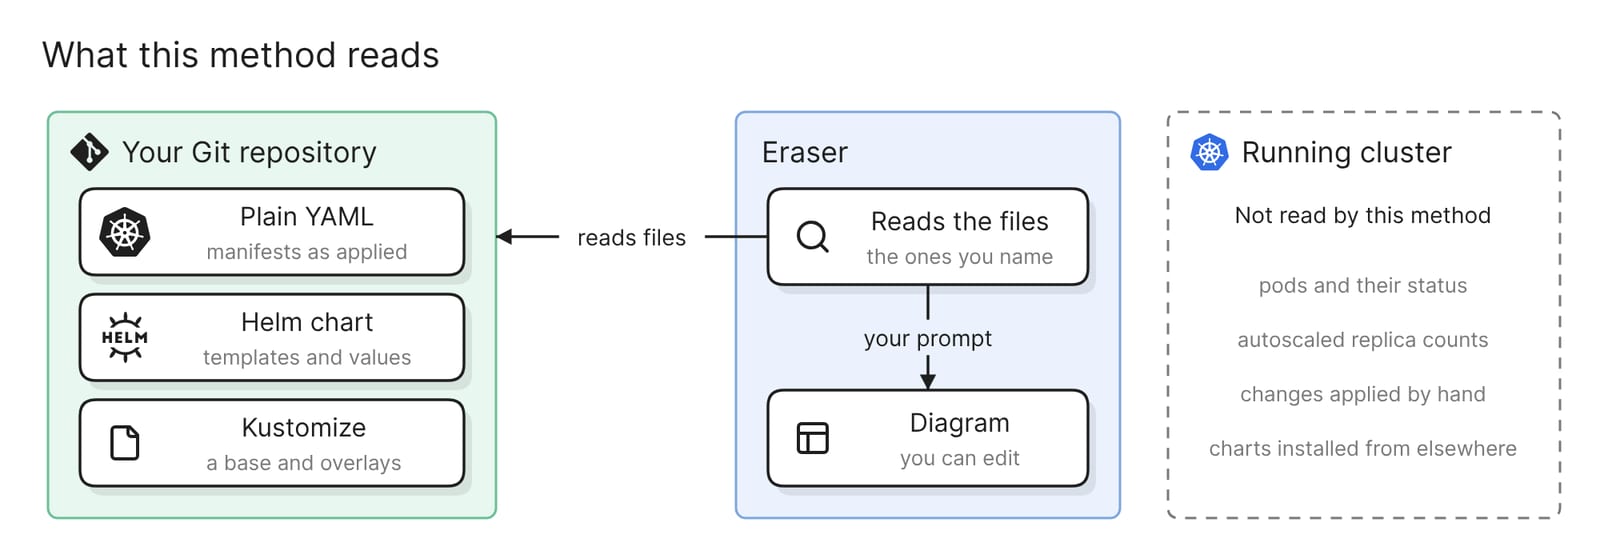 What this method reads, and what it does not
Step 2. Ask for the cluster diagram
Start a new AI diagram, attach the repository, and name the folder that holds the manifests:
Draw a Kubernetes diagram from the manifests in k8s/overlays/prod. Group
resources by namespace inside one cluster. Show each Ingress, Service,
Deployment and StatefulSet with its replica count, and connect them the
way the selectors and Ingress rules do.
Eraser reads the files and draws what they declare: the namespaces, the workloads in each, the Services in front of them and the Ingress at the edge. The result is an ordinary diagram, so you can move, rename and regroup anything on it.
The path in the prompt matters. If the repository holds several environments, a folder or file path says which one you mean.
A Helm chart or a Kustomize overlay needs one more decision. The repository holds templates and values, or a base and patches, and the final manifests exist only once Helm or Kustomize renders them. Name the values file or the overlay for the environment you want. Values passed at install time with --set, or kept outside the repository, are not there to be read.
When the exact output matters, render it first. helm template and kubectl kustomize both print the final manifests, and you can upload that YAML file in place of the repository. Take Secret values out first, because an uploaded file is sent to the AI in full.
Step 3. Check the lines against the files
Check the lines before the boxes. A diagram drawn from manifests has two kinds of line.
Some are declared. An Ingress rule names a Service, and a Service finds its pods through a label selector. Compare each with the file. A Service whose selector matches no workload is a finding worth raising.
Others are inferred. No manifest states that checkout calls orders. A line like that comes from an environment variable, a ConfigMap or a NetworkPolicy, so trace each one to a file and delete the ones you cannot. The example at the top draws them dashed for that reason.
Then look for what is missing. Replica counts are the numbers in the files, and a HorizontalPodAutoscaler changes them in the cluster. An ingress controller or monitoring stack installed from another repository is absent. So is the sidecar that a service mesh can inject into each pod as it is created.
A cloud load balancer and any managed database belong to the cloud account. If the cluster is managed, a scan of that account fills in this side. An EKS, AKS or GKE cluster appears there with its node groups and the network around it, without the workloads inside. The guides for AWS and Azure cover that route.
Narrow it to the diagram you need
Each of these prompts gives a different diagram from the same repository.
One namespace
Draw only the shop namespace from k8s/overlays/prod, with every workload
and Service in it
This is the diagram for the team that owns the namespace, and the fix for a Kubernetes cluster diagram that came out too dense to read.
The path of a request
Trace a request for shop.example.com/checkout through the manifests in
k8s/overlays/prod: the Ingress rule, the Service, the Deployment and its
pods. Label each hop with the host, path and ports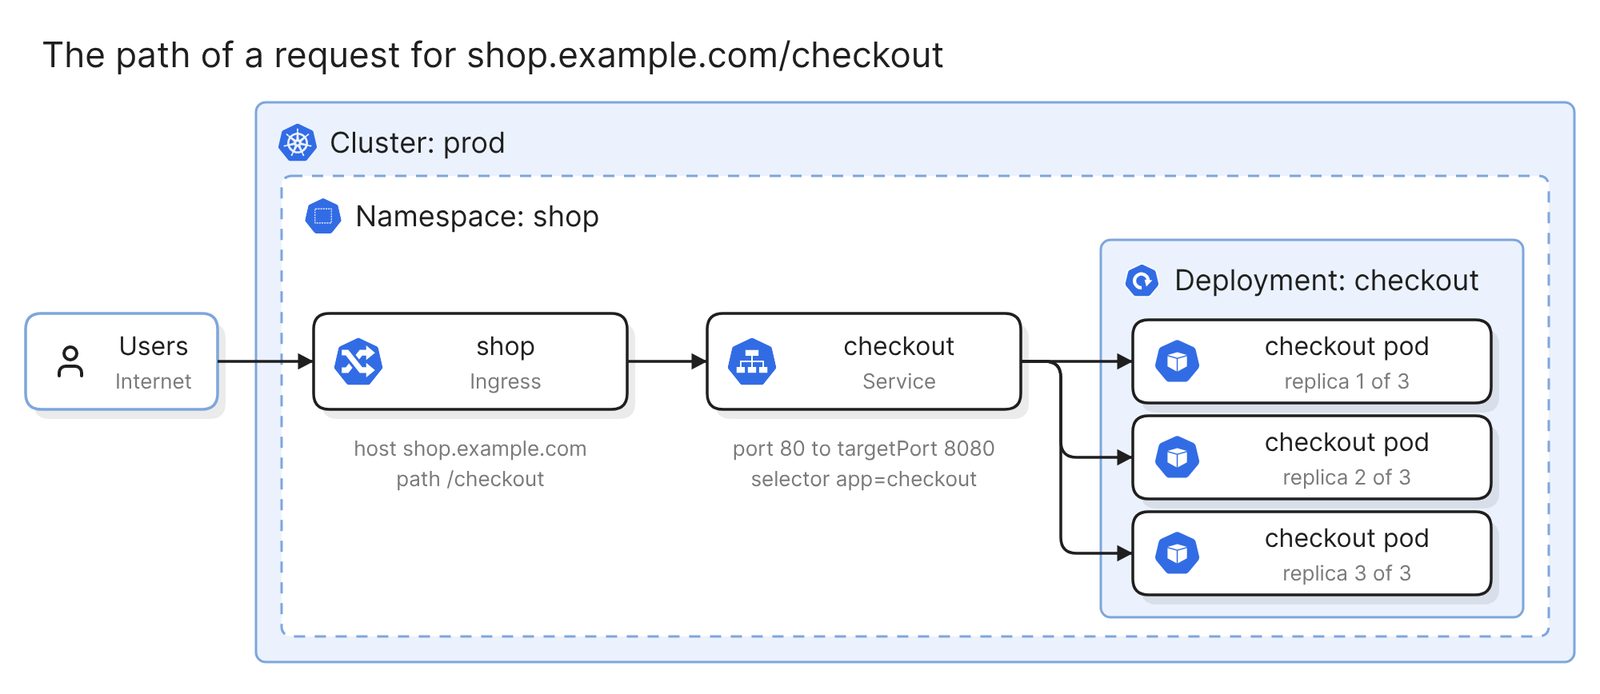 Example: one request, from the Ingress rule to the pods behind the Service
This is the diagram for an incident and for onboarding. Every label on it is a field in a manifest, so it is quick to verify. The pods are drawn from the replica count, because the cluster creates the pods themselves.
Configuration and storage
Show the orders Deployment and the orders-db StatefulSet with every
ConfigMap, Secret and volume claim they mount or read. Use names only,
no values
Useful before rotating a credential or moving a database, because it shows which workloads share a Secret.
What the NetworkPolicies allow
Draw which pods can reach which according to the NetworkPolicies in
k8s/base. Label each connection with its port, and mark any workload
that no policy selects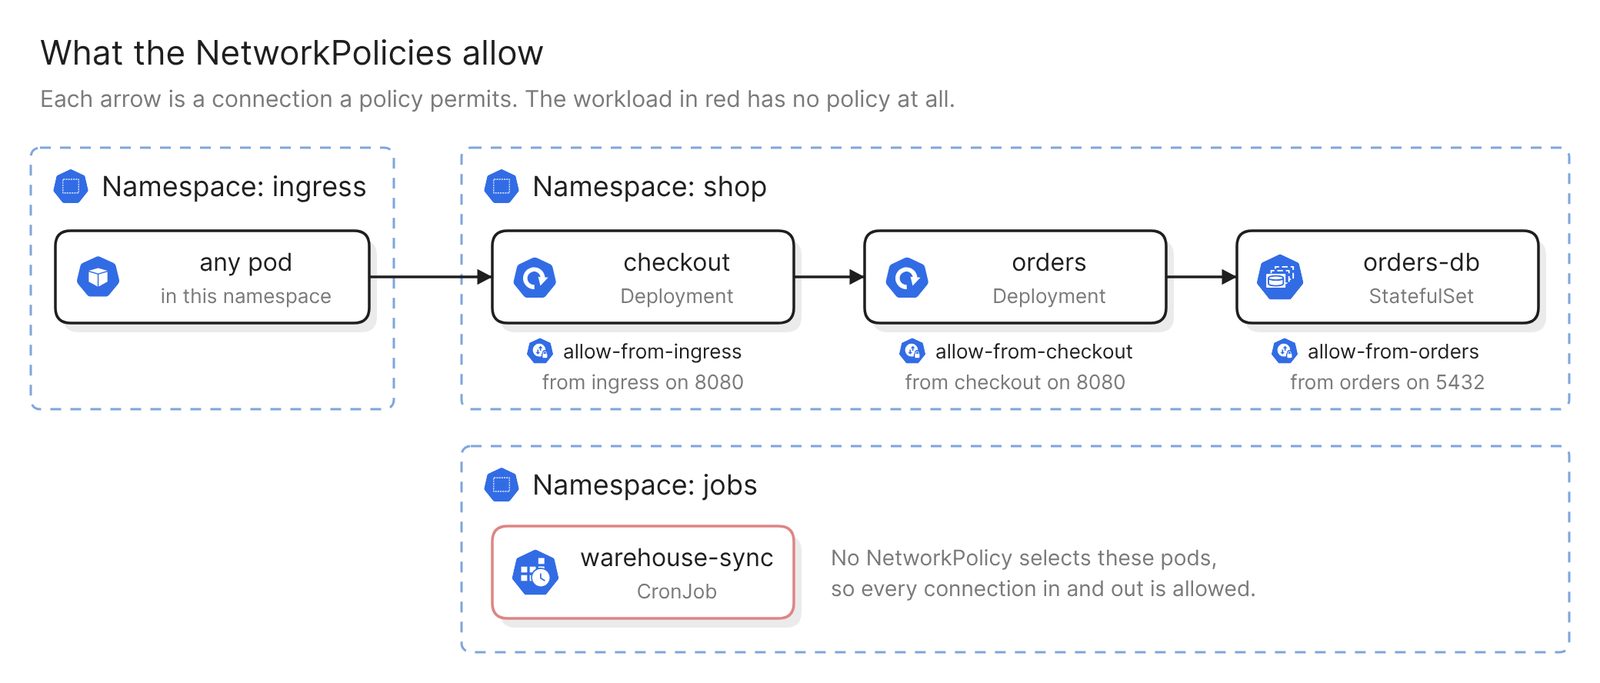 Example: the connections the policies permit, with the unprotected workload in red
This is the diagram for a security review, and two rules from the Kubernetes docs shape how to read it. A pod that no policy selects is “non-isolated”, so every connection to it is allowed. A policy also has no effect unless the cluster’s network plugin enforces it, and these files do not say which plugin that is.
From any of these, keep prompting to add, drop or regroup.
Keep it current
The diagram matches the files as they were when you asked. Eraserbot keeps it that way. You give it the prompt and the manifest folders to watch. When a pull request changes those files, Eraserbot redraws the diagram and posts it as a comment within a minute or two. The saved diagram updates when the pull request merges. It works with GitHub and GitLab, and on GitHub you can also commit the diagram file to the repository.
A finished diagram can be shared with a link, embedded in the wiki your team already uses, or exported as an image or a PDF.
Other ways to make a Kubernetes diagram
- Look at the live cluster. Headlamp, a Kubernetes SIG UI sub-project, has a Map view that shows cluster resources as a graph. KubeView draws resources and their relationships in a read-only view that updates as they change. Both are maintained as of November 2026, while the older Kubernetes Dashboard was archived in January 2026. This is the right choice when the question is what is running now. Each tool needs access to the cluster.
- Generate it with an open-source tool. KubeDiagrams generates architecture diagrams from “manifest files, kustomization files, Helm charts, helmfile descriptors, and actual cluster state”. It is Apache 2.0 licensed and needs Python 3.9 or higher and Graphviz. It suits a CI job that should give the same picture from the same files every time. Narrowing or regrouping that picture is done with flags and a configuration file.
- Draw it by hand with the official icons. The Kubernetes community publishes an icon set as “a way to standardize Kubernetes architecture diagrams for presentation”. draw.io includes a Kubernetes icon library. This is the right choice for a design that is not deployed yet. Nothing checks the drawing against the manifests.
For a wider look at text-based tools, see Best diagram-as-code tools in 2025.
FAQ
Can Eraser connect to a running Kubernetes cluster?
No. Eraser has no connector into a cluster, so it draws from manifests in a repository or from an uploaded YAML file. To draw live state, export it with kubectl get deployments,services,ingresses -n shop -o yaml, leave Secrets out, and upload the file.
Does this work with Helm charts and Kustomize overlays?
Yes, as files in the repository. Eraser reads the templates and values, or the base and patches, so name the values file or overlay you want. For the exact rendered output, run helm template or kubectl kustomize first and upload the result.
Why does the diagram differ from what kubectl shows?
The diagram is drawn from files, and the cluster has moved on from them. Autoscalers change replica counts, people apply changes by hand, and other repositories install their own resources.
How do I keep the diagram in sync with the manifests?
Set up Eraserbot with the prompt and the folders the diagram depends on. It redraws the diagram when a pull request changes those files, on GitHub and GitLab.
Where to go next
To try it without connecting anything, the Kubernetes diagram generator draws a diagram from a description or a pasted manifest. For reference diagrams, see Kubernetes cluster architecture, exposed pods with replicas and Kubernetes on AWS.
For the ideas behind the boxes, the glossary covers Kubernetes architecture and container orchestration. The same method draws C4 diagrams from a repository. If the cluster itself is defined in Terraform, see Terraform architecture diagram.