Guide
Terraform graph: visualize .tf files as an architecture diagram
Run terraform graph for the dependency graph, then upload your .tf or .tfstate files to Eraser and ask for an architecture diagram you can edit.
terraform graph is the obvious first thing to try when you want a picture of your Terraform. It prints every resource and every dependency between them, which is what Terraform needs to order its work and more than a person can read. The picture of the network and what runs in it stays in someone’s head.
This guide covers the command briefly, then a second route: upload the configuration or the state file to Eraser and ask for the architecture diagram in plain words. That part takes about five minutes.
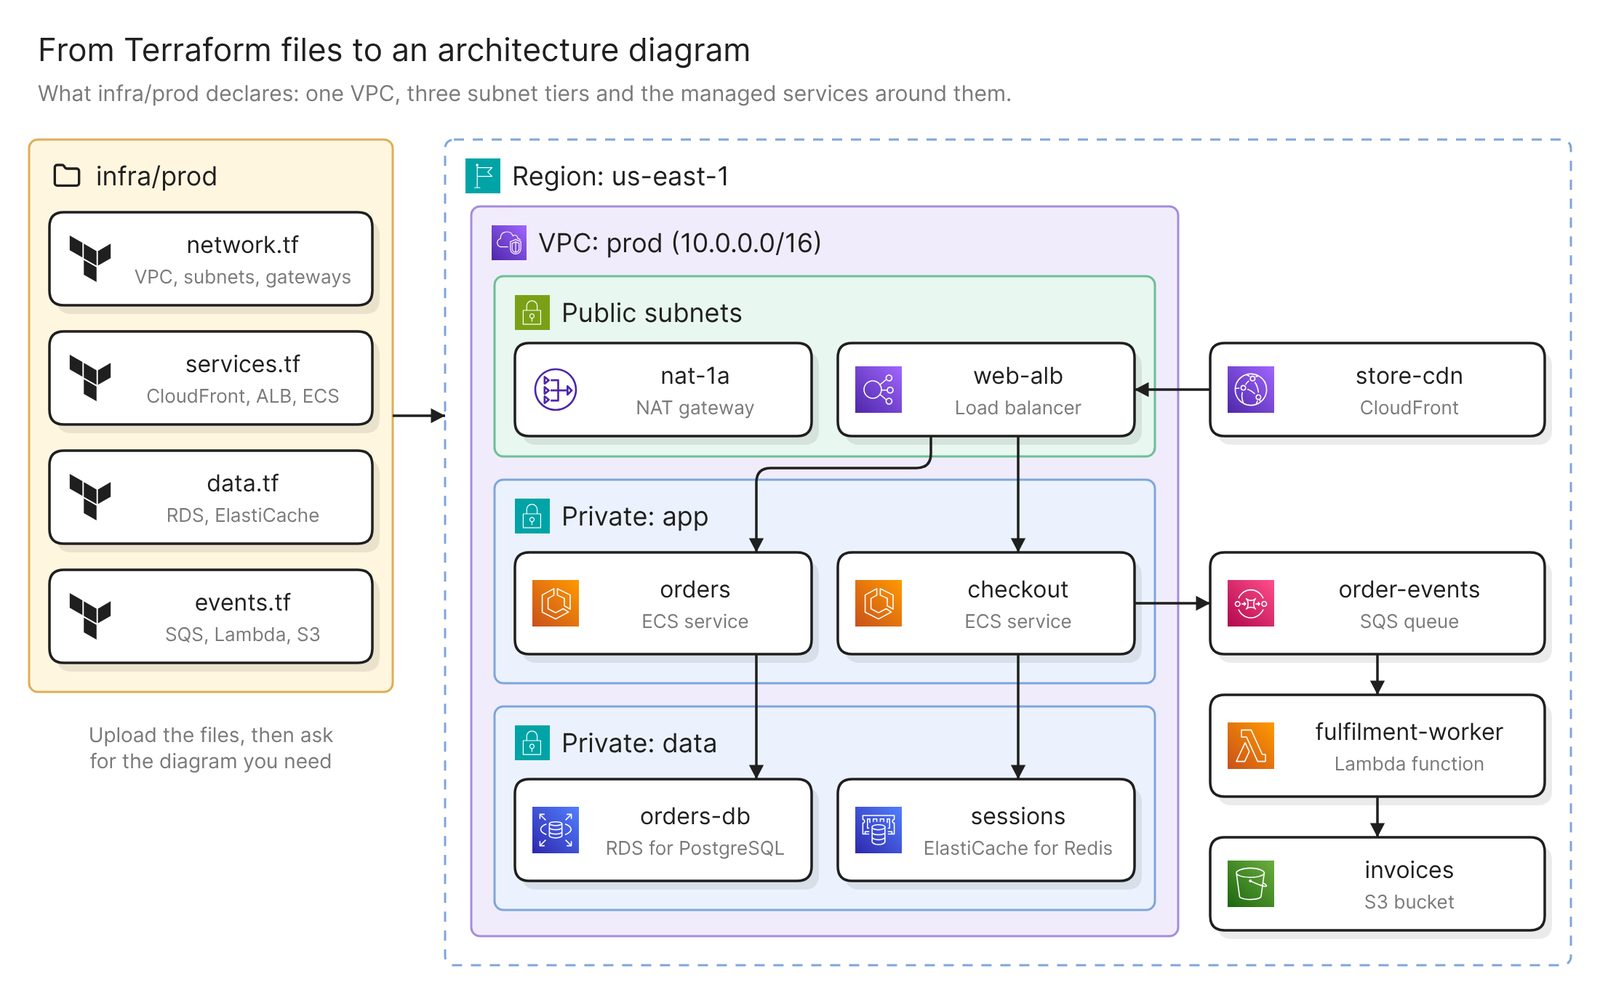 Example: four Terraform files and the architecture they declare, grouped by VPC and subnet
Before you start
You need two things, and a third for the first section:
- Access to Eraser
- The Terraform you want to draw: the
.tffiles, or a state file (.tfstate) - For the
terraform graphsection only, the Terraform CLI and Graphviz
Eraser reads the files you upload and nothing else. Resources built outside Terraform are missing, and so is anything the files never mention, such as a payment provider.
What terraform graph gives you
The command is part of the Terraform CLI. It prints a graph in the DOT language, and Graphviz turns that into an image:
terraform graph | dot -Tpng > graph.pngBy default the output is, in HashiCorp’s words, “a simplified graph which describes only the dependency ordering of the resources (resource and data blocks) in the configuration”. The -type option selects the more detailed graph for one operation, and with it -draw-cycles highlights cycles.
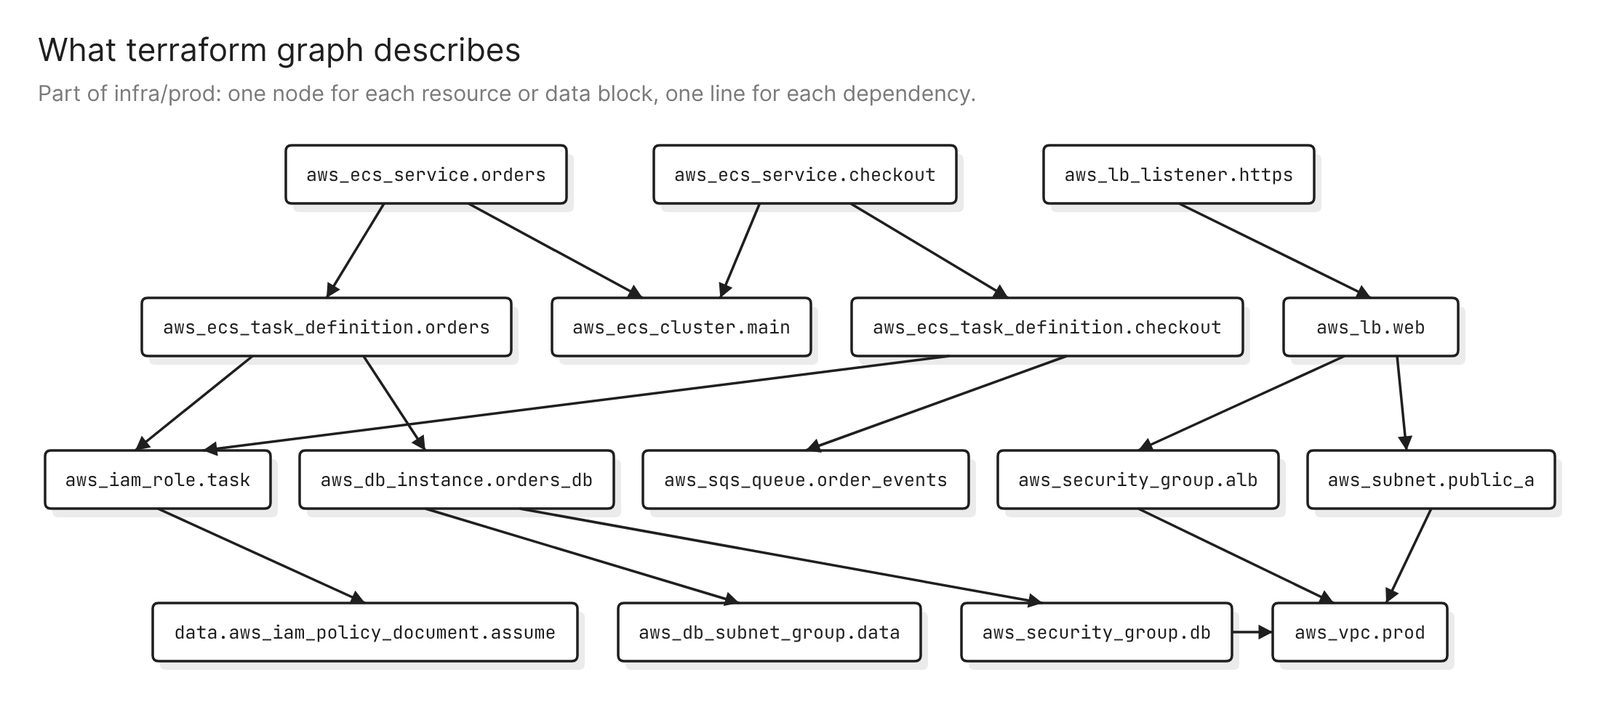 Example: part of the same configuration as a dependency graph
It is the right tool for a question about ordering, such as why one resource is created before another. It stops there. The output is a dependency graph, so a subnet is one more node beside the services that run in it, and an IAM role gets the same weight as the database.
Step 1. Choose the code or the state, and upload it
The code (.tf files) is what is declared. It includes resources nobody has applied yet, so it is the right input for a design review or a pull request. Values that come from variables are not filled in.
The state (.tfstate) is what Terraform applied. It maps real resources to your configuration, including the resources inside modules, so it is the right input for documenting an environment that exists. If the state is remote, terraform state pull > prod.tfstate writes a copy to a file.
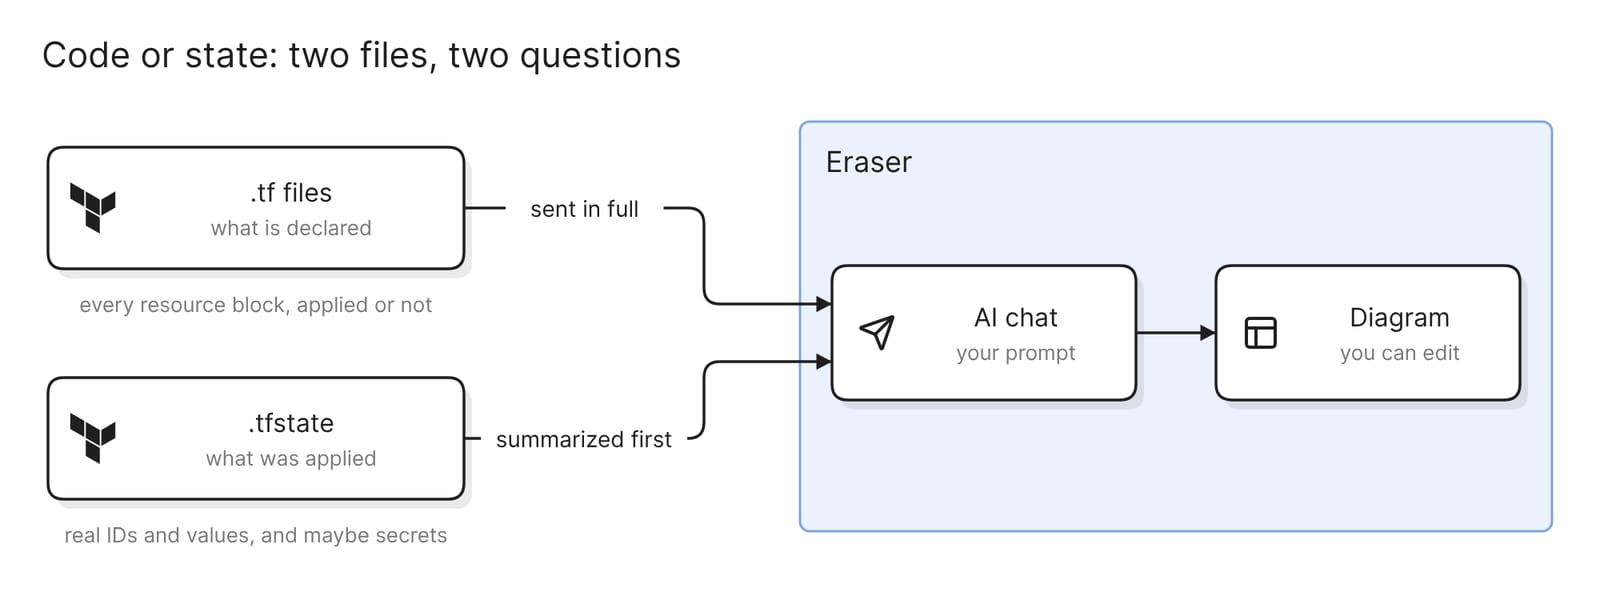 What each file holds, and how it reaches the diagram
State files can contain secrets. HashiCorp says state holds “resource attributes and metadata that can contain sensitive values, such as initial database passwords or API tokens”, and that a local state file is plaintext. Keep any copy out of Git and delete it when you are done.
On the Eraser side, a state file is summarized before it reaches the AI. .tf files are sent in full, so take out hard-coded secrets first. .tfvars files are not accepted.
To upload, open AI chat and attach the files, up to 10 MB each. The docs list the supported file types and have the click-by-click steps.
Two other routes start elsewhere. If the Terraform is in a connected Git repository, Eraser can read the folder directly. To draw what is running instead of what Terraform says, connect the cloud account, as the AWS and Azure guides do.
Step 2. Ask for the architecture diagram
With the files attached, say what you want and what to leave out:
Draw an AWS architecture diagram of this Terraform. Group resources by
VPC and subnet, show which services connect to which, and leave out IAM
roles, policies and security group rules.
The diagram shows the VPC with its subnets, the services inside them and the managed services around the VPC. It is an ordinary diagram, so you can move, rename and regroup anything on it, by hand or with another prompt.
The second half of the prompt matters as much as the first. Terraform declares many resources an architecture diagram has no box for, such as policy attachments and route table associations. Naming them keeps the diagram to the resources people ask about.
Step 3. Check it against the Terraform
Treat the first result as a draft and check four things.
Start with coverage. Every service, data store, queue and load balancer in the files should be a box, and terraform state list prints every resource in the state to check against.
Then placement. Check that each resource sits in the subnet the code puts it in. A subnet is often passed through a variable or a module output, which makes it the easiest thing to get wrong.
Then the lines. Each should trace back to a reference in the code, such as a target group, an event source mapping or an environment variable that holds a queue URL. Delete a line you cannot trace.
Last, what cannot be there. External systems, resources created by hand and anything in another state file are not in the upload. Add the ones the diagram needs with a prompt.
Other diagrams from the same files
Each of these prompts asks for a different diagram of the same Terraform.
The network layer only
Draw only the network: the VPC, subnets, gateways and route tables in
module.network, with CIDR ranges and availability zones
This is the diagram for a network review, and naming a module is the quickest way to cut a large configuration down.
What differs between two environments
Attach the state file for each environment, then ask:
Compare staging.tfstate and prod.tfstate. Draw both environments side by
side and highlight resources that exist in only one, or that differ in
size, count or Multi-AZ setting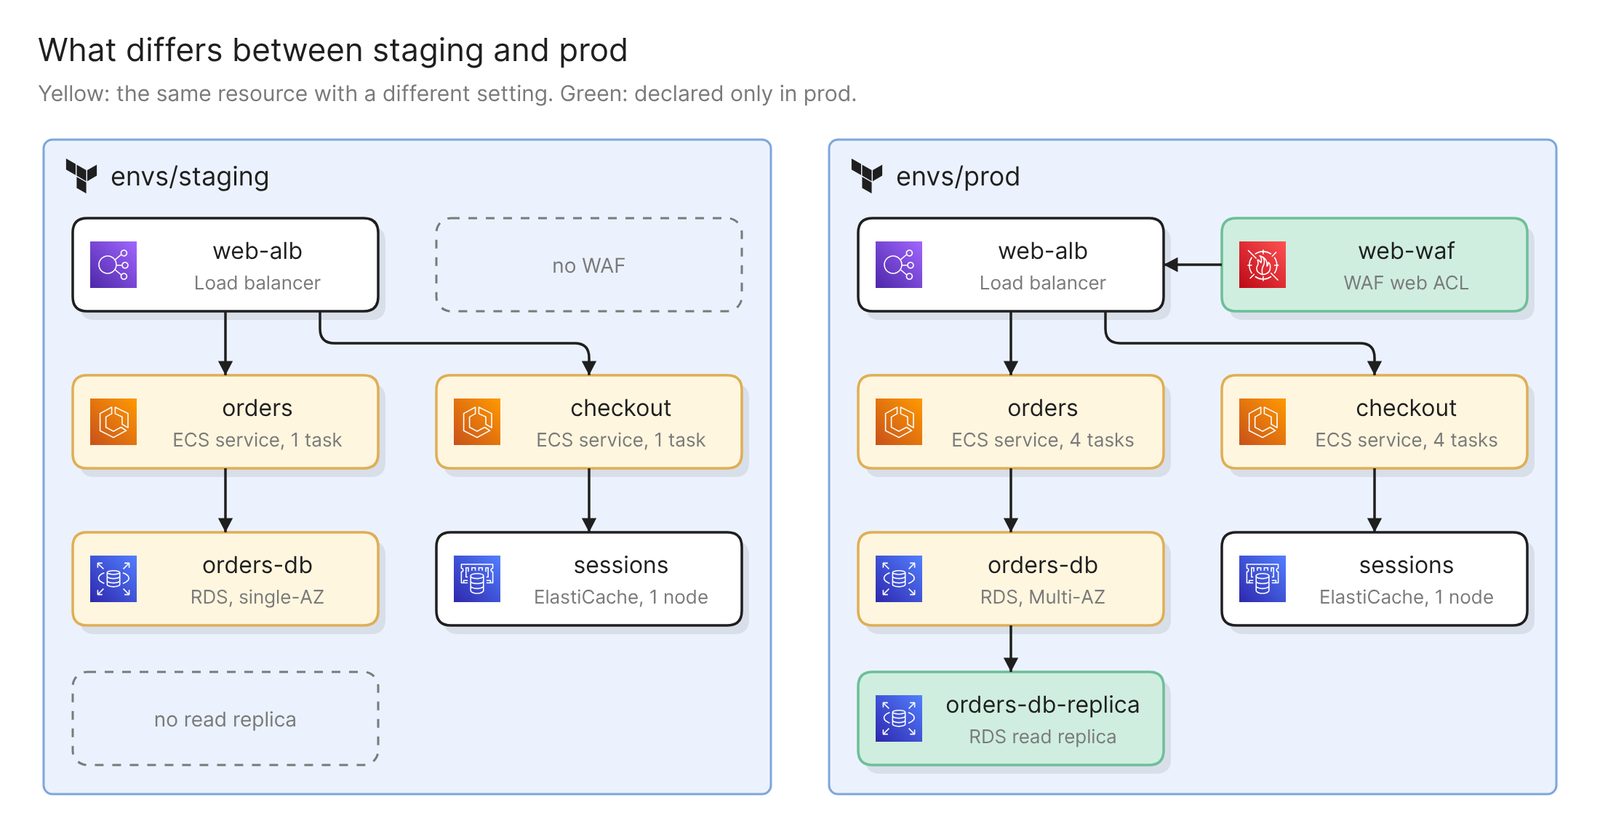 Example: staging and prod side by side, with the differences highlighted
State suits this better than code. Environments often share modules and differ only in variable values, which the .tf files alone do not show.
A data-flow view for a security review
Draw a data flow diagram of the checkout path. Label each arrow with the
data it carries. Add the payment provider, the email service and the
warehouse system as external systems, and mark where data leaves the VPC.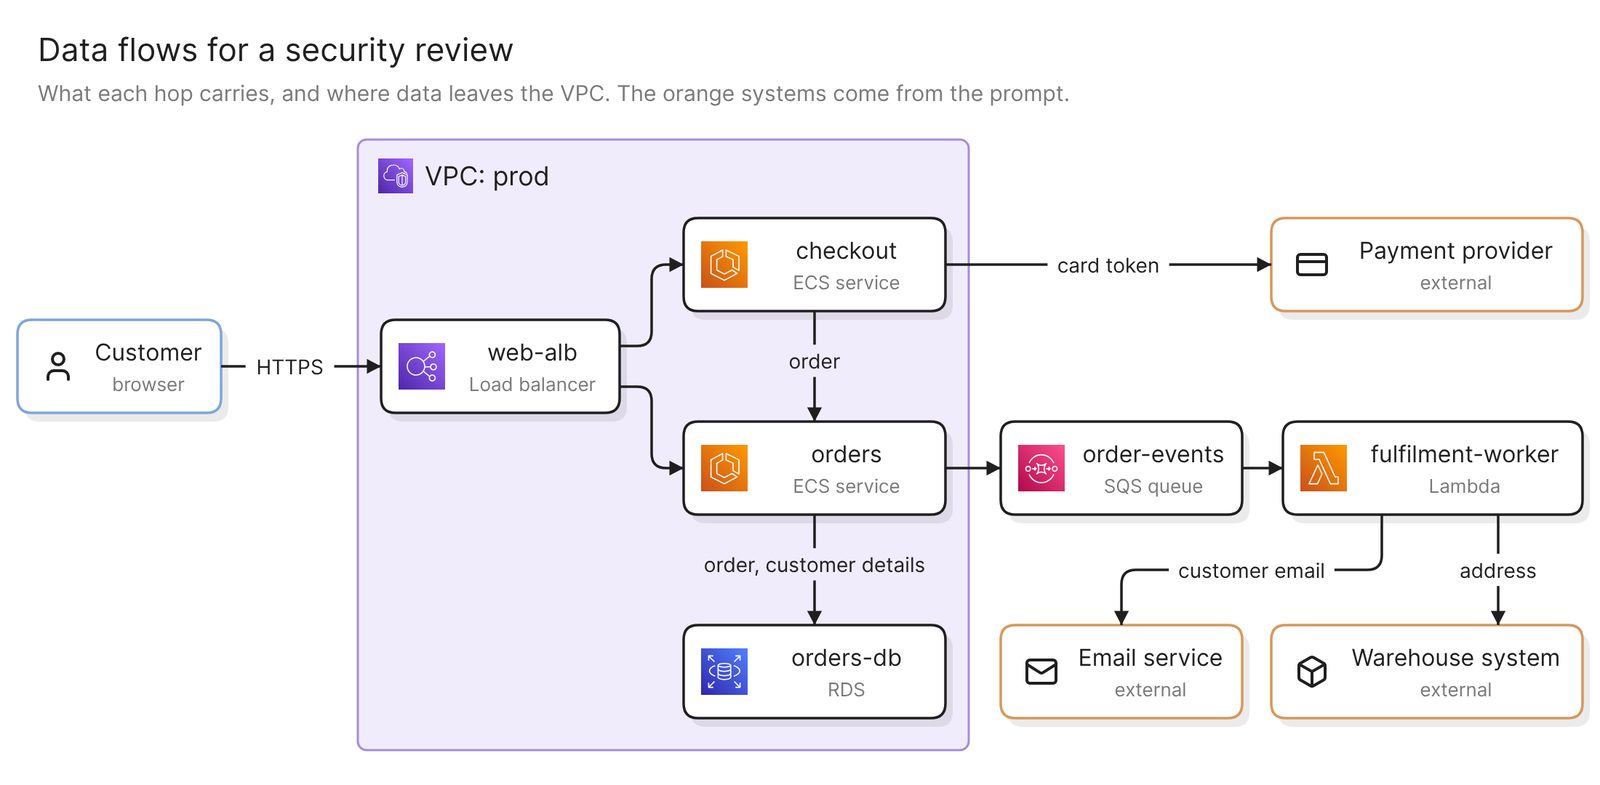 Example: the checkout path as a data flow, with the external systems the prompt named
Terraform knows ports and permissions, not payloads. Treat the labels on a data flow diagram as a first guess and correct them.
Keep it current
An uploaded file is a snapshot. When the Terraform changes, upload the new files and ask again.
If the configuration is in a connected Git repository, Eraserbot can do this for you. It watches the files you name. When a pull request changes them, it posts the redrawn diagram as a comment, and the saved diagram updates on merge. It works with GitHub and GitLab. The docs cover setup.
A finished diagram can be shared with a link, embedded in your docs, or exported as an image or a PDF.
Other ways to visualize Terraform
- Use an open-source visualizer. As of November 2026, two are maintained. TerraVision (last release October 2026) draws AWS, Azure and Google Cloud diagrams from
terraform plan, and needs Python, Graphviz and Terraform. InfraMap (last release April 2026) prints a simplified graph from state or HCL for Graphviz. Both run on your own machine, which suits code that cannot go to a hosted service. Rover (last release July 2022) and Blast Radius (last commit January 2020) still turn up in older posts. - Use HCP Terraform. HashiCorp’s Infragraph is a resource graph you query and browse in a graph explorer. As of November 2026 it is in limited availability for Standard and Premium customers on US instances. It is the better choice when the question spans a whole organization. Its docs list real-time updates and adding your own nodes and edges as unsupported.
- Ask your coding agent. An agent such as Claude Code or Cursor can read the Terraform in your working directory and draw through a diagramming MCP server. Best diagramming MCP servers in 2026 compares them.
FAQ
Is terraform graph enough to make an architecture diagram?
No. It shows dependency order, with every resource and data block as a node of equal weight and nothing grouped by network or service.
Should I upload the .tf files or the state file?
Upload the .tf files to review a design or a change before it is applied. Upload the state file to document what is deployed.
What happens to secrets in a state file I upload?
Eraser summarizes a state file before it reaches the AI. .tf files are sent in full, so remove hard-coded secrets first. .tfvars files are not accepted.
Does the diagram show drift, or resources created by hand?
No. The code and the state only cover what Terraform manages. Best cloud diagram tools in 2026 compares tools that read the live account.
Is there a free Terraform visualizer?
Yes. terraform graph ships with the Terraform CLI, and TerraVision and InfraMap are open source.
Where to go next
To try it without a file, the Terraform diagram generator draws from a pasted snippet or a plain-English description. For reference diagrams, see Kubernetes on AWS and the Landing Zone Accelerator.
The glossary covers infrastructure as code and the deployment diagram. For the repository route, see the guides to C4 diagrams from a GitHub repo and Kubernetes diagrams from manifests.