Cloud and DevOps
Observability
Observability is the ability to understand what a system is doing from the logs, metrics and traces it emits, well enough to debug problems nobody predicted.
Teams invest in observability when a request crosses six services and “the site is slow” stops being a question any one dashboard can answer. The goal is to ask the system what it was doing at 14:32 for one customer and get an answer from data it already emitted.
Why does observability matter?
- Debugging the unknown. Monitoring catches the failures you predicted; observability covers the ones you did not.
- Distributed systems. In a microservices architecture one request touches many processes, and only a trace shows which one was slow.
What are the three pillars of observability?
| Signal | What it is | Answers |
|---|---|---|
| Logs | Timestamped event records, ideally structured as key-value pairs | What happened, in detail, at this moment |
| Metrics | Numbers aggregated over time: counters, gauges, histograms | How much, how fast, how often, over time |
| Traces | One request as a tree of timed spans across services | Where the time went and which service failed |
- Logs are the most detailed signal. A trace id in every line is what makes them linkable.
- Metrics are cheap to store and fast to query, which makes them the basis of dashboards and alerts. Start with request rate, error rate, latency distribution and saturation.
- Traces are the signal distributed systems added. A trace id is created at the edge, usually the load balancer or gateway, and passed in headers to every downstream call, and each service records a span with its start, duration and parent.
What are the parts of an observability pipeline?
- Instrumentation. SDKs in each service, usually OpenTelemetry’s, that create spans, record metrics and write structured logs. Auto-instrumentation covers HTTP, database and queue clients; manual spans cover business logic.
- Collector. An agent or sidecar that receives signals, batches them, adds metadata such as the deployment version, samples traces and exports to the backend.
- Backend. Storage and query for each signal.
- Dashboards and alerts. Views of the metrics that matter, and rules that page a person when a service level objective is at risk.
- Correlation. Shared ids, so a dashboard panel links to its traces and a trace links to its logs.
How do you read an observability diagram?
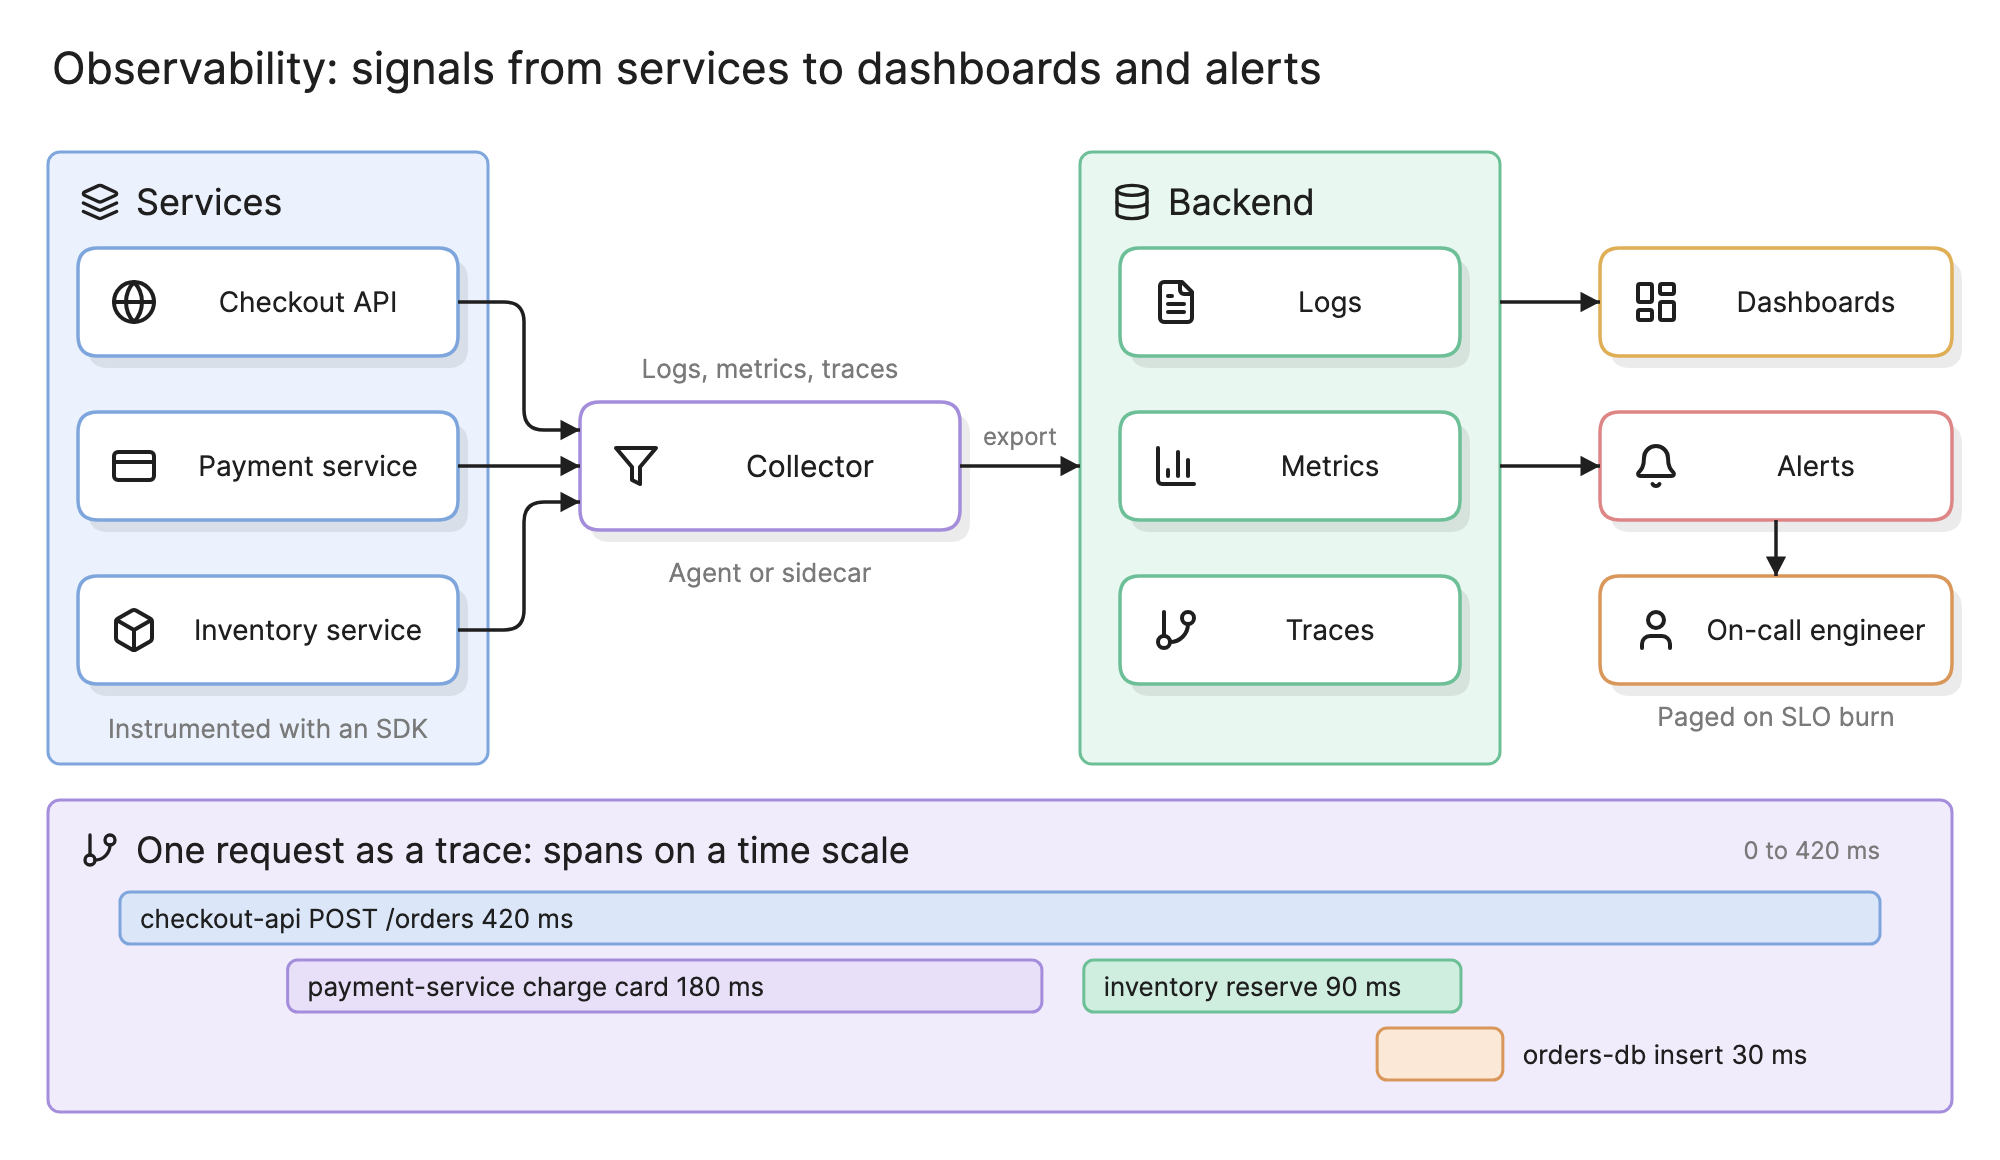
Start at the services on the left of the diagram at the top of this page. Each is instrumented with an SDK and sends logs, metrics and traces to a collector, which exports them to a backend with a store for each signal. On the right, dashboards query the backend for humans to read, and alert rules query it continuously and page the on-call engineer when an objective is at risk.
The bottom group is one request as a trace. The top span is the checkout API handling a POST to /orders over 420 milliseconds. Inside it, the payment service spent 180 milliseconds charging the card, the inventory service spent 90 reserving stock and a database insert took 30. Reading a trace this way shows at a glance that payment is where the latency lives, which no single service’s metrics would reveal.
How do SLOs and alerting work?
- Pick a service level indicator (SLI). A measurable ratio of good events to total, such as requests that succeed within 300 milliseconds.
- Set the objective (SLO). The target over a window, such as 99.9 percent over 30 days.
- Derive the error budget. The 0.1 percent of requests allowed to fail, about 43 minutes of full outage a month.
- Alert on burn rate. Page when the budget is being spent fast enough to run out before the window ends, and open a ticket for slow burns. This replaces dozens of threshold alerts with two that fire when users are affected.
How do you add observability to a system?
- Instrument with the standard SDKs and propagate the trace id through every call, queue message and job.
- Structure the logs with the trace id in every line, and emit rate, errors, latency and saturation per service.
- Run a collector, deployed with infrastructure as code, and export to a backend; sample traces at the collector, not in the application.
- Build one dashboard per service from the same template.
- Define SLOs and burn-rate alerts for the user-facing paths.
- Draw the pipeline. An architecture diagram of the pipeline and a sequence diagram of a traced request show new engineers where the data comes from.
What are common observability mistakes?
- Alerting on causes instead of symptoms. CPU at 90 percent is not an incident; users getting errors is.
- High-cardinality metric labels. A user id as a label creates a time series per user and takes the metrics store down.
How does observability compare with monitoring?
| Monitoring | Observability | |
|---|---|---|
| Questions | Known in advance | New ones, asked during the incident |
| Data | Predefined checks and thresholds | Rich signals with shared ids |
| Finds | Failures you predicted | Failures you did not |
Monitoring is one use of an observable system; alerting is where the two meet.
How does observability relate to other concepts?
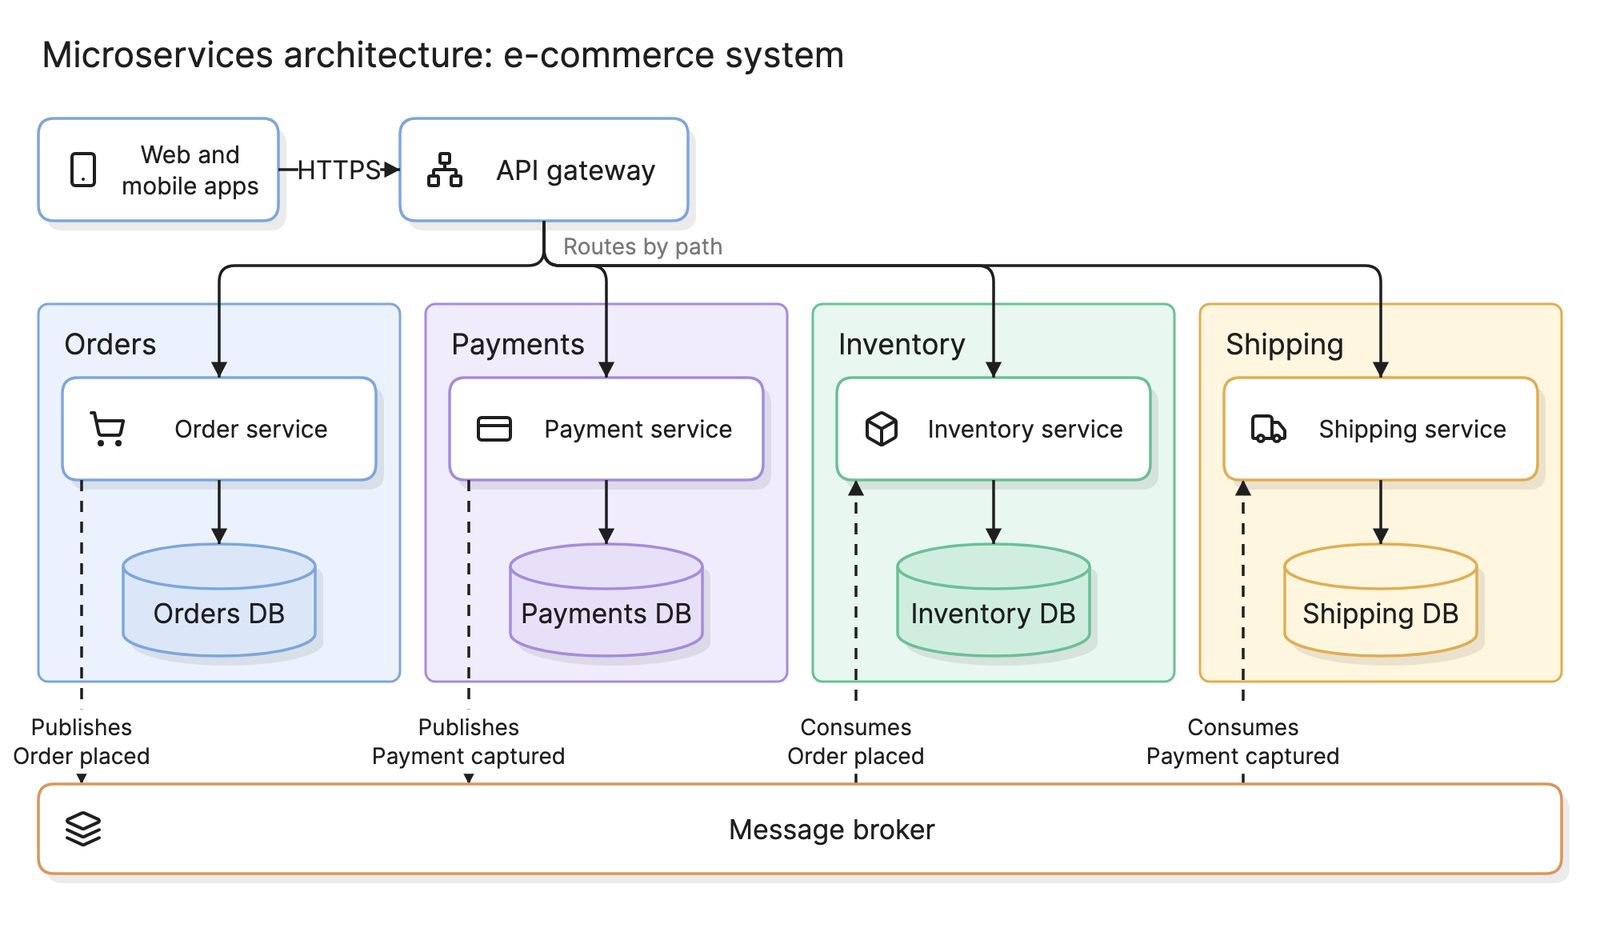
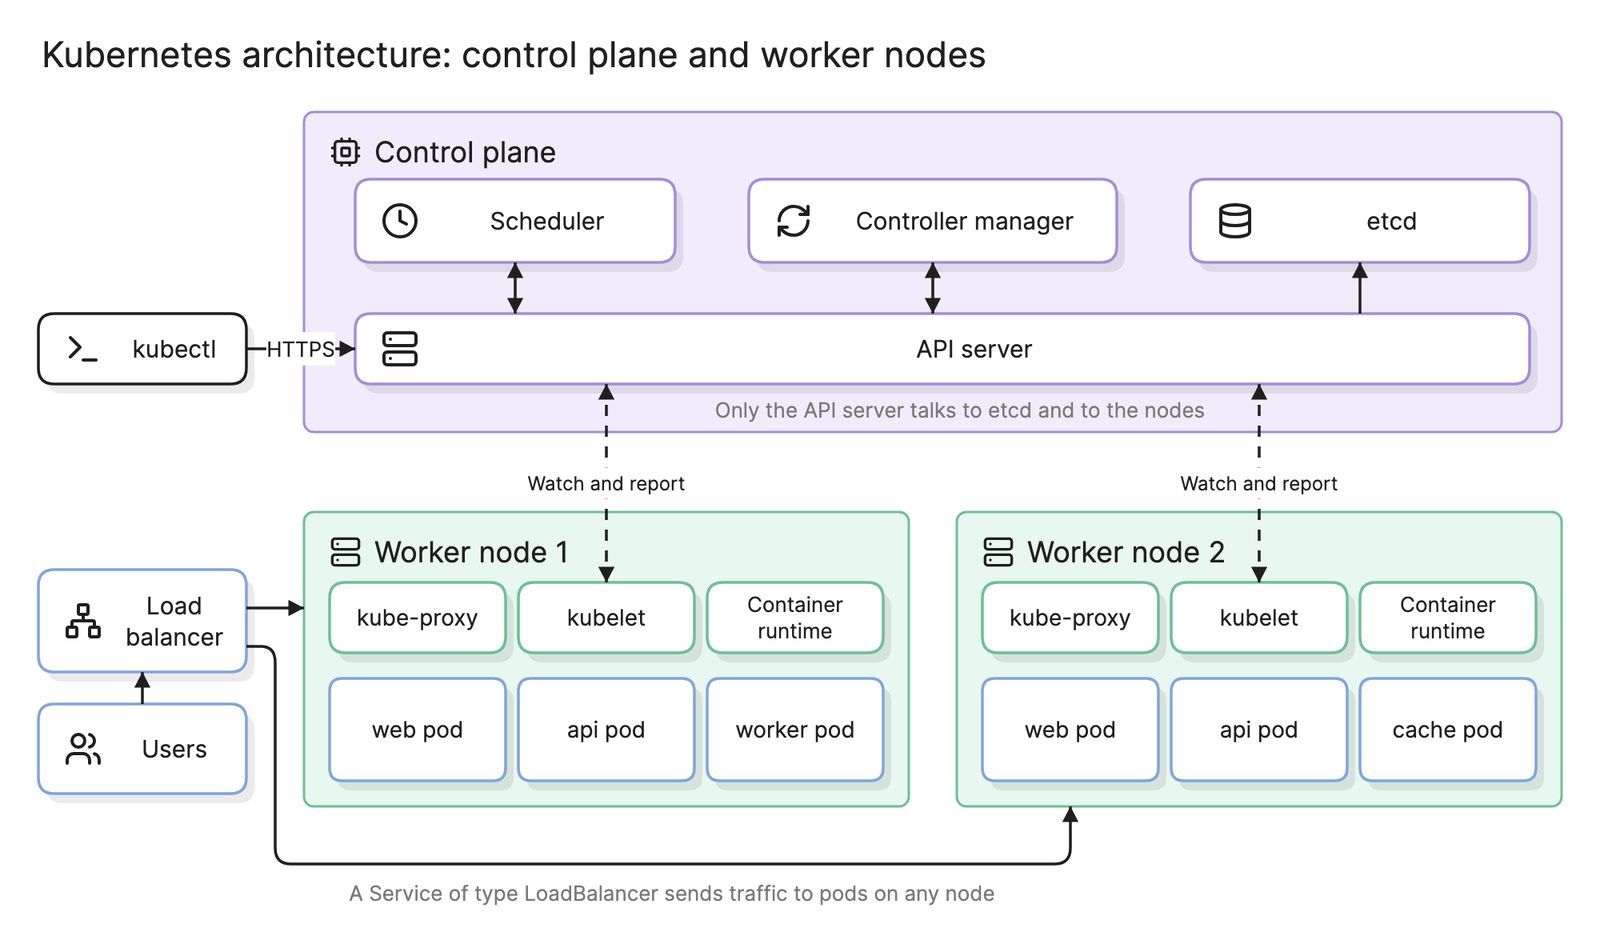
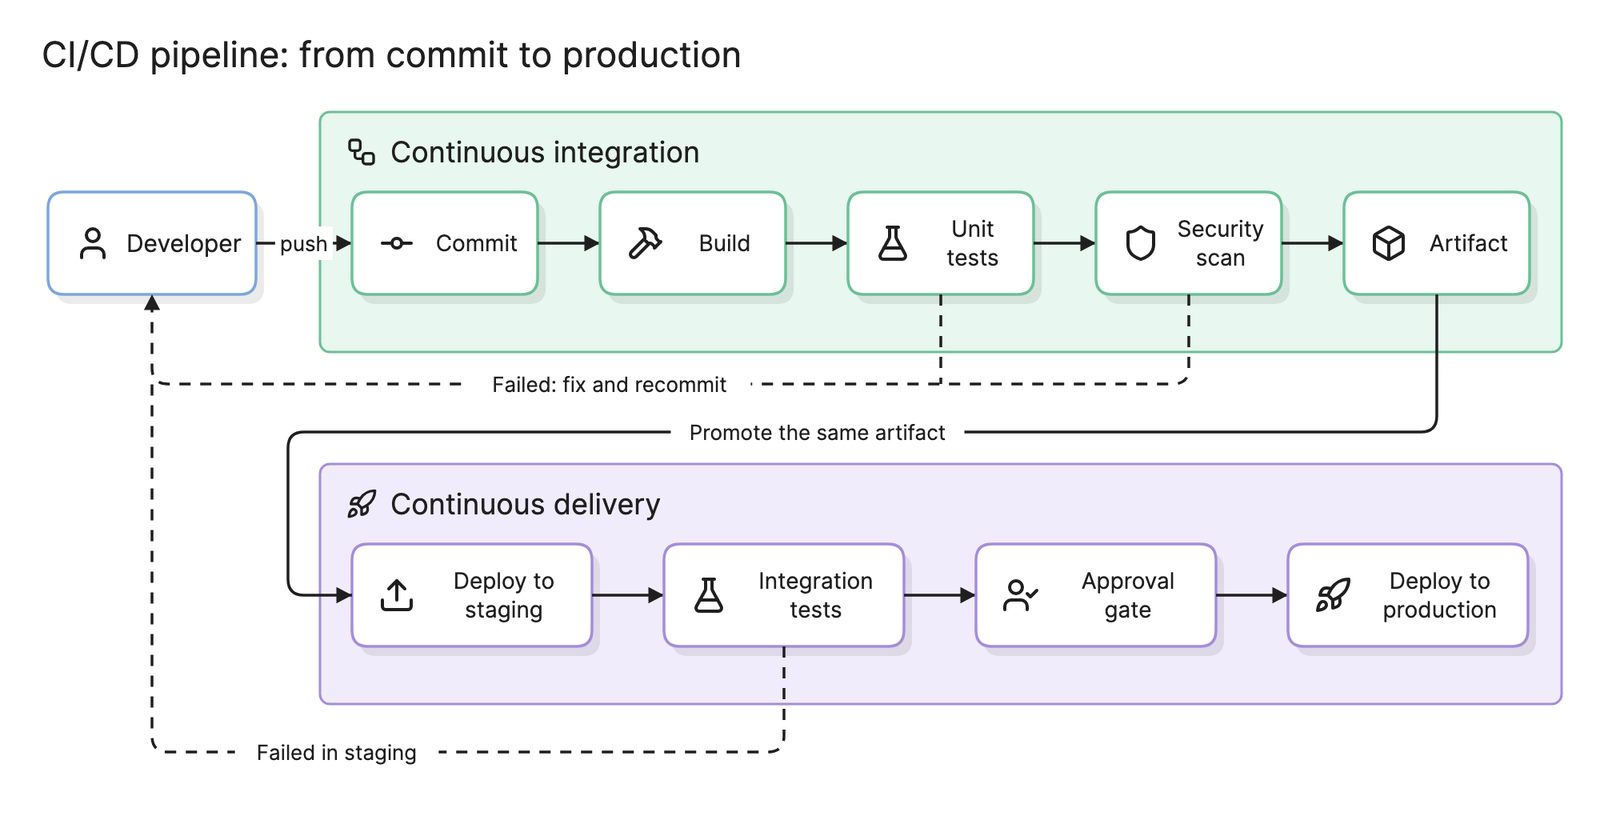
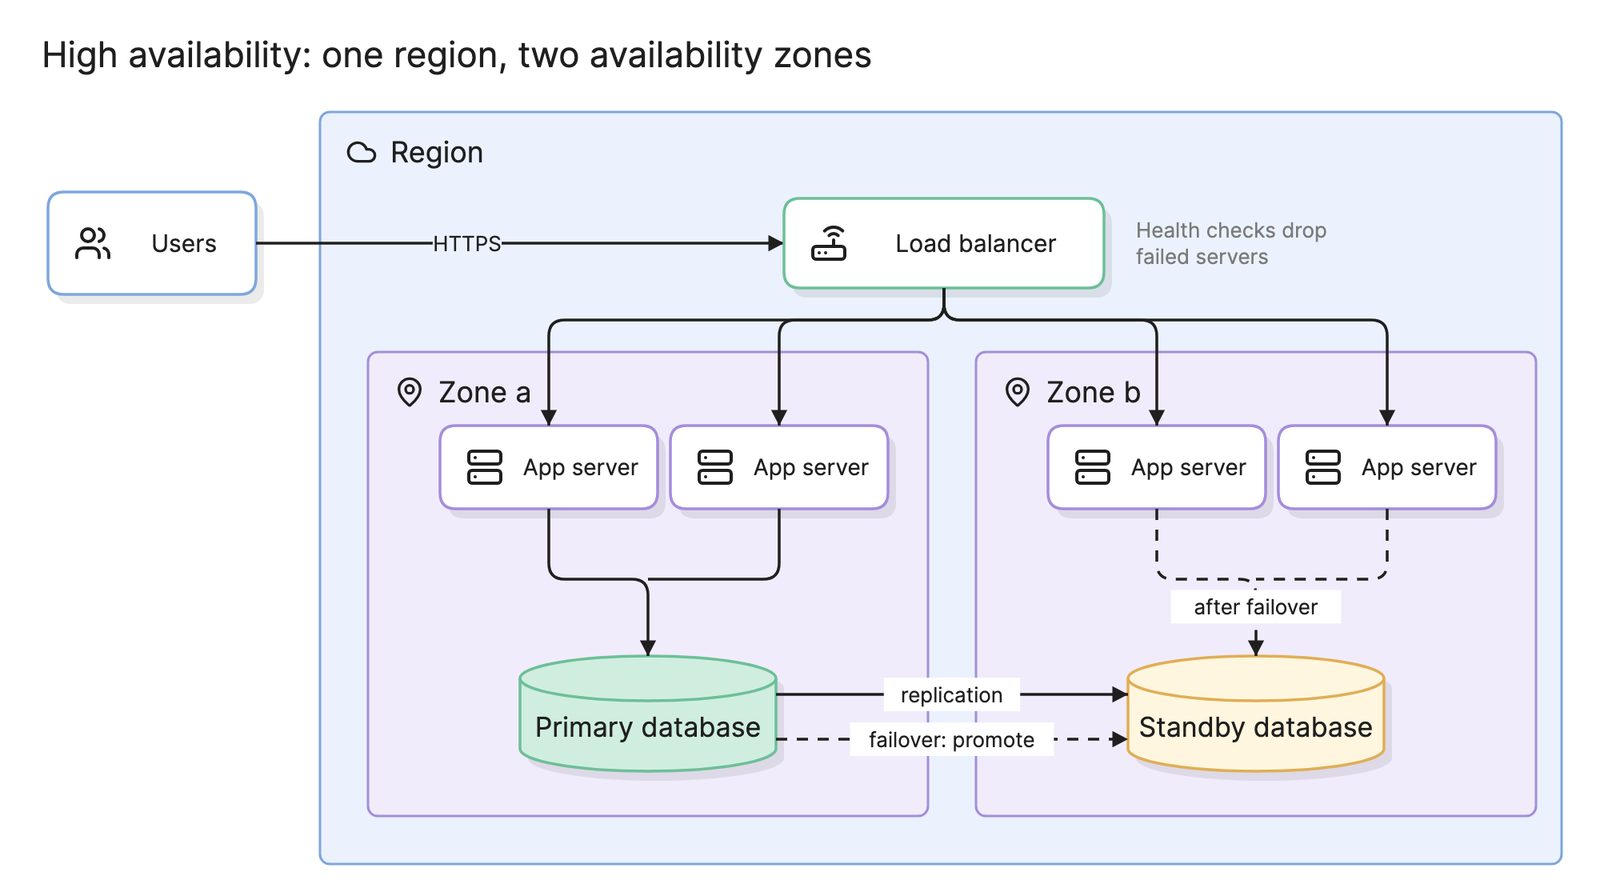
Observability is what high availability relies on to know a failover happened, what a CI/CD pipeline uses to judge a canary and what makes a Kubernetes architecture or a service mesh debuggable. Message queue consumers need the trace id carried inside the message, or the trace ends at the producer.
What tools help with observability?
- Open-source instrumentation and backends. The open standard’s SDKs and collector, a time-series database for metrics, a log aggregation system and a tracing backend, usually run together on a Kubernetes architecture.
- Hosted observability platforms. Commercial services and the monitoring suites built into every cloud computing architecture that store all three signals, correlate them and manage SLOs and paging.
- AI diagramming tools. Tools like Eraser turn a description of your services, collector and backend into an architecture diagram, and a traced request into a sequence diagram, so the picture of the pipeline lives beside the runbooks that depend on it.
For more on this kind of diagram, see DevOps diagrams.
Frequently asked questions
-
What is the difference between observability and monitoring?
Monitoring watches for conditions you defined in advance: CPU over 90 percent, error rate over 1 percent. Observability is the property of a system that lets you ask new questions about its behavior from the data it already emits, so you can debug a failure you did not predict. Monitoring is one use of an observable system.
-
What are the three pillars of observability?
Logs, metrics and traces. Logs are timestamped records of discrete events. Metrics are numeric measurements aggregated over time, such as requests per second. Traces follow one request across every service it touches as a tree of timed spans. The value comes from correlating them, such as jumping from a latency spike in a metric to the trace of a slow request.
-
What is OpenTelemetry?
OpenTelemetry is an open-source, vendor-neutral standard and set of SDKs for producing logs, metrics and traces, plus a collector that receives, processes and exports them. Instrumenting with it means the backend can be swapped without touching application code. It is the most common way new systems are instrumented, and most observability backends accept its format.
-
What is an SLO and how does it relate to alerting?
A service level objective is a target for a measurable property of the service, such as 99.9 percent of requests succeeding within 300 milliseconds over 30 days. The gap between the target and 100 percent is the error budget. Alerting on how fast the budget is being spent, rather than on raw thresholds, pages people only when users are actually affected.