Guide
How to generate an application architecture diagram from code
Connect your application's repository, ask Eraser for one diagram of what runs, where data lives and what it calls, then check it against the code.
There is a software architecture diagram on the wiki, and it shows the application as it was two years ago. Since then a queue arrived and a service was split in two. The current facts are in the repository, spread across a compose file, the config and whatever each service imports.
This guide starts from that repository. You connect it to Eraser, ask for one architecture diagram of the application, and check the result against a short list. The diagram shows what runs, where the data lives and what the code calls, with no notation to learn. It takes about fifteen minutes, and most of that is the check. For leveled diagrams in C4 notation, How to generate C4 diagrams from a GitHub repo uses the same method.
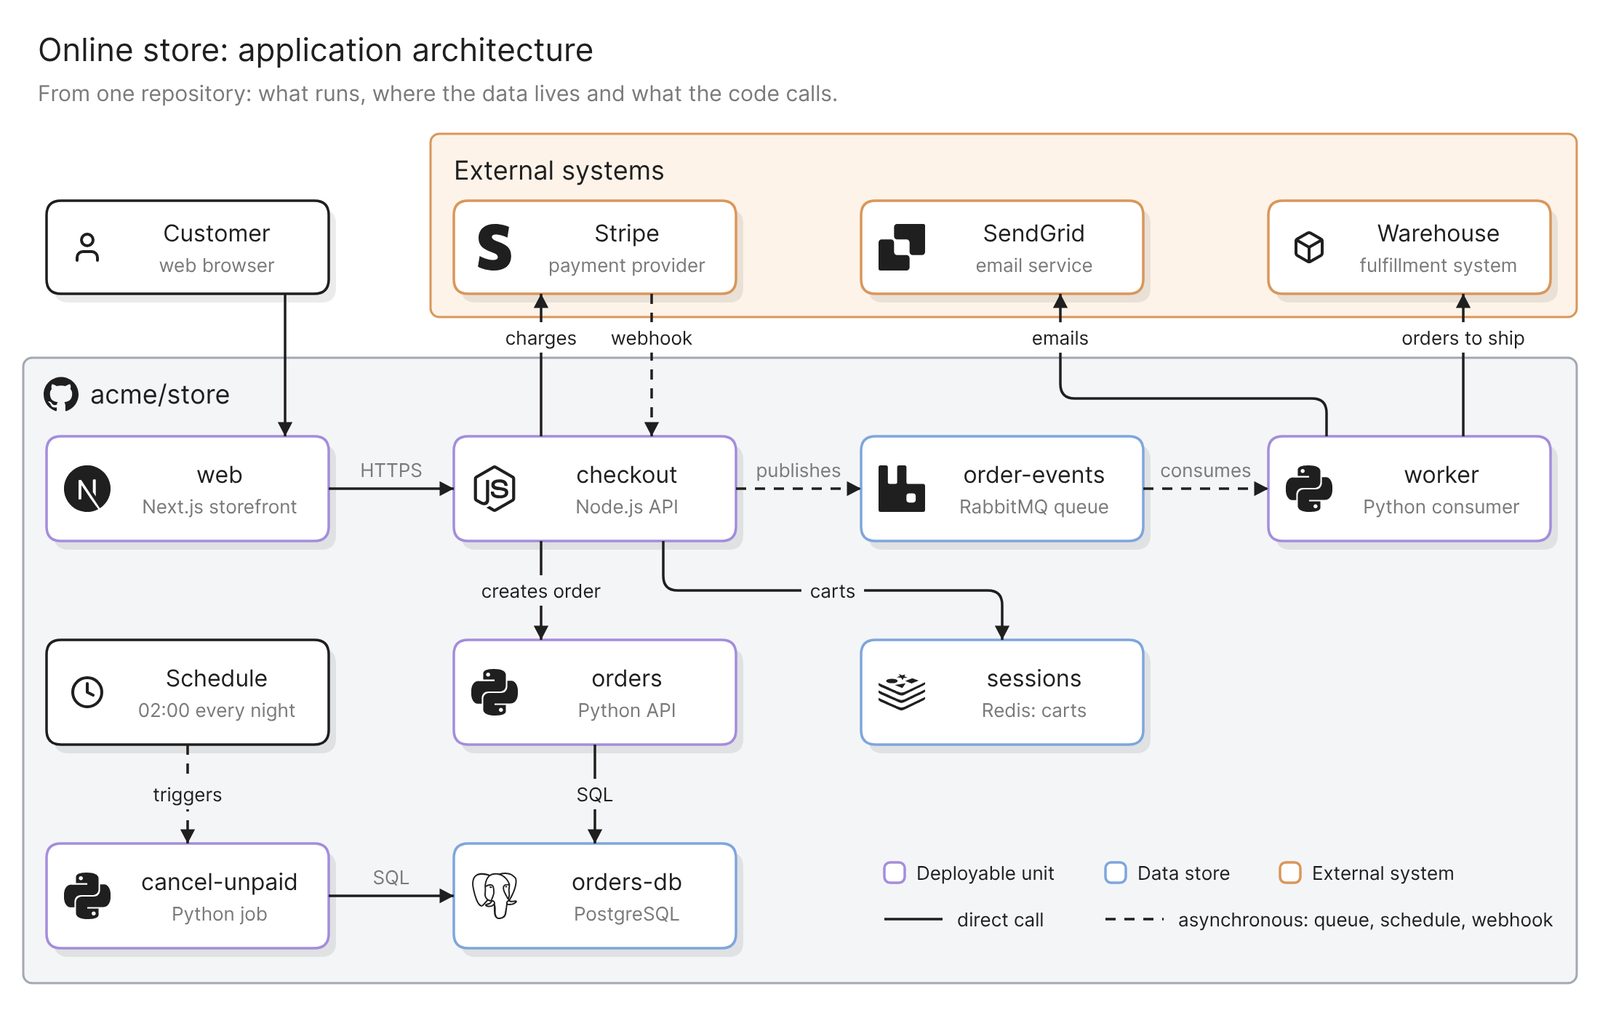 Example: one application, with what runs, where the data lives and what the code calls
Before you start
You need two things:
- Access to Eraser
- Access to the application’s repository on GitHub, GitLab or Azure DevOps. A public repository needs no connection
Eraser draws from the files in the repository you attach. It does not see runtime state or anything set up only in a cloud console, and a service kept in another repository appears only where this one refers to it. Treat the result as a draft of what the code describes, to be checked by someone who knows the system.
Step 1. Connect the repository
For a private GitHub repository, you install the Eraser GitHub App and choose which repositories it can read. GitLab and Azure DevOps repositories connect with an access token instead. The docs have the steps for each.
If the code is split across several repositories, start with the one that holds the compose file or the infrastructure folder, where the list of what runs is written down.
Step 2. Ask for the architecture diagram
Start a new AI diagram, attach the repository, and say what belongs on the diagram:
Draw an architecture diagram of the application in this repository. Show
every deployable unit, every data store and every external system the
code calls. Include queues, scheduled jobs and webhooks as well as direct
calls. Use compose.yaml for what runs and the folders under services/
for what each service calls. Use the names from the code.
Each phrase asks for something a shorter prompt leaves open. “Deployable unit” means one box per process, so a worker that shares code with its API gets a box of its own. “Data store” covers caches and queues along with the database. Queues, scheduled jobs and webhooks are the paths that do not start with a user’s request, so they are the first to be left off.
Swap in your own paths. Eraser scans the files relevant to the prompt, and naming a folder or a file tends to give a better result.
The result is an ordinary diagram. You can move, rename and regroup anything by hand, or keep prompting.
Step 3. Check it against the code
Each part of an architecture diagram is written down in a different kind of file. Knowing which one tells you where to look when a part is missing.
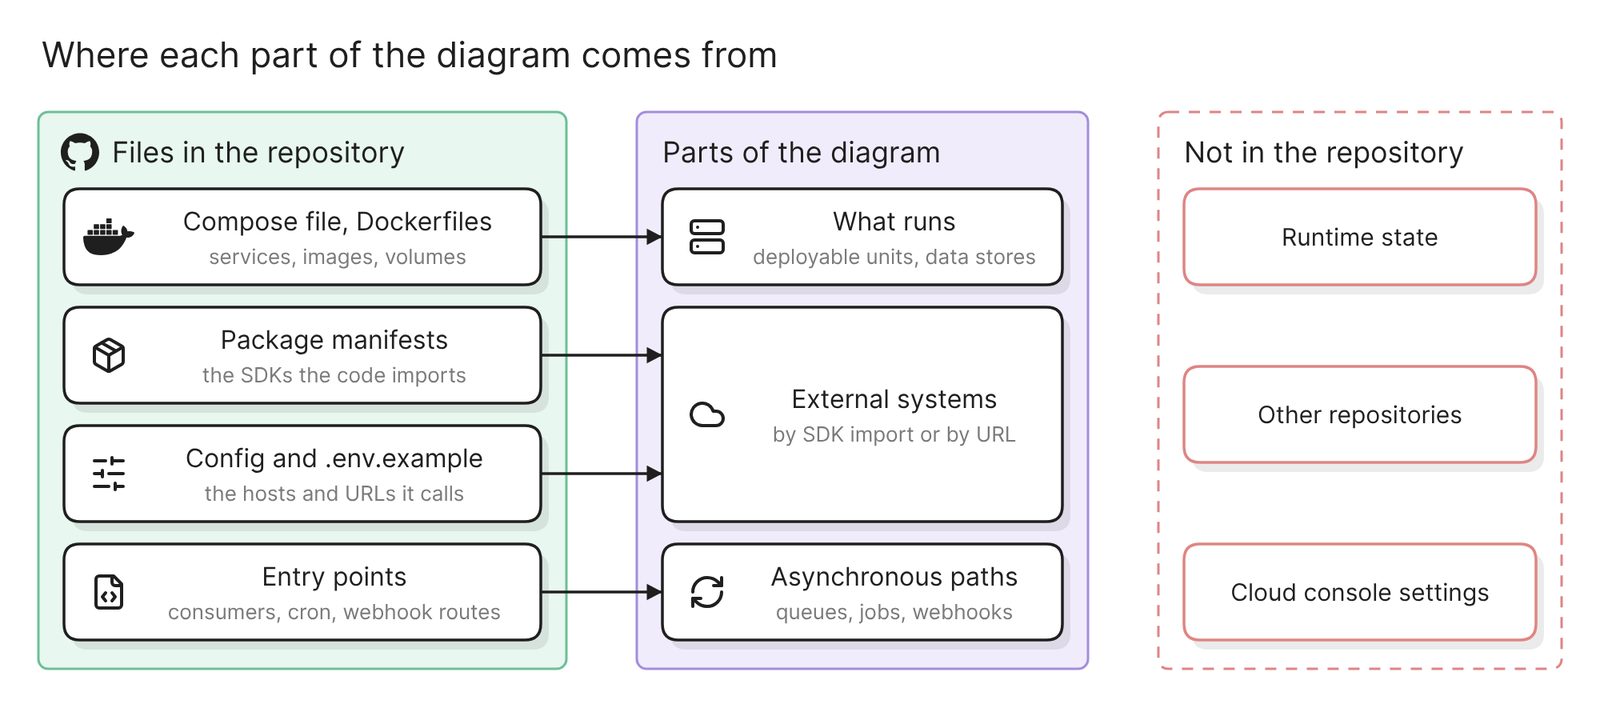 Where each part of an architecture diagram is written down, and what a repository does not hold
Go through the diagram with these five checks:
- Every deployable unit is a box. Compare the boxes with the services in the compose file or the deploy config. Count workers and scheduled jobs, which run as their own processes.
- Every data store is present. The main database is rarely missed. A cache, a queue or a file bucket is easier to miss, because the code reaches it through a client library and a connection string.
- External systems are there. A payment provider or an email service appears in code only as an SDK import or a URL in config. Search the package manifests and the example environment file, and compare the names with the diagram.
- Asynchronous paths are drawn. Look for a queue between the service that publishes and the one that consumes, a box for each scheduled job, and an arrow for each webhook a third party sends.
- Names match the code.
orders-dbis a name people can search for. “Order Management Database” is a name the diagram made up.
Generic boxes are the sign of a weak result. A “Frontend”, a “Backend” and a “Database” fit any application. When a part is missing, name the file that shows it and ask again:
Add the nightly job in jobs/cancel_unpaid.py, which deploy/crontab
schedules. Add the warehouse system that services/worker/config.py
reaches through WAREHOUSE_API_URL. Change nothing else.
Then walk one real request through the diagram with someone who runs the system. Anything they name that is not in the repository, such as a CDN or a queue created in a cloud console, has to be added by hand.
More diagrams from the same repository
Each of these prompts asks for a different diagram of the same code.
One service opened up
Draw the main modules inside the checkout service, using the code in
services/checkout/. Show which module handles each route and which ones
call Stripe, Redis, the orders service and the queue. Leave out helpers
and tests.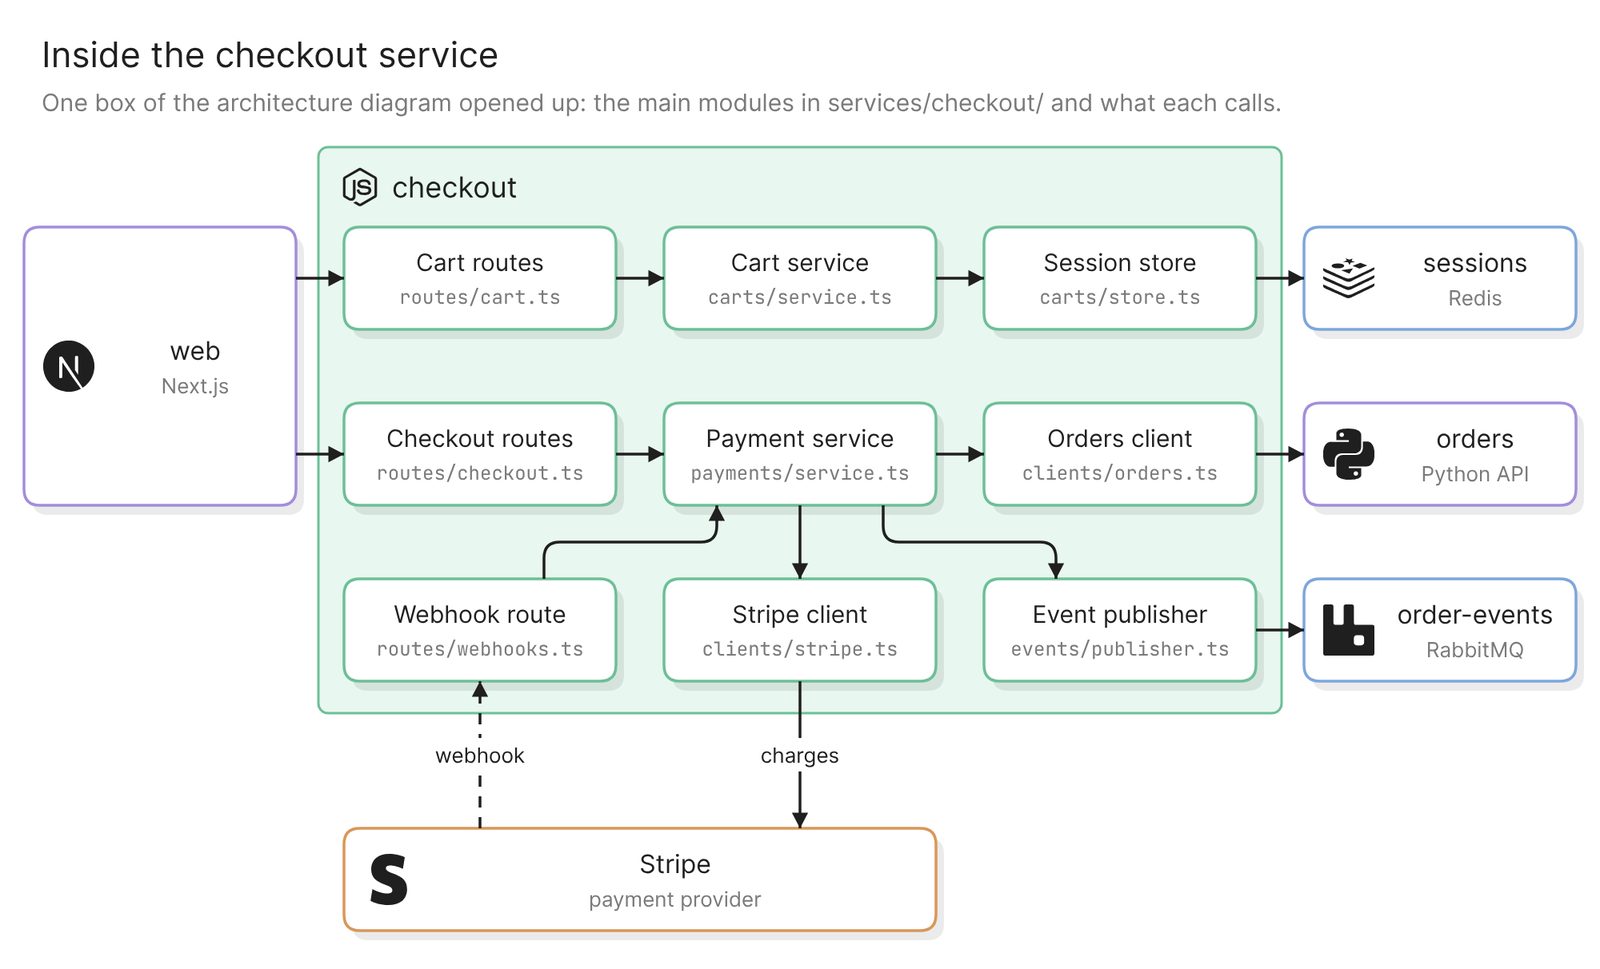 Example: the main modules inside one service, each with the file it lives in
This is the diagram for the engineer who is about to change the service. Check each box against a file that exists.
A deployment view
Draw a deployment diagram from compose.yaml. Show each container with its
image or build folder and its published ports, the network the
containers share and the volumes they mount.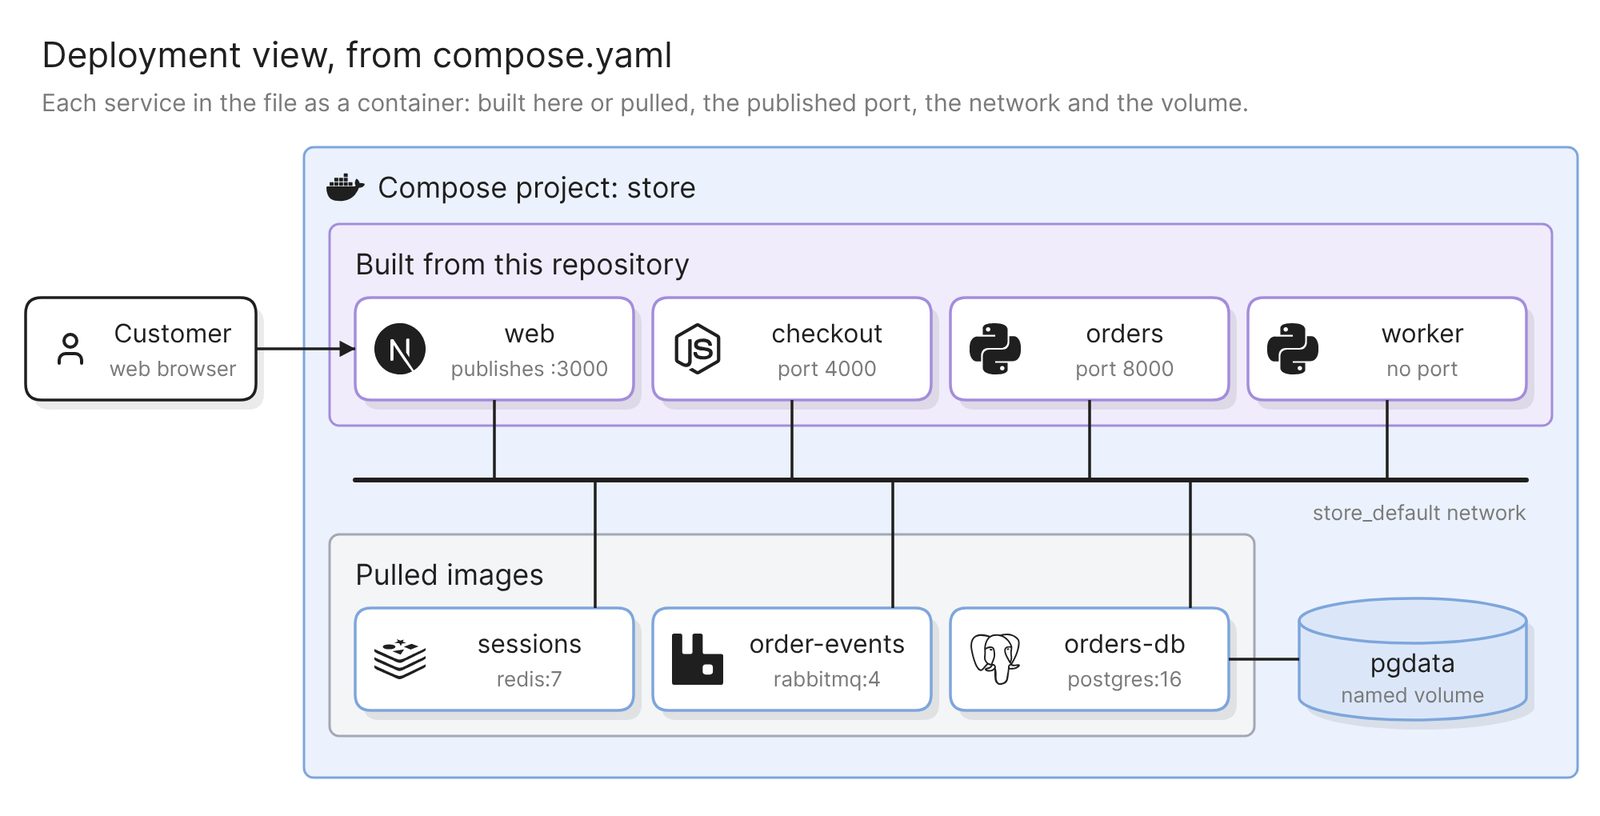 Example: the containers, network and volume that one compose file defines
A Compose file defines an application’s services, networks and volumes, which is enough for a deployment diagram of that setup. The view holds only what that file defines, so the nightly job from the first diagram, which is scheduled elsewhere, is absent. For the production layout, point the same prompt at the Terraform or Kubernetes folder.
A technical architecture diagram for non-engineers
Draw a technical architecture diagram of this application for a reader
who does not write code. Use four layers: clients, application, data and
third parties. Keep it under ten boxes, with plain names and no file
paths.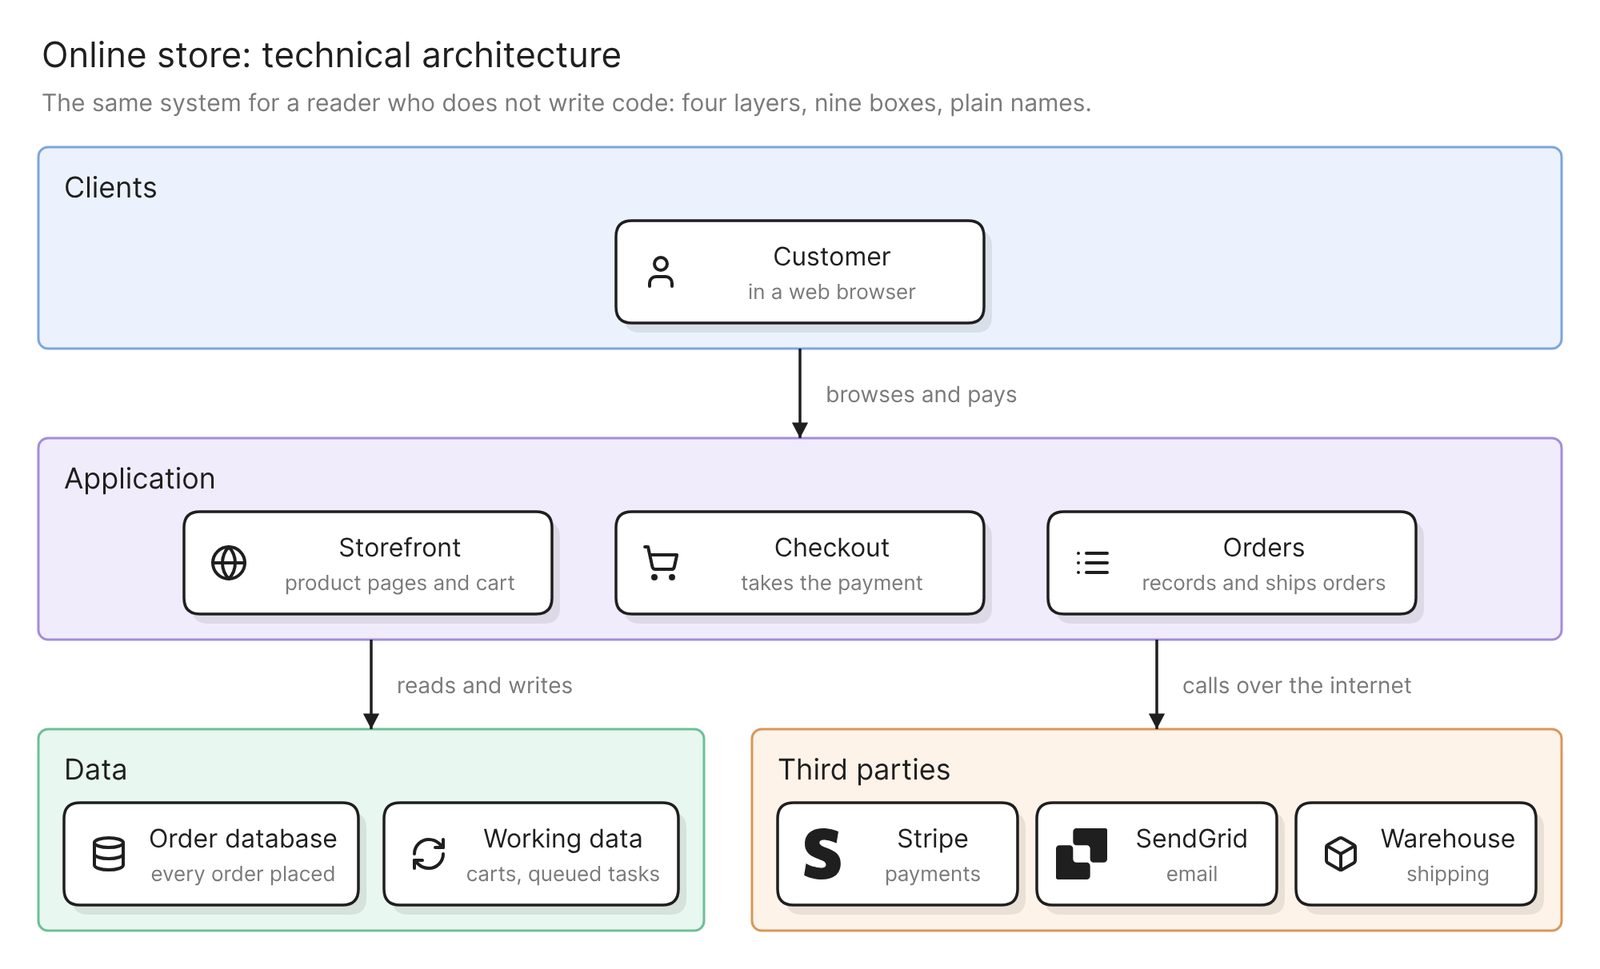 Example: the same system in four layers, for a reader who does not write code
This is the diagram for a security questionnaire or a new manager. It follows the three-tier shape of presentation, application and data, with third parties as a fourth band. Each box should still map to boxes on the full diagram.
One request path
Draw a sequence diagram of what happens when a customer pays for an
order, from the checkout request to the confirmation email. Include the
Stripe webhook and the message on the queue.
The architecture diagram shows that the queue exists. A sequence diagram shows when it is used, which is what an incident review needs. Check the order of the calls against the route handler.
Keep it current
An architecture diagram drifts with every pull request that adds a service or a dependency. Eraserbot handles that. You give it a prompt and the files to watch, such as the compose file and the service folders. When a pull request changes those files, Eraserbot redraws the diagram and posts it as a comment within a minute or two. The saved diagram updates on merge. It works with GitHub and GitLab.
A finished diagram can be shared with a link, exported as an image or a PDF, or embedded in your team’s docs. On GitHub you can also commit the diagram file to the repository.
Other ways to get an architecture diagram from code
- Generate a dependency graph. dependency-cruiser and Madge draw which JavaScript modules import which, and pydeps does it for Python. All three can point out circular imports. The result is a dependency graph of files and imports. What runs, where the data lives and which calls cross the network are not on it, so it is the right tool for untangling code and the wrong one for explaining a system.
- Write it as text. D2 is “a diagram scripting language that turns text to diagrams”, and Mermaid has an architecture diagram type that is in beta as of November 2026. That suits a team that wants the diagram reviewed in pull requests like any other file. Someone writes every box and line by hand, and nothing checks them against the code. Best diagram-as-code tools in 2025 compares the options.
- Ask your coding agent. An agent that is already working in the repository can draw through a diagramming MCP server. That suits an engineer who wants the diagram in the middle of a task. It reads the same files, so it has the same blind spots. Claude Code diagrams: draw your codebase with an MCP server walks through it.
FAQ
Can AI generate an architecture diagram from code?
Yes, as a draft. It reads the repository and draws what the files describe. Someone who knows the system still has to check it, mostly for external systems, asynchronous paths and anything defined outside the repository.
Does the diagram show what is running in production?
No. It shows what the files in the repository describe. Replica counts, feature flags and resources created by hand in a cloud console are not in those files.
What if the application is spread across several repositories?
These steps attach one repository. A service that lives elsewhere appears only where this repository’s code refers to it, as a client or a URL. Generate a diagram for each repository and join them by hand.
Does this work for a monolith as well as microservices?
Yes. A monolith gives a top-level diagram with few boxes, so ask for the main modules inside it as well. With microservices, the top-level diagram carries the queues and the calls between services, so check it hardest.
How do I make a technical architecture diagram for a non-technical audience?
Ask for the same repository in layers, with plain names and under ten boxes. The prompt is in the section above. Keep the detailed diagram as well, and link the two.
Where to go next
If the application is not built yet, the architecture diagram generator draws one from a description, and so does the system architecture diagram generator. The Git diagrammer is a quick way to try a repository. For where the diagram goes in a design doc, see Technical design document: template and diagrams from your repo.
The glossary’s system architecture page covers the views that one diagram cannot hold. For reference diagrams, see Docker architecture, Transactional workflows with microservices on Google Cloud and a Three-tier web app on Google Cloud.